Changes in the properties of grassland soils as a result of afforestation
iForest - Biogeosciences and Forestry, Volume 11, Issue 5, Pages 600-608 (2018)
doi: https://doi.org/10.3832/ifor2556-011
Published: Sep 25, 2018 - Copyright © 2018 SISEF
Research Articles
Abstract
The effects of afforestation on physical, physico-chemical, and biological properties of grassland soils were investigated in three sites (215-230 m a.s.l.) located within the urban area of Krakow (southern Poland) after 45-60 years since the introduction of forest tree species. We compared the contents of nutrients and the composition of humus between forest and adjacent grassland soils, as well as the quality of the forest soils in relation to the introduced tree species (alder, pine, oak, birch, maple, elm). We hypothesized that afforestation of grassland soils results in the increase of acidity and nutrient contents. Studied soils belong to Dystric Gleysols (forest) and Eutric Gleysols (grassland). Overall, 168 soil samples were taken from two layers (0-10 cm and 10-30 cm) both from forest and grassland soils. The results showed an increase of organic carbon (up to 150%), total nitrogen (up to 70%) and total acidity (up to 18 times), as well as a decrease of pH (up to 40%) and activity of dehydrogenase (up to 60%) in forest soils in relation to the respective grassland soils. The most intensive changes were observed in the topsoil layers (0-10 cm). We also calculated the Soil Quality index (SQI) based on PCA in which only soil parameters with high load factors were taken into consideration. SQI ranged from 0.39 to 0.41 in grassland soils and from 0.33 to 0.37 in forest soils. Among forest soils, the highest value of SQI was obtained for stands dominated by black alder, indicating that such species is the most suitable for afforestation purposes under the study conditions. The results may be helpful in the realization of afforestation plans of humid grassland soils.
Keywords
Land Use Change, Physico-chemical Soil Properties, Soil Quality Index
Introduction
The current forest surface in Poland covers only 29.5% of the total country area and amounts to 9.215.000 ha, according to Central Statistical Office ([15]). Poland is implementing the National Program for Afforestation which aims at increasing total forest area up to 33% in 2050 ([14]). The task of the program is to determine which land should be afforested and which species should be used for afforestation. The selection of species composition is of particular importance in afforestation projects, especially in oligotrophic lands ([30]).
Forests in Krakow (southern Poland) cover an area of approximately 1430 ha, i.e., 4.4% of the total land area. This coverage is one of the lowest in Poland ([15]). Landscape and geomorphological structure in Krakow and its surroundings are very heterogeneous. There are Jurassic and Cretaceous formations (limestone, marl), Tertiary formations (Miocene clay) and Quaternary formations of sand, gravel and clay ([2]).
In this area, afforestation of grasslands carried out in 1955, 1965 and 1970 has created forest complexes (secondary communities) characterized by small areas, lack of spatial continuity and long distances from older forest stands. These features affect the floral composition of forest communities leading to the depletion of forest flora ([14]). Initially, the afforestation was performed on the poorest sandy meadows and wastelands. In recently afforested areas, carbon content increases with time and this results in substantial carbon storage ([41], [25]). However, at an early stage of the new forest growth, the accumulation of carbon is relatively slow, but this process can noticeably accelerate after several decades ([45], [47]). Accumulation of carbon in forest soils depends on the age of trees, species introduced during afforestation and the fertility of soil environment ([21], [24]). Afforestation also results in soil acidification which depends on the tree species, increasing with time passed since afforestation. Some tree species such as the black alder (Alnus glutinosa L.) are symbiontic with Frankia alni, a nitrogen-fixing bacteria living in root nodules ([13]), and may enrich the soil with nitrogen ([48]). It is estimated that approximately 30-130 kg N ha-1 year-1 of fixed nitrogen enters the soil as the result of alder leaf fall ([13], [29]). Jonczak et al. ([28]) observed a higher decomposition rate of alder leaves, which are rich in nitrogen, as compared with maple, oak and beech leaves.
Previous studies on the impact of alder on soil properties have shown an increase in available phosphorus and magnesium ([10], [39]), which improves the fertility of poor forest habitats and accelerates elements cycling in the ecosystem. Giardina et al. ([20]) and Claessens et al. ([13]) regard the alder as a “biological fertilizer”. It is often used as a pioneer species during the establishment of new forests on reclaimed post-industrial areas, as well as to improve the trophic conditions of land designated for afforestation ([10], [30], [34], [35]). Moreover, the black alder is well-adapted to grow and develop in humid ecosystems ([13]). According to CSO ([15]), the black alder occurs in approximately 5.3% of Polish forests.
It is assumed that about 50-60 years after the introduction of forests on sandy soils of grassland habitats, an increase in the soil acidification and an accumulation of nutrients, especially organic carbon and total nitrogen occurs. A species increasing these parameters is the black alder which in the studied areas constitutes about 25-80% out of all tree species.
The aim of the study was to evaluate the influence of forest stands on grassland soil properties. We compared the contents of nutrients and the composition of humus between forest and adjacent grassland soils, as well as the quality of the forest soils in relation to the introduced tree species. Our assumption was that differences in the properties between forest and grassland soils could be attributed to the influence of tree species introduced by afforestation.
Materials and methods
Study area
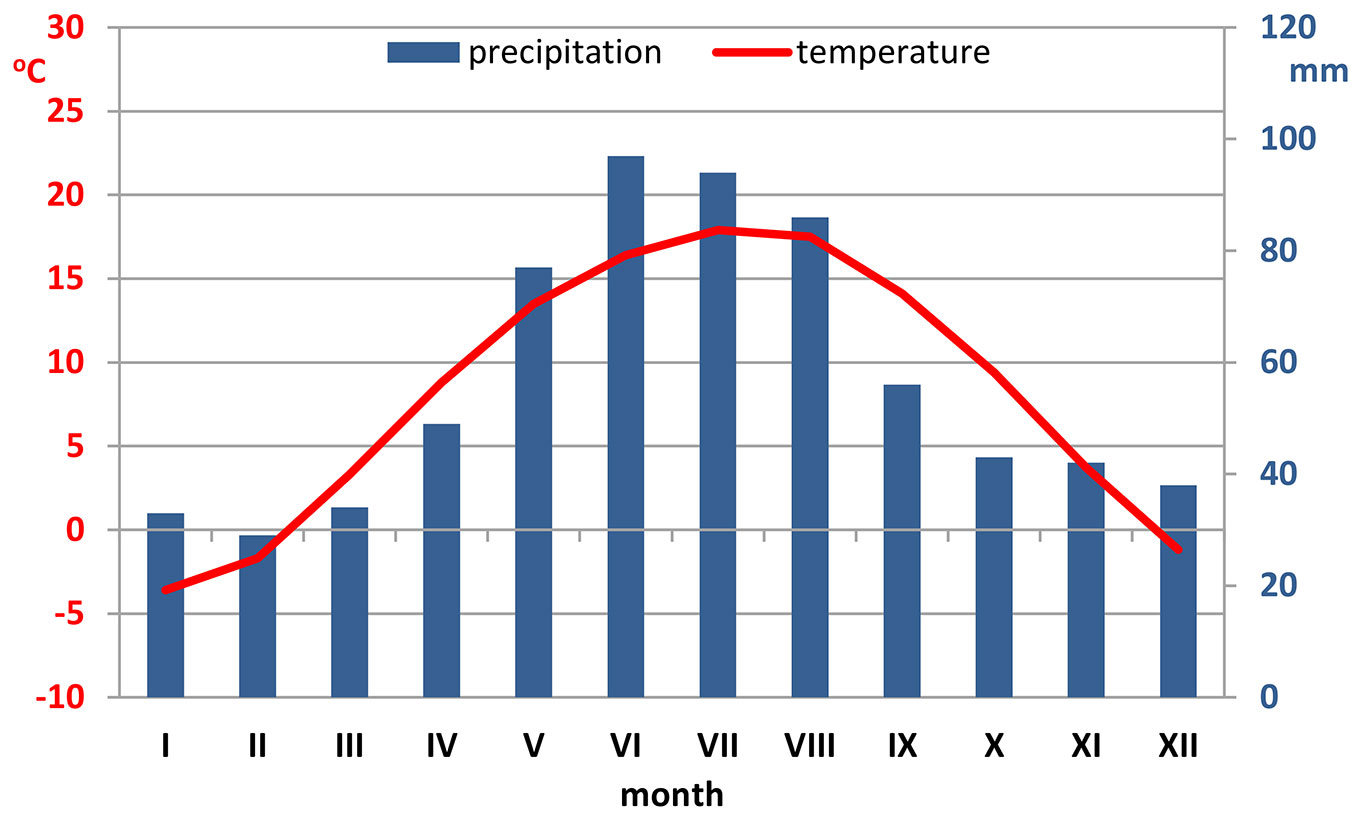
Krakow is located in southern Poland, on the Vistula River (50° 03′ 41″ N, 19° 56′ 18″ E). The climate is mild and warm, with a mean annual temperature of about 9 °C. The sum of annual precipitation ranges between 650 and 700 mm with the maximum rainfall in July (Fig. 1). The prevailing winds are western and south-western, depending on both the general circulation and the local winds along the valley of the Vistula river ([33] - ⇒ https://pl.climate-data.org/location/715022).
Fig. 1 - Ombrothermic diagram of the study area based on meteorological data (last decade - ⇒ https://pl.climate-data.org/location/715022).
The study area is flat with elevation ranging 215-230 m a.s.l. The soil cover was developed from Quaternary, water-bearing, fluvioglacial sands deposited on Miocene clays. Forest soils belonged to Dystric Gleysols and grassland soils belonged to Eutric Gleysols ([51]) and were characterized by elevated levels of ground water. Organic horizons 2-3 cm deep occurs only in stands with Pinus sylvestris. Within the A horizon of forest and grassland soils the layers 0-10 cm and 10-30 cm are separated. The characteristics of the whole A horizons is presented in Tab. 1.
Tab. 1 - Characteristics of studied A horizons in the soil of forest and grassland study sites.
| Habitat | Sites | Thickness range (cm) |
Colour (Munsell chart) |
Structure |
|---|---|---|---|---|
| Grassland | G1 | 28-32 | 10 YR3/2 - 3/3 | granular/ crumb |
| G2 | 27-35 | 10YR 4/2 - 4/3 | granular / crumb | |
| G3 | 29-33 | 10YR 2/1 - 2/2 | granular / crumb | |
| Forest | F1 | 27-34 | 10YR 3/1 - 2/1 | crumb |
| F2 | 28-33 | 10YR 4/3 - 4/4 | crumb | |
| F3 | 28-32 | 10YR 3/2 - 3/3 | crumb |
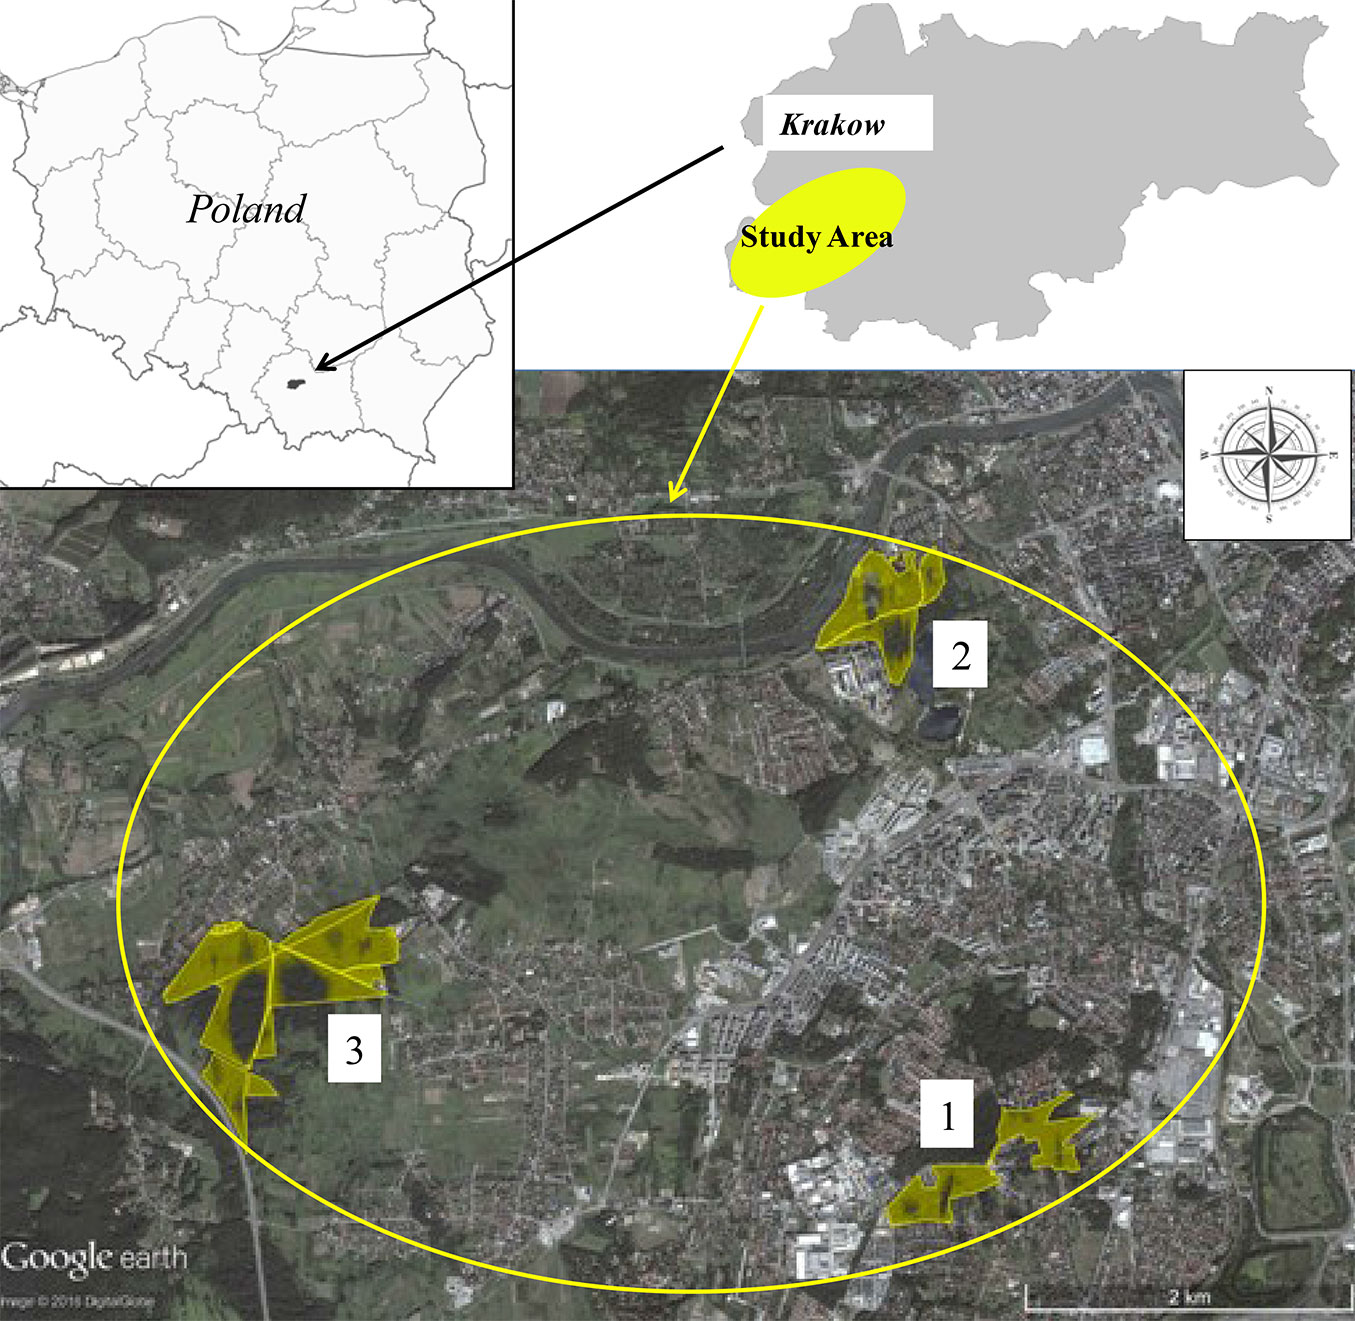
Forest (F) and adjacent grassland (G) soils were sampled at three sites located within the boundaries of Krakow urban area (Fig. 2): Borek Falecki (area 1: F1, G1), Skalki Twardowskiego (area 2: F2, G2), and Skotniki (area 3: F3, G3).
Fig. 2 - Location of the study area (Krakow, southern Poland) with indication of the three study sites where soil samples were taken. (1): Borek Falecki; (2): Skalki Twardowskiego; (3): Skotniki.
The first sampling site (2.30 ha) is a ~60-year old tree stand (F1) in Borek Falecki, with stand density of 603 tree ha-1 and the following specific composition: Pinus sylvestris L. (30%), Alnus glutinosa L. (25%), Quercus robur L. (25%), Betula pendula Roth. (20%). In the undergrowth Prunus serotina Ehrt., Padus avium Mill., and Sambucus nigra L. are predominant. The average loss of pine needles was 14%, and for deciduous species the average loss of the assimilation apparatus was 8%. According to the Forest Protection Instruction ([19]) a slight defoliation was determined for pine, no defoliation for deciduous species.
The second sampling site (1.60 ha) is a ~50-year old tree stand (F2) in Skalki Twardowskiego, with stand density of 646 tree ha-1. This area was covered by the following species: Alnus glutinosa L. (25%), Acer pseudoplatanus L. (25%), Acer platanoides L. (20%), Betula pendula Roth. (20%) and Ulmus laevis Pall. (10%). In the undergrowth Sambucus nigra L. predominated. The average loss of the assimilation apparatus was 6%. According to FPI ([19]) no defoliation was determined.
The third research sampling site (2.60 ha) is a ~45-year old tree stand (F3) in Skotniki, with stand density of 706 tree ha-1. The following species were determined in the vegetation cover: Alnus glutinosa L. (80%), Betula pendula Roth. (20%). In the undergrowth there were mainly Crataegus oxycantha L., and Sambucus racemosa L. The average loss of the assimilation apparatus was 5%. According to FPI ([19]) no defoliation was determined.
Grassland vegetation communities (G1-G3) belonged to the same Molinio-Arrhenatheretea class. In G1 (2.1 ha) Cirsium rivulare (Jacq.) All., Caltha palustris L., Polygonum bistorta L., Cirsium oleraceum L. Scop., and Festuca pratensis Huds. were the dominating species. In G2 (1.7 ha) Succisa pratensis, Molinia caerulea, Cirsium rivulare (Jacq.) All., Caltha palustris L., and Galium borealne dominated, and in G3 (2.4 ha) Molinia caerulea, Galium boreale, Succisa pratensis, Serratula tinctoria, Gladiolus imbricatus, and Dianthus superbus were the dominant species ([38]).
Sampling and laboratory analyses
For the purpose of this study, pairs of adjacent grassland and forest soils were selected. The investigated soils were under identical climate conditions and had the same system of water relations. The relief was also similar as well as the geological origins of the bedrock, which resulted in similar texture (Tab. 2). The soil properties before the change of land use (from grasslands to forests) were similar, which allows to consider the grassland soils as reference soils ([38]).
Tab. 2 - Physical and physico-chemical properties (mean ± standard deviation) in layers 0-10 cm and 10-30 cm of differently used soils. Different letters indicate significant (p<0.05) differences between mean values. (Hh): total acidity [mmol(+) kg]; (BC): basic cations [mmol(+) kg]; (BS): base saturation [%].
| Layer | Property | Borek Falecki (area 1) | Skalki Twardowskiego (area 2) | Skotniki (area 3) | |||
|---|---|---|---|---|---|---|---|
| Grassland (G1) | Forest (F1) | Grassland (G2) | Forest (F2) | Grassland (G3) | Forest (F3) | ||
| 0-10 cm | 2.0-0.05 [%] | 88 ± 2 | 88 ± 1 | 90 ± 1 | 92 ± 1 | 87 ± 2 | 88 ± 2 |
| 0.05-0.002 [%] | 7 ± 2 | 6 ± 1 | 5 ± 1 | 5 ± 1 | 9 ± 2 | 7 ± 2 | |
| <0.002 [%] | 5 ± 2 | 6 ± 1 | 5 ± 1 | 3 ± 1 | 4 ± 2 | 5 ± 2 | |
| pH1M KCl | 5.71 ± 0.03 a | 3.80 ± 0.05 b | 5.43 ± 1.22 a | 4.13 ± 0.04 b | 4.45 ± 0.03 a | 3.69 ± 0.01 b | |
| Hh | 3.61 ± 0.10 a | 61.36 ± 1.92 b | 1.61 ± 0.05 a | 25.35 ± 2.87 b | 6.80 ± 0.39 a | 68.05 ± 3.05 b | |
| BC | 49.26 ± 3.66 a | 10.78 ± 0.55 b | 40.67 ± 0.52 a | 18.19 ± 1.62 b | 46.75 ± 1.33 a | 15.95 ± 0.63 b | |
| BS | 92.48 ± 0.60 a | 14.53 ± 0.26 b | 96.19 ± 0.12 a | 41.88 ± 4.26 b | 87.12 ± 0.33 a | 18.99 ± 0.14 b | |
| 10-30 cm | 2.0-0.05 [%] | 88 ± 1 | 88 ± 1 | 90 ± 2 | 92 ± 1 | 87 ± 2 | 88 ± 1 |
| 0.05-0.002 [%] | 7 ± 1 | 6 ± 1 | 5 ± 1 | 5 ± 1 | 9 ± 1 | 7 ± 1 | |
| <0.002 [%] | 5 ± 1 | 6 ± 1 | 5 ± 1 | 3 ± 1 | 4 ± 1 | 5 ± 1 | |
| pH1M KCl | 6.09 ± 0.05 a | 3.89 ± 0.03 b | 5.67 ± 0.03 a | 4.49 ± 0.01 b | 4.53 ± 0.04 a | 3.69 ± 0.02 b | |
| Hh | 1.97 ± 0.05 a | 36.00 ± 1.40 b | 1.56 ± 0.08 a | 16.02 ± 1.72 b | 6.61 ± 0.34 a | 36.77 ± 0.85 b | |
| BC | 43.79 ± 0.14 a | 11.04 ± 0.53 b | 45.88 ± 0.69 a | 11.72 ± 0.31 b | 51.48 ± 1.51 a | 17.24 ± 1.03 b | |
| BS | 93.52 ± 0.08 a | 23.46 ± 0.73 b | 96.71 ± 0.20 a | 42.38 ± 2.38 b | 88.63 ± 0.45 a | 31.91 ± 1.51 b | |
Species composition at each site was assessed by the use of randomly scattered squares (20 × 20 m), separated by a distance of several meters. In each studied forest stand and grassland, seven squares were designated. In addition, two soil pits were made on each square in order to collect soil samples for analyses. Fourteen soil pits were made in each forest stand (F1-F3) and on each meadow (G1-G3), totaling 84 soil pits. Soil samples were taken from two layers: (i) 0-10 cm, and (ii) 10-30 cm, in both grassland and forest soils.
Methods
Soil texture was estimated by the densimetric-sieve method and classified according to WRB recommendations ([51]). pH was measured potentiometrically in 1M potassium chloride using a soil/solution ratio as 1:2.5 ([46]). Organic carbon (Corg) and total nitrogen (Ntot) were estimated with a CNS analyzer (LECO 2000®, LECO Corp., St. Joseph, MI, USA). The ratio of organic carbon to total nitrogen (C/N) was then calculated.
Soil organic matter (SOM) division in fractions of different density and solubility was performed according to the method by Duchaufour & Jacquin ([17]) and was preceded by the separation of SOM in two fractions: (i) a light fraction with density < 2 kg dm-3, defined as the residue (Re); and (ii) a dense fraction with density > 2 kg dm-3, using bromoform (2 kg dm-3) according to Monnier et al. ([36]). The dense fraction was subject to subsequent extractions (I extraction: mixture 0.1 mol dm-3 Na4P2O7 and 7.5% Na2SO4; II extraction: 0.1 mol dm-3 Na4P2O7; III extraction: NaOH) to isolate humic acid (H) and fulvic acid (F) on the basis of differences in their solubility. Humines (Hu) remained as non-extracted residues of the dense fraction. C content in all fractions was determined by the automatic CNS analyser (LECO 2000®). The ratio of humic acid carbon to fulvic acid carbon (H:F) was calculated. Humification degree (Hd%) was calculated as a ratio of the sum of: humic acid C, fulvic acid C, humines C and humic acid C, fulvic acid C, humines C, residue C expressed in %, as follows: ([12] - eqn. 1):
Composition of sorption complex was established through the determination of exchangeable basic cations (Ca2+, Mg2+, Na+ and K+) in the 1 mol dm-3 NH4OAc ([46]) and total acidity (Hh) was determined using 1 M Ca(CH3COO)2 at pH 8.2 ([40]). Contents of determined basic cations were summed up and presented as a total content of basic cations (BC). Cation exchange capacity (CEC = BC + Hh) and base saturation (BS = BC / CEC · 100%) were also calculated ([12]).
Available phosphorus (Pav) and potassium (Kav) were extracted using 0.03 M CH3COOH buffered solution according to Egner and Riehm’s method, while available magnesium (Mgav) was extracted using 0.02 M CaCl2 solution following the Schatschabel’s method ([22]). Contents of both exchangeable (Ca2+, Mg2+, Na+, K+) and available (Pav, Kav, Mgav) cations in obtained solutions were determined with inductively coupled plasma atomic emission spectrometry (ICP-OES JY 238 ULTRACE®, Horiba, Edison, NJ, USA).
Dehydrogenase activity (DHA) was determined following the method of Casida et al. ([11]). The soil samples were amended with 2.3.5-triphenyltetrazolium chloride (TTC) and incubated for 24 h at 37 °C. TTC was reduced to triphenyl formazan (TPF) which was extracted from the reaction mixture with methanol and assayed colorimetrically with Beckman DU600® spectrophotometer (Beckman Coulter Inc., Brea, CA, USA) at a wavelength of 450 nm ([11]).
Statistical analysis
Means and standard deviations were computed to present general characteristics of the soil properties. Analysis of variance was applied to determine the significance of differences between mean values of soil parameters. Prior to the variance analysis, normal distribution of variables was tested using the Shapiro-Wilk test, and homogeneity of variance using the Levene’s test.
Due to departures from normal distribution, non-parametric Kruskal-Wallis test was conducted for all studied variables. The relationship between physico-chemical and biological properties of soils as well as the impact of afforestation on properties of grassland soils was assessed using the Spearman’s correlation rank analysis for both linear and non-linear dependencies. Principal component analysis (PCA) was performed to indicate the main soil parameters which affect the principal components.
The soil quality index (SQI) value was calculated in order to integrate physico-chemical and biological parameters into a single numerical value. According to Bastida et al. ([6]) it is advisable to evaluate the soil quality by combining different soil parameters. Only the variables with high load factor on the main PC components were taken into consideration for SQI calculation. High load factor was defined as an absolute value within 10% of the highest value of the load factor ([5]). With the use of PCA, the soil quality index was determined in order to compare the soils of different forest stands and meadows. SQI was calculated according to Sinha et al. ([42]) as follows (eqn. 2):
where W is the weighting factor of soil properties selected from the results of the PCA analysis within a given PC component, and S refers to their respective scores.
To convert real values of individual soil properties into a score (S), an equation defined as the sigmoid curve (which has an asymptote to 1 and to 0) was applied (eqn. 3):
where x is the value of the soil property, a reflects the maximum value (a = 1.00), x0 is the mean value of each soil parameter, and b is the equation slope.
A slope in the curve of -2.5 means “more is the better” whereas a slope of +2.5 denotes “less is the better”. In this way, we obtained a sigmoid curve at 1 for all suggested properties. According to many authors ([3], [6], [16]) synthetic indices of soil quality are useful tools that can be used to monitor changes in soil quality and to establish a reference point for different soil management practices. Higher values of soil quality indices mean higher soil quality ([37], [31], [42]).
Statistical analyses were conducted using the software STATISTICA® ver. 12.0 (StatSoft Inc., Tulsa, OK, USA). Graphs were produced using the package MS Excel® (Microsoft Inc., Redmond, WA, USA).
Results
Physical, physico-chemical and biological properties of soils
All examined soils were classified as sandy soils ([51]). The content of the sand fraction (2-0.05 mm) was greater than 85% (Tab. 2).
A higher content of Corg and Ntot was observed in the topsoil of forest stands compared to grassland soils, while in subsoils an inverse relationship was observed. The mean contents of these elements in the 0-10 cm layer were 30.61 g Corg kg-1 and 2.32 g Ntot kg-1 in soils F1-F3, and 18.67 g Corg kg-1 and 1.75 g Ntot kg-1 in soils G1-G3 (Tab. 3). In subsoils, the values were 12.3 g Corg kg-1 and 1.22 g Ntot kg-1 in soils of forest stands and 13.82 g Corg kg-1 and 1.40 g Ntot kg-1 in grassland soils (Tab. 3). The highest increase in Corg content, nearly 150%, was noticed in F1 soils, which may be due to the large share of Pinus sylvestris in the forest stand. In soils of the remaining forest stands, F2 and F3, these changes amounted to 30% (Fig. 3). In the subsoil, a reduction of approximately 11%, 40% and 10% occurred in the content of this element in soils F1, F2 and F3, respectively, as compared to soils G1, G2 and G3 (Fig. 4). It should be noted that changes equal or smaller than 11% were statistically non-significant (Tab. 3). The ratio C/N in F1-F3 soils in the individual layers was in the range of 10.59-15.39 in top layers and 4.87-11.72 in the 10-30 cm layers, while in the grassland soils it was in the range 9.95-10.99 and 5.44-12.03, respectively.
Tab. 3 - Physico-chemical and biological properties (mean ± standard deviation) in layers 0-10 cm and 10-30 cm of differently used soils. Different letters indicate significant (p<0.05) differences between mean values. (H:F): ratio of humic acid carbon to fulvic acid carbon; (Hd): degree of humification [%]; (Corg): organic carbon [g kg-1]; (Ntot): total nitrogen [g kg-1]; (C/N): ratio of organic carbon to total nitrogen; (DHA): dehydrogenase activity [cm3 H2 kg-1 d-1]; (Pav): available P [mg kg-1]; (Kav): available K [mg kg-1]; (Mgav): available Mg [mg kg-1].
| Layer | Property | Borek Falecki (area 1) | Skalki Twardowskiego (area 2) | Skotniki (area 3) | |||
|---|---|---|---|---|---|---|---|
| Grassland G1 | Forest F1 | Grassland G2 | Forest F2 | Grassland G3 | Forest F3 | ||
| 0-10 cm | H:F | 0.71 ± 0.06 a | 0.48 ± 0.02 b | 2.05 ± 0.18 a | 0.50 ± 0.05 b | 1.27 ± 0.10 a | 0.65 ± 0.04 b |
| Hd | 42.01 ± 3.40 a | 27.95 ± 0.95 b | 55.98 ± 0.92 a | 28.18 ± 2.68 b | 43.85 ± 3.35 a | 39.84 ± 1.33 a | |
| Corg | 18.71 ± 2.55 a | 44.00 ± 0.90 b | 11.01 ± 2.44 a | 13.92 ± 3.58 b | 26.29 ± 3.34 a | 33.95 ± 0.97 b | |
| Ntot | 1.77 ± 0.11 a | 2.86 ± 0.10 b | 1.10 ± 0.09 a | 1.33 ± 0.29 a | 2.39 ± 0.09 a | 2.78 ± 0.12 b | |
| C/N | 10.65 ± 1.81 a | 15.39 ± 0.38 b | 9.95 ± 1.80 a | 10.59 ± 2.07 a | 10.99 ± 1.08 a | 12.21 ± 0.31 a | |
| DHA | 0.97 ± 0.11 a | 0.83 ± 0.08 b | 1.84 ± 0.06 a | 0.69 ± 0.07 b | 2.25 ± 0.21 a | 0.91 ± 0.06 b | |
| Pav | 2.77 ± 0.13 a | 4.98 ± 0.33 b | 43.49 ± 1.91 a | 50.87 ± 3.35 b | 3.97 ± 0.17 a | 2.70 ± 0.12 b | |
| Kav | 6.44 ± 0.25 a | 3.15 ± 0.10 b | 2.38 ± 0.09 a | 3.45 ± 0.15 b | 3.09 ± 0.09 a | 4.01 ± 0.12 b | |
| Mgav | 28.10 ± 0.61 a | 25.78 ± 1.18 b | 33.23 ± 0.87 a | 14.19 ± 0.38 b | 13.64 ± 0.58 a | 1.10 ± 0.09 b | |
| 10-30 cm | H:F | 0.89 ± 0.05 a | 0.66 ± 0.03 b | 2.17 ± 0.15 a | 0.53 ± 0.04 b | 1.35 ± 0.07 a | 0.69 ± 0.04 b |
| Hd | 52.70 ± 2.80 a | 38.33 ± 2.60 b | 64.58 ± 1.72 a | 47.30 ± 0.78 b | 49.69 ± 3.50 a | 44.27 ± 3.34 b | |
| Corg | 16.78 ± 1.02 a | 15.33 ± 2.10 a | 4.95 ± 0.47 a | 2.99 ± 0.89 b | 19.73 ± 4.27 a | 18.58 ± 0.81 a | |
| Ntot | 1.50 ± 0.02 a | 1.31 ± 0.19 a | 0.92 ± 0.14 a | 0.63 ± 0.20 b | 1.80 ± 0.46 a | 1.73 ± 0.04 a | |
| C/N | 12.03 ± 0.92 a | 11.72 ± 0.55 a | 5.44 ± 0.64 a | 4.87 ± 1.06 a | 11.14 ± 2.07 a | 10.78 ± 0.60 a | |
| DHA | 0.48 ± 0.03 a | 0.34 ± 0.06 b | 0.35 ± 0.11 a | 0.23 ± 0.03 a | 0.65 ± 0.09 a | 0.41 ± 0.07 b | |
| Pav | 3.04 ± 0.12 a | 3.85 ± 0.12 b | 40.72 ± 12.2 a | 47.19 ± 2.34 a | 6.66 ± 0.30 a | 2.57 ± 0.05 b | |
| Kav | 4.14 ± 0.10 a | 3.24 ± 0.14 b | 2.10 ± 0.05 a | 1.72 ± 0.08 b | 2.18 ± 0.03 a | 2.10 ± 0.28 a | |
| Mgav | 24.60 ± 0.64 a | 19.54 ± 0.58 b | 14.75 ± 0.42 a | 1.26 ± 0.17 b | 11.05 ± 0.54 a | 0.93 ± 0.07 b | |
Fig. 3 - Differences in grassland soils properties after afforestation in the 0-10 cm layer expressed in %.
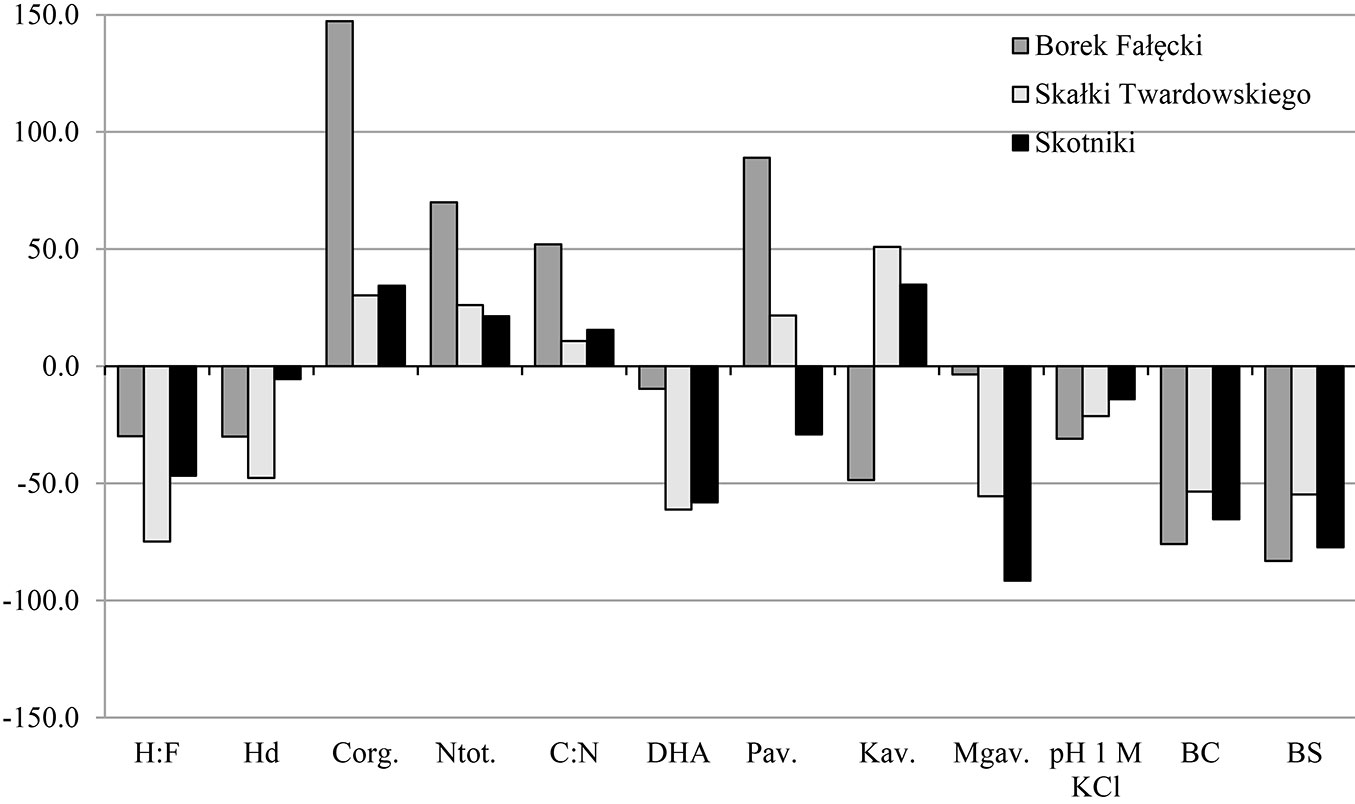
Fig. 4 - Differences in grassland soils properties after afforestation in the 10-30 cm layer expressed in % .
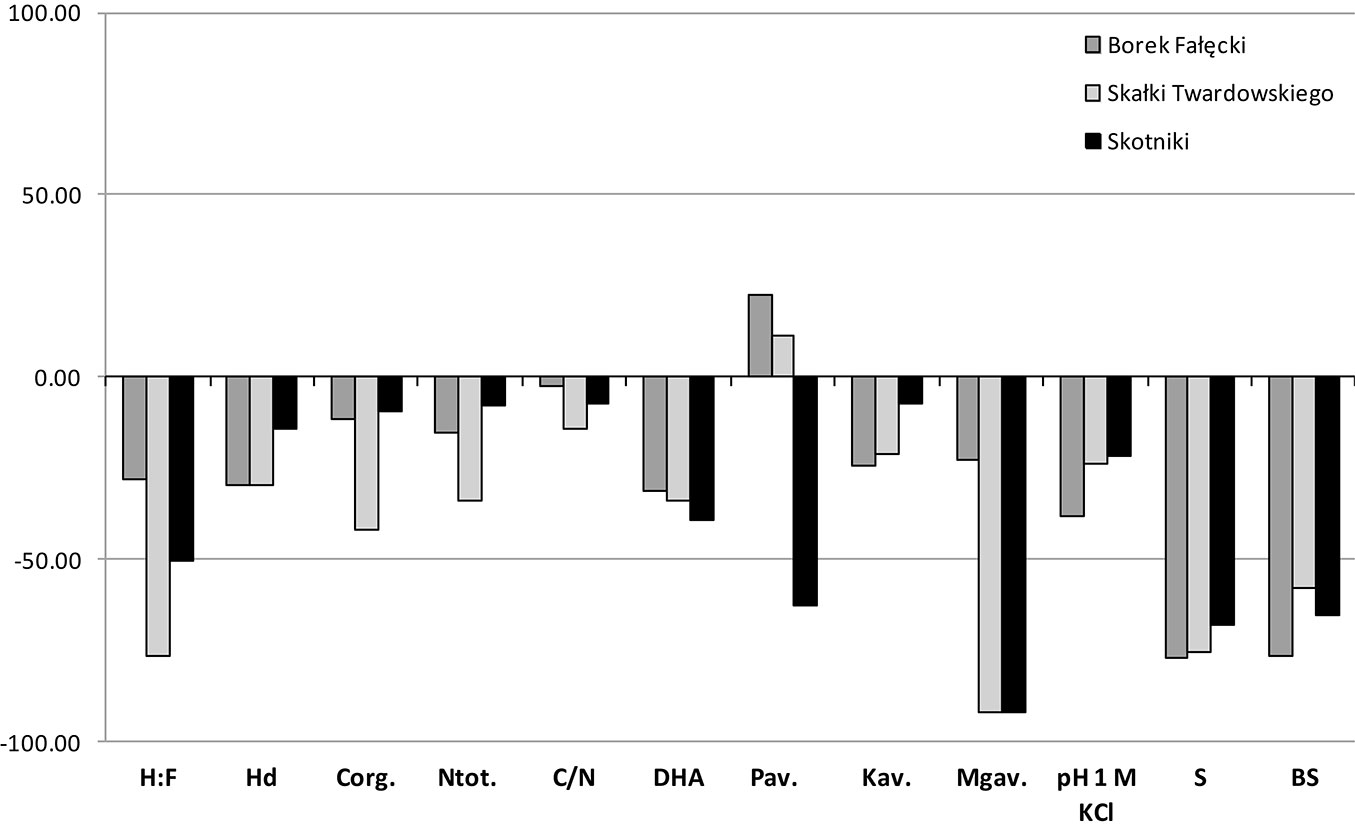
The composition of soil organic matter (SOM) was described by two parameters: the ratio of humic acids carbon to fulvic acids carbon (H:F) and the degree of humification (Hd). Higher values of both parameters were observed in both designated layers in grassland soils, compared to forest soils in each of the three stands. In grassland soils mean H:F was 1.34 and 1.47 in 0-10 cm and 10-30 cm layers, respectively, while in forest soils H:F was 0.54 and 0.63 in 0-10 cm and 10-30 cm layers, respectively. Hd in top layers of grassland and forest soils was 47.3% and 32.0%, respectively, while in 10-30 cm layers Hd amounted to 55.7% and 43.3% (Tab. 3). In both layers, H:F changes in the compared soils were similar (Fig. 3 and Fig. 4). The lowest changes in Hd occurred in F3 as compared to G3 (about 10%), as shown in Fig. 3 and Fig. 4.
The mean values of pH1M-KCl were always higher in grassland soils (G1-G3) compared to forest soils (F1-F3) and these values slightly increased with depth (less than 0.5 units). The direction of change in pH in the compared grassland and forest soils was the same in both layers, which means that pH decreases in forest soils compared to grassland soils. The biggest changes were observed in soils of F1 (approximately 30% in both layers), while in the soils of F2 and F3, the changes amounted to about 20% (Fig. 3 and Fig. 4). The strongest acidification in relation to reference grassland soils was recorded in F1 soils, where coniferous trees grow, whereas the smallest acidification was noted in F3 soils (deciduous trees). Mean total acidity (Hh) values for F1 were 18 and 17 times higher in the 0-10 cm and 10-30 cm layers, respectively. Similarly, for F2, the values were 15 and 9 times higher, and for F3 the values where 9 and 4 times higher, in the in 0-10 cm and 10-30 cm layers, respectively. Such large changes in mean Hh values indicate that the trees introduced during the process of afforestation of grassland soils triggered an intensive process of acidification, and that this process was less advanced in subsoils. Acidification can be seen in the sorption complex, which is manifested by the leaching of alkaline components and reduction by approximately 55-80% in BS of forest soils in relation to grassland soils (Fig. 3 and Fig. 4).
A significant variability in the content of available Pav, Kav and Mgav contents, both between the designated layers and soils under different uses, as well as between different areas, were found. The highest mean contents of Pav, over 40 mg kg-1 in both studied layers, were observed in G2 and F2. In the studied layers of the remaining soils the mean content of this element did not exceed 7 mg kg-1. The high accumulation of available phosphorus in differently used soils of G2 and F2 may be the result of being “washed in” from adjacent horsts of carbonate rocks, which are rich in P2O5. In forest soils (F1 and F2) there were higher mean contents of available P than in reference grassland soils (G1 and G2), while in G3 soil the content of Pav was higher than in F3 soil. In the soils of the examined areas, the mean contents of Kav and Mgav were usually higher in grassland soils than in the corresponding forest soils (Tab. 3).
Mean values of the activity of dehydrogenase (DHA) were lower in forest soils than in grassland soils. In F1-F3 soils, in the topsoil and subsoil, values ranged between 0.69 and 0.91, and between 0.23 and 0.41 cm3 H2 kg-1 d-1 respectively; in G1-G3 soils, DHA activity in analogous layers ranged from 0.97 to 2.25 and from 0.35 to 0.65 cm3 H2 kg-1 d-1 (Tab. 3).
Soil quality index (SQI)
Tab. 4 reports the eigenvalues obtained from PCA in descending order, thus representing the importance of relevant factors in explaining the total variability of the data. The analysis showed that the first factor (PC1), which corresponded to the highest eigenvalue of 8.3, accounted for about 41.6% of the total variation, whereas the other values, PC2, PC3 and PC4, which corresponded respectively to eigenvalues 5.12, 2.03 and 1.68, accounted for 25.6%, 10.1% and 8.4% of the total variation. Four factors exceeded the eigenvalue 1, accounting for approximately 85.7% of the total variation, and therefore, these were selected for the analysis. Among the variables which were highly correlated (r > 0.7), the variable with the highest correlation factor was chosen for the SQI calculation. Finally, PCA was used to select the following variables: Hh, Hd, Corg, Mg2+, Pav, Kav, Mgav and DHA, which were taken into consideration during the synthetic evaluation of the quality of examined soils.
Tab. 4 - Results of principal component analysis of soil parameters (n = 168). SQI = 0.415Hd + 0.415Corg + 0.415Hh + 0.255Mg2+ + 0.255Pav + 0.101Kav + 0.083DHA + 0.083Mgav. Normalized SQI = SQI/2.022. Final SQI = 0.205Hd + 0.205Corg + 0.205Hh + 0.126Mg2+ + 0.126Pav + 0.05Kav + 0.041DHA + 0.041 Mgav. For grassland soil “more is better” thus -2.5 for Hd, Corg, Pav, Mg2+, Kav, Mgav, DHA and “less is better” thus +2.5 for Hh and for forest soil Hh also included “more is better” thus -2.5.
| Principal components | PC1 | PC2 | PC3 | PC4 |
|---|---|---|---|---|
| Variation (%) | 41.59 | 25.59 | 10.13 | 8.38 |
| Cumulative variation (%) | 41.59 | 67.18 | 77.31 | 85.70 |
| H:F | 0.703 | -0.171 | 0.565 | 0.010 |
| Hd | 0.797 a | -0.053 | 0.270 | 0.389 |
| Corg | -0.779 a | -0.535 | 0.171 | -0.119 |
| Ntot | -0.703 | -0.575 | 0.246 | -0.019 |
| C/N | -0.636 | -0.515 | -0.036 | -0.249 |
| DHA | 0.072 | -0.442 | 0.513 | -0.564 a |
| pH1M KCl | 0.866 | -0.317 | -0.245 | -0.029 |
| Hh | -0.944 a | 0.139 | 0.009 | 0.114 |
| Ca2+ | 0.750 | -0.535 | 0.323 | 0.028 |
| Mg2+ | 0.296 | -0.642 a | -0.508 | -0.108 |
| K+ | 0.016 | -0.617 | -0.380 | 0.487 |
| Na+ | 0.015 | -0.651 | 0.103 | 0.487 |
| BC | 0.736 | -0.593 | 0.219 | 0.023 |
| BS | 0.882 | -0.393 | 0.113 | -0.069 |
| Pav | 0.450 | 0.693 a | 0.079 | -0.331 |
| Kav | -0.100 | -0.604 | -0.654 a | -0.199 |
| Mgav | 0.306 | -0.452 | -0.192 | -0.644 a |
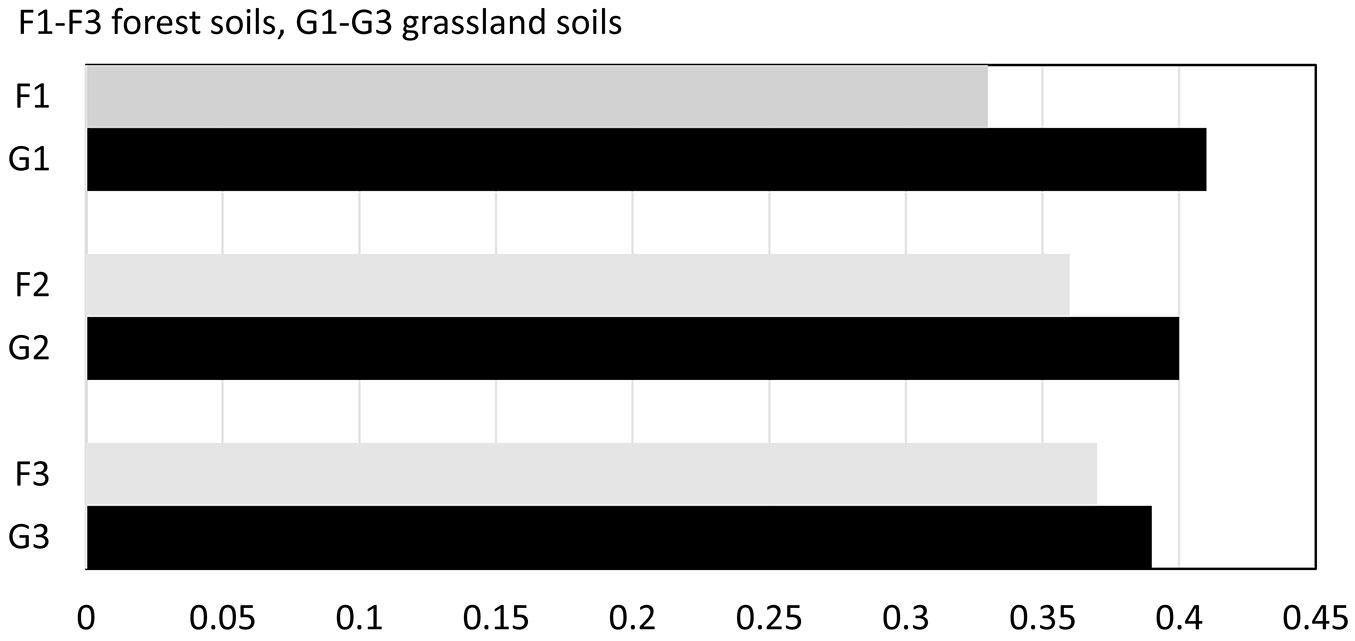
When comparing values of SQI of differently used soils, lower values were found in forest stand soils compared to grassland soils in all the studied stands. The values of SQI were as follows: G1 0.41 and F1 0.33; G2 0.40 and F2 0.36;G3 0.39 and F3 0.37 (Fig. 5). The differences were 24%, 11% and 4%, respectively. Between soils of different forest stands, the differences in SQI did not exceed 10%.
Fig. 5 - Soil quality index values (SQI) of grassland and forest soils.
Discussion
The impact of afforestation on the physico-chemical and biological properties of grassland soils
We ascertained that the highest carbon accumulation occurs in forest stands composed of deciduous tree species with an admixture of coniferous species. This observation was explained by Andivia et al. ([4]) by a complementarity between these tree species. Coniferous trees provide the soils with organic carbon mainly by root turnover, while deciduous trees by the fall of leaves. Conifers usually have shallow rooting systems and therefore they accumulate more organic carbon in top soil layers than deciduous trees, which have a deeper rooting system ([43], [50]). Moreover, the accumulation of Corg increases with the age of the forest and the dynamics of this modification decreases with the depth of soil, as observed by Farley & Kelly ([18]), Smal & Olszewska ([45]) and Orczewska et al. ([39]). The changes in Ntot content, observed in both designated layers, were similar to the changes in Corg. Contrary to our expectations, we did not detect any increase in nitrogen accumulation in stands dominated by alder. These results are consistent with findings of Miletić et al. ([34]), who also did not find any increase in N content in stands with alder. According to their study, species growing in the vicinity of alder use the nitrogen accumulated by this species.
Organic matter (in the form of fallen leaves, twigs, etc.) in the differently used soils (grassland G1-G3, and forest F1-F3) is decomposed at different rates in the studied layers. It can be deduced from the C/N ratio (Tab. 3) that mineralization and humification processes of organic matter, are faster in topsoils of grasslands than in the corresponding layers of forest soils, which is consistent with previous studies ([41], [23], [21], [24]). This relationship is expressed by a high negative correlation coefficient between C/N and Hd (r = -0.56, p < 0.01 - Tab. 5).
Tab. 5 - Coefficients of Spearman’s rank correlation between soil parameters in forest soils. (*): p<0.05; (**): p<0.01; (***): p<0.001.
| - | H:F | Hd | Corg | Ntot | C/N | DHA | pH | Hh | Mg2+ | Ca2+ | K+ | Na+ | BC | BS | Pav | Kav | Mgav |
|---|---|---|---|---|---|---|---|---|---|---|---|---|---|---|---|---|---|
| H:F | 1.00 | - | - | - | - | - | - | - | - | - | - | - | - | - | - | - | - |
| Hd | 0.79*** | 1.00 | - | - | - | - | - | - | - | - | - | - | - | - | - | - | - |
| Corg | -0.37* | -0.57** | 1.00 | - | - | - | - | - | - | - | - | - | - | - | - | - | - |
| Ntot | -0.30* | -0.48* | 0.95*** | 1.00 | - | - | - | - | - | - | - | - | - | - | - | - | - |
| C/N | -0.35* | -0.56** | 0.80*** | 0.63** | 1.00 | - | - | - | - | - | - | - | - | - | - | - | - |
| DHA | 0.35* | 0.01* | 0.29* | 0.37* | 0.19* | 1.00 | - | - | - | - | - | - | - | - | - | - | - |
| pH | 0.55** | 0.69** | -0.49 | -0.46* | 0.37* | 0.05* | 1.00 | - | - | - | - | - | - | - | - | - | - |
| Hh | -0.59** | -0.66** | 0.67** | 0.60** | 0.48* | -0.20* | -0.82*** | 1.00 | - | - | - | - | - | - | - | - | - |
| Mg2+ | 0.01* | 0.06* | 0.01* | 0.07* | 0.12* | 0.15* | 0.50* | -0.39* | 1.00 | - | - | - | - | - | - | - | - |
| Ca2+ | 0.74** | 0.66** | -0.24* | -0.12* | -0.22* | 0.41* | 0.72** | -0.80*** | 0.42* | 1.00 | - | - | - | - | - | - | - |
| K+ | -0.01* | 0.21* | 0.24* | 0.28* | 0.17* | -0.17* | 0.38* | 0.05* | 0.46* | 0.17* | 1.00 | - | - | - | - | - | - |
| Na+ | 0.13* | 0.20* | 0.28* | 0.38* | 0.32* | 0.12* | 0.12* | -0.12* | 0.37* | 0.47* | 0.50* | 1.00 | - | - | - | - | - |
| BC | 0.69** | 0.62** | -0.22* | -0.09* | -0.19* | 0.40* | 0.74** | -0.79*** | 0.54* | 0.99*** | 0.25* | 0.50** | 1.00 | - | - | - | - |
| BS | 0.71** | 0.70** | -0.42* | -0.32* | -0.33* | 0.35* | 0.87*** | -0.91*** | 0.50* | 0.95*** | 0.19* | 0.31* | 0.95*** | 1.00 | - | - | - |
| Pav | 0.31* | 0.21* | -0.64** | -0.65** | -0.63** | -0.08* | 0.20* | -0.30* | -0.29 | -0.01* | -0.51** | -0.77*** | -0.06* | 0.13* | 1.00 | - | - |
| Kav | -0.34* | -0.30* | 0.31* | 0.32* | 0.37* | 0.14* | 0.26* | 0.01* | 0.74** | 0.05* | 0.53** | 0.30* | 0.16* | 0.12* | -0.42* | 1.00 | - |
| Mgav | 0.30* | 0.05* | 0.07* | -0.04* | 0.30* | 0.35* | -0.54** | -0.36* | 0.42* | 0.33* | 0.12* | -0.01* | 0.37* | 0.44* | -0.01* | 0.42* | 1.00 |
In shaping the quantity and properties of SOM, a fundamental role is played by the properties of litter as a substrate of the humification process, as well as by habitat conditions (climate, physico-chemical soil properties) in which the decomposition takes place ([21], [34], [27], [32]). Based on our results, a lower humification rate of SOM and a lower H:F value were ascertained in afforested soils compared with grassland soils (Tab. 3). This indicates that the changes in SOM lead to forest humus formation which is characterised by lower Hd and narrower H:F than in grassland soils. These results are consistent with those obtained by Smal et al. ([44]), Gonet et al. ([21]) as well as Jonczak ([27]), whose research confirms the significant impact of the land use (grassland or forest) on the properties of organic matter.
An important factor contributing to the impoverishment of cations in forest soils is the higher biomass production compared to grassland soils. A large proportion of the cations needed for biomass production are fixed in the wood and bark of trunks, as well as roots, branches and leaves. Those cations return to the soils after a much longer cycle compared to grassland soils ([26]). The acidic products of humus decomposition initiate subsequent processes of change, of which the acidification and leaching of cations is the most important. The natural process of soil acidification is inherently connected with the decomposition of organic matter and the absorption of nutrients. These processes are particularly intensive in forest soils ([49]). Relationships between these parameters are expressed by a positive correlation coefficient between pH and H:F (r = 0.55, p < 0.01), as well as between pH and BS (r = 0.71, p < 0.01 - Tab. 5).
DHA was lower in forest stand soils than in grassland soils, and this was probably the result of forest soil acidification. The optimal values of pH for DHA, ranges from 6.3-7.2, while the mean pH value in the studied forest soils was 3.9. According to Blonska & Januszek ([7], [8], [9]), soil reaction among the properties which most influences DHA activity.
Changes in the mean content of the available studied elements varied considerably between differently used soils for all the examined sites. In general, the content of Kav and Pav increased in topsoils of forests, in comparison to corresponding grassland soils. However, the observed changes were not always statistically significant (Tab. 3). Similar relationships, or the lack of a clear enrichment in Pav as the forest age increases, are reported by Orczewska et al. ([39]), who evaluated the content of this element in soils covered by Alnus glutinosa. According to Alban ([1]), the content of available forms of P and K in soils of forest habitats depends on the dominance of a particular tree species. He observed higher contents of these components in soils covered with deciduous trees (poplar) than in soils under coniferous species (pine).
Evaluation of soil quality (SQI)
In this study we assumed that the differences in properties and SQI values between grassland and afforested soils resulted mainly from the influence of different tree species, modified by the time passed since afforestation.
A slightly higher SQI observed in F3, as compared to the remaining forest soils, may have resulted from the dominance of the black alder (80%) in the species composition. The period of influence of the introduced forest on soils of this area was the shortest (45 years), which suggests that over time, the quality of these forest soils can even improve. SQI in F2 was slightly lower than in F3, probably because of the smaller share of the black alder in this stand. In F2 and F1 stands the share of the black alder was the same (25%) but SQI was higher in F2 possibly due to the fact that in this stand a more appropriate species composition was present, given the high levels of ground water.
Conclusions
Afforestation of grassland soils resulted in an increase in Corg and Ntot contents but only in the top layers (0-10 cm). It was estimated that there was also a decrease in pH which is typical for forest soils. Acidification processes were accompanied by changes in SOM quality, such as lower decomposition rates and lower H:F values, as well as a lowering of basic cation levels and DHA activity. SQI indicated that the best species for the afforestation of sandy, humid grassland soils is black alder. With the same share of black alder, higher SQI was calculated for the stand with maples and elm than for the stand with pine, birch and oak. These results may have practical application in further afforestation strategies for humid grassland soils.
References
Gscholar
Gscholar
Gscholar
Gscholar
Gscholar
Gscholar
Gscholar
Gscholar
Gscholar
Gscholar
Gscholar
Gscholar
Gscholar
Gscholar
Gscholar
Gscholar
Authors’ Info
Authors’ Affiliation
Local Park and Zoological Garden - Fundation ul. Kasy Oszczednosci Miasta Krakowa 14, 30-232 Kraków (Poland)
Soil Science and Soil Protection Department, Institute of Soil Science and Agrophysics, University of Agriculture in Krakow, Aleja Mickiewicza 21, 31-120 Krakow (Poland)
Corresponding author
Paper Info
Citation
Podwika M, Solek-Podwika K, Ciarkowska K (2018). Changes in the properties of grassland soils as a result of afforestation. iForest 11: 600-608. - doi: 10.3832/ifor2556-011
Academic Editor
Gianfranco Minotta
Paper history
Received: Jul 18, 2017
Accepted: Jun 28, 2018
First online: Sep 25, 2018
Publication Date: Oct 31, 2018
Publication Time: 2.97 months
Copyright Information
© SISEF - The Italian Society of Silviculture and Forest Ecology 2018
Open Access
This article is distributed under the terms of the Creative Commons Attribution-Non Commercial 4.0 International (https://creativecommons.org/licenses/by-nc/4.0/), which permits unrestricted use, distribution, and reproduction in any medium, provided you give appropriate credit to the original author(s) and the source, provide a link to the Creative Commons license, and indicate if changes were made.

Web Metrics
Breakdown by View Type
Article Usage
Total Article Views: 50414
(from publication date up to now)
Breakdown by View Type
HTML Page Views: 41412
Abstract Page Views: 4297
PDF Downloads: 3722
Citation/Reference Downloads: 6
XML Downloads: 977
Web Metrics
Days since publication: 2849
Overall contacts: 50414
Avg. contacts per week: 123.87
Article Citations
Article citations are based on data periodically collected from the Clarivate Web of Science web site
(last update: Mar 2025)
Total number of cites (since 2018): 11
Average cites per year: 1.38
Publication Metrics
by Dimensions ©
Articles citing this article
List of the papers citing this article based on CrossRef Cited-by.
Related Contents
iForest Similar Articles
Research Articles
Soil fauna communities and microbial activities response to litter and soil properties under degraded and restored forests of Hyrcania
vol. 14, pp. 490-498 (online: 11 November 2021)
Research Articles
Impact of deforestation on the soil physical and chemical attributes, and humic fraction of organic matter in dry environments in Brazil
vol. 15, pp. 465-475 (online: 18 November 2022)
Research Articles
Influences of forest gaps on soil physico-chemical and biological properties in an oriental beech (Fagus orientalis L.) stand of Hyrcanian forest, north of Iran
vol. 13, pp. 124-129 (online: 07 April 2020)
Research Articles
Wood-soil interactions in soil bioengineering slope stabilization works
vol. 2, pp. 187-191 (online: 15 October 2009)
Short Communications
Variation in soil carbon stock and nutrient content in sand dunes after afforestation by Prosopis juliflora in the Khuzestan province (Iran)
vol. 10, pp. 585-589 (online: 08 May 2017)
Research Articles
Effects of tree species, stand age and land-use change on soil carbon and nitrogen stock rates in northwestern Turkey
vol. 9, pp. 165-170 (online: 18 June 2015)
Research Articles
Comparison of soil CO2 emissions between short-rotation coppice poplar stands and arable lands
vol. 11, pp. 199-205 (online: 01 March 2018)
Research Articles
Spatial heterogeneity of soil respiration in a seasonal rainforest with complex terrain
vol. 6, pp. 65-72 (online: 07 February 2013)
Research Articles
Effect of size and surrounding forest vegetation on chemical properties of soil in forest gaps
vol. 8, pp. 67-72 (online: 04 June 2014)
Review Papers
Soil fungal communities across land use types
vol. 13, pp. 548-558 (online: 23 November 2020)
iForest Database Search
Search By Author
Search By Keyword
Google Scholar Search
Citing Articles
Search By Author
Search By Keywords
PubMed Search
Search By Author
Search By Keyword


