
Quantifying forest net primary production: combining eddy flux, inventory and metabolic theory
iForest - Biogeosciences and Forestry, Volume 10, Issue 2, Pages 475-482 (2017)
doi: https://doi.org/10.3832/ifor2159-010
Published: Apr 12, 2017 - Copyright © 2017 SISEF
Research Articles
Abstract
Net primary production (NPP) is a central and fundamental carbon-related term in global change studies. We proposed a top-down method to quantifying forest NPP which overcomes the deficits of the traditional bottom-up method. The new top-down method combines eddy flux data, climate variables, tree inventory and metabolic theory. Our method was tested in six forests and provides reliable annual NPP estimations which are consistent with bottom-up results. Carbon use efficiency also supports this new method. Taking advantage of fine temporal resolution of our top-down method, we examined whether and confirmed NPP was well correlated with leaf area index at a seasonal scale, as suggested by past studies. The potential value of our new method as a standard NPP method is high because of the world-wide network on eddy tower and inventory plot, however further data of performance of the new method is needed to fully evaluate its performance under different conditions.
Keywords
Carbon Use Efficiency, Metabolic Theory of Ecology, Autotrophic Respiration, Biomass, Eddy Covariance
Introduction
The earth’s surface environment changed dramatically between 1960s and 2010s, including changes in atmospheric gas concentrations, temperatures, and land-cover. Notably, the surface temperature increased by 0.9 °C and the atmospheric CO2 levels increased by 23% (from 316 to 389 part per million - [3]). The surface warming was most likely caused by radiative forcing resulting from atmospheric CO2 buildup. Consequently, understanding the carbon balance of ecosystems is a critical component in global change studies.
Net primary production (NPP) is a central carbon-related term which integrates climatic, ecological, geochemical and human influences on the biosphere ([35]). NPP is the rate of biomass change in plants, including woody, leaf and root tissues, but also root exudates and volatile organic carbon compounds.
NPP is defined as the difference between gross primary production (GPP) and total plant respiration (Ra) in an ecosystem ([41]). In the past, directly measuring both GPP and Ra were impractical due to methodological constraints, especially for tall forest GPP ([7]). Whole ecosystem Ra was not only difficult to estimate but also involved significant uncertainties ([26]). Due to methodological advances, it is now possible to obtain ecosystem GPP by using eddy-covariance techniques ([2]). Furthermore, a potential way for reliable Ra estimation has been developed based upon metabolic theory ([34]).
The traditional method to quantify NPP was developed during International Biosphere Program (IBP - [36]), which calculate NPP by combining the organic tissue biomass growth of all quantifiable components within a plant or an area. Currently NPP is normally calculated using the IBP-method with field-surveys ([8]).
Though widely-used, several intrinsic deficits exist in the IBP-method. First, not all NPP components can be directly measured in the field due to environmental variations during the measuring interval ([7]). Second, it is difficult to obtain a fine temporal resolution NPP (i.e., daily), and thus to explore the explicit links of NPP to environmental conditions. Third, the IBP-Method is labor intensive and therefore difficult to implement automatically. Methodological constraints not only limit field-data availability, but also hinder the accuracy of NPP estimation and prediction. Therefore, alternative new methods are urgently needed for forest NPP studies.
We propose a new method to quantify NPP, which more accurately quantifies its various components and explores how these components co-vary with climatic variation at a high temporal resolution. The new method was tested in six primary forests. To overcome major deficits of the traditional IBP-method, we directly address weaknesses within the IBP method and compare the results derived from both methods. Top-down design, high temporal resolution, and automatic monitoring represent a significant advance in forest NPP estimation, and could provide a way of comparing NPP of forests globally. It could also serve as an independent way to verify estimation derived from the current IBP-method.
Materials and methods
The new top-down method for NPP
The new method estimates NPP via top-down analysis (eqn. 1):
Fig. 1 - Flow schema of top-down estimation of forest net primary production (NPP). Eddy flux is carbon flux measured by eddy covariance technique; (Ta): temperature; (Q10): respiration temperature sensitivity index; (GPP): gross primary production; (R20): tree autotrophic respiration at 20°C; (Ra): autotrophic respiration; (MTE): metabolic theory of ecology here specified to Mori et al. ([34])’s work. Tree census (Inventory) data and site-specific allometric equations were used in calculating tree biomass individually.
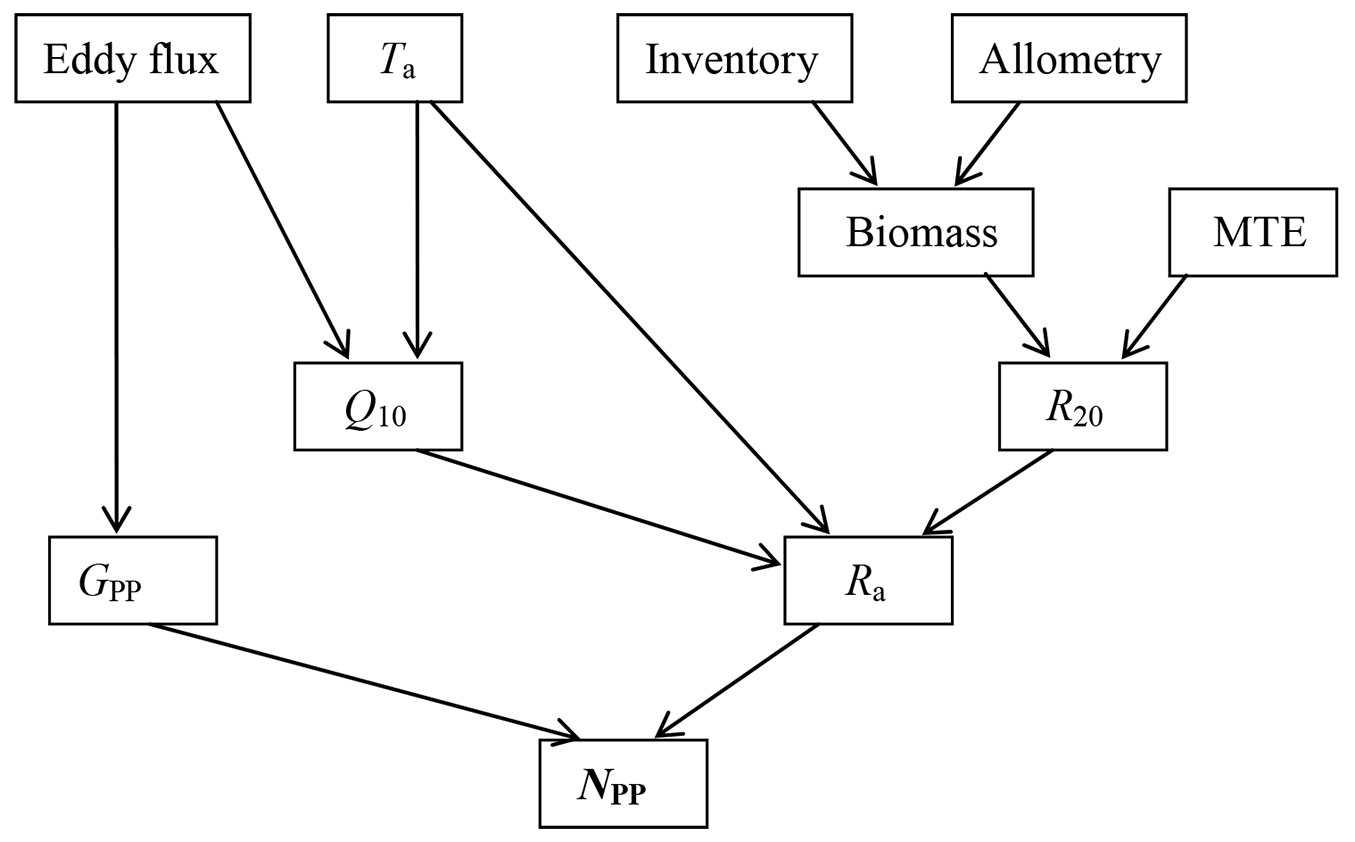
The general work flow is illustrated in Fig. 1. Most data required by this method are derived from eddy flux, air temperature, and tree size. Tree size is converted into biomass by using allometric equations. Ra of each tree at 20 °C (R20) was estimated according to the common tree biomass-respiration relationship reported by Mori et al. ([34] - eqn. 2):
where M is the biomass of a tree. The coefficients were estimated from 271 naturally growing trees in tropical, temperate and boreal forests, with a regression correlation coefficient of 0.99 ([34]). Ra was constructed from the Q10 model of Janssens & Pilegaard ([19] - eqn. 3):
where Rref is Ra at the reference temperature Tref, here specified to R20 at 20 °C. GPP is obtained by partitioning eddy flux after necessary data treatment.
Forests for testing
Six forests were used to test the new method.
Forest 1: A temperate forest in Changbaishan (CBS), northeastern China. The geographic location is 128° 28′ E, 42° 24′ N. The CBS forest is primary and over 250 years old with a canopy height of 26 meters. The annual mean temperature was 4 °C and the annual rainfall was 700 mm. The dominant tree species are Pinus koraiensis, Tilia amurensis, Acer mono, Fraxinus mandshurica, and Quercus mongolica. Inventory data were collected from a 20 ha plot very close to the eddy flux site ([16]).
Forest 2: A tropical seasonal forest in Xishuangbanna (BNS), Southwest China. The geographic location is 101° 15′ E, 21° 55′ N. The annual mean temperature and rainfall were 21.7 °C and 1490 mm respectively. The mean canopy height was 30 m. Trees in the topmost layer primarily include Pometia tomentosa, Terminalia myriocarpa, Gironniera subaequalis, and Garuga floribunda. Inventory data were collected from a 1 ha plot beneath the eddy flux tower ([50]).
Forest 3: A tropical seasonal deciduous forest in Mae Klong (MKL), Thailand. The geographic location is 108° 53′ E, 18° 43′ N. The annual mean temperature and rainfall were 25 °C and 1500 mm respectively. The mean canopy height was 30 m. The stand age was around 30 years in 2008. Domestic species in overstory are Shorea siamensis, Vitex peduncularis, Xylia xylocarpa. Inventory data were collected from a 4 ha plot ([31]).
Forest 4: A tropical lowland rainforest in Pasoh (PSO), Malaysia. The geographic location of the forest is 102° 18′ E, 02° 58′ N. The annual mean temperature and rainfall were 25.3 °C and 1865 mm respectively. The mean canopy height was 35 m. The studied forest is primary. Domestic species in overstory predominantly belong to Dipterocarpaceae, Leguminosae, Burseraceae. A total of 814 species existed in the 50 ha plot. Inventory data were collected from a 6 ha plot beneath the eddy flux tower ([18], [23]).
Forest 5: A tropical secondary forest in Bukit Soeharto (BKS), Indonesia. The geographic location is 117° 02′ E, 0° 51′ S. The annual mean temperature and rainfall were 27 °C and 3300 mm respectively. The studied forest is a secondary forest. In 1998, the secondary-growth forest disappeared due to a forest fire facilitated by El Niño Southern Oscillation (ENSO) event. The mean canopy height was 12.4 m in year 2004. We used eddy flux data in 2001 and 2002 and tree census data in 2003. Dominant species in overstory were Macaranga gigantea. Inventory data were collected from three 1 ha plots which were not logged ([40]).
Forest 6: A logged tropical rainforest in Tapajos (K83), Brazil. The geographic location is 54° 31′ E, 03° 01′ S. The annual mean temperature and rainfall were 25 °C and 1911 mm respectively. The mean canopy height was 35 m. The inventory plot is 16 ha in the east of an eddy flux tower ([32]).
The eddy flux based GPP
Eddy covariance based net ecosystem CO2 exchange (NEE) is estimated as ([33] - eqn. 4):
The overbar indicates averaging over time, primes represent fluctuations from the average, ρ is the molar density of dry air, w is vertical wind velocity, c is the mixing ratio of CO2 measured by infrared gas analyzer, dc/dt is the change in CO2 mixing ratio with time, and zr is the measurement height.
The NEE could be decomposed into GPP and ecosystem respiration (Re) as (eqn. 5):
The minus sign outside the parenthesis results from discipline convention. Total Re is the sum of nighttime and daytime Re, and conceptually nighttime NEE is equivalent to nighttime Re. However, nighttime NEE is usually underestimated during periods of low turbulence. The common way to correct this underestimation is the so-called u* filtering method. In this method, the threshold u* was determined by finding a saturation point in u* and nighttime NEE plot. All NEE observations were filtered by removing all values below the u* threshold prior to analysis.
Inventory, tree biomass, R20 and Ra estimation
Mori et al. ([34]) suggests a common tree biomass-respiration relationship. R20 was estimated from tree biomass obtained by Kato et al. ([21]) for BKS, MKL and PSO; by Chen & Guo ([5]) for CBS; by Chambers et al. ([4]) for K83; and by Lv et al. ([28]) for BNS.
A mixed-power scaling rather than the single-power scaling of eqn. 2 was recommended by Mori et al. ([34]). We compared R20 estimated with both scaling. On the other hand, we used the Q10 derived from flux tower Re, which includes the temperature sensitivity of both heterotrophic (Rh) and autotrophic respiration (Ra), to obtain Ra with eqn. 3. In some cases, the Q10 of Rh and Ra is different and this might lead to biased estimate for Ra. Furthermore, we cannot obtain Q10 value for an equatorial tropical rainforest where temperature range was very narrow. Under such circumstance, we used a fixed Q10 of 2 for the equatorial rainforest ([1], [42]). A sensitivity analysis was also used to investigate how Q10 affect Ra.
The IBP based NPP
The detail on estimating NPP with IBP method has been extensively discussed in an IBP book ([36]) and a review by Clark et al. ([7]). In general, IBP based NPP was estimated as the sum of biomass increment and biomass losses occurred during the investigation interval both above- and below-ground. We did not estimate IBP based NPP for each site but rather collected the published values.
Other supporting measurements and calculations
Remote sensing-derived leaf area index was generally used to estimate NPP at large scales ([13], [37]). We calculated leaf area index (LAI) to examine whether it could explain the seasonal variation of evergreen tropical forest NPP at daily resolution.
Following Jarvis & Leverenz ([20]), LAI was estimated as (eqn. 6):
where κ is extinction coefficient which varied between 0.4 and 0.65. We used 0.55. Qt is the transmitted photosynthetically active radiation (PAR), and was monitored by a sensor (LI-190SB®, LI-Cor, USA) placed at the height of 3.9m, and Qo is the PAR above the canopy measured by a sensor at the height of 36.2 m.
Results and discussion
The Ra derived from metabolic theory and its uncertainties
The application of Mori et al. ([34])’s finding in estimating forest Ra is the key issue of this new method. Mori et al. ([34]) claimed that a mixed-power function rather than a single-power function is better in describing the biomass-respiration relationship. The mixed-power function implying a gradual ontogenetic transition in the scaling of metabolism is theoretically sound. We compared R20 obtained with mixed-power function to that with single-power one (Tab. 1). The single-power based R20 is 13% higher that of mixed-power. In the statistic perspective, both single-power and mixed-power functions have a good ability at simulating R20 with correlation coefficient as high as 0.99 ([34]). The R20, however, is very sensitive to the choice of single- or mixed-power function.
Tab. 1 - Estimated biomass and reference respiration rate at 20 °C (R20). (MAT): mean annual temperature; (MAP): mean annual precipitation.
| Forest | MAT [°C] |
MAP [mm] |
Biomass [t dry matter ha-1] |
R20 [μmol m-2 s-1] | |
|---|---|---|---|---|---|
| Single power | Mixed power | ||||
| Forest1: CBS | 4 | 700 | 291 | 3.437 | 3.067 |
| Forest2: BNS | 21.7 | 1490 | 375 | 3.998 | 3.545 |
| Forest3: MKL | 25 | 1500 | 265 | 2.416 | 2.090 |
| Forest4: PSO | 25.3 | 1865 | 456 | 4.872 | 4.317 |
| Forest5: BKS | 27 | 3300 | 239 | 2.532 | 2.235 |
| Forest6: K83 | 25 | 1911 | 348 | 4.091 | 3.660 |
Other than R20, another important parameter which affects Ra estimation is the Q10 value. Currently, data for Q10 of Ra are scarce. As shown in the flow chart of this new method (Fig. 1), we used Q10 of Re derived from eddy flux observations. However, neither Re nor soil respiration Q10 of equatorial tropical forest is available partly due to narrow temperature ranges. Some studies even found a negative or quadratic relationship between soil respiration and temperature ([15]). Furthermore, Re is the sum of autotrophic (Ra) and heterotrophic components (Rh). The Q10 derived from flux tower Re, which includes the temperature sensitivity of both Ra and Rh, might induce some bias when Q10 of Ra and Rh is not the same.
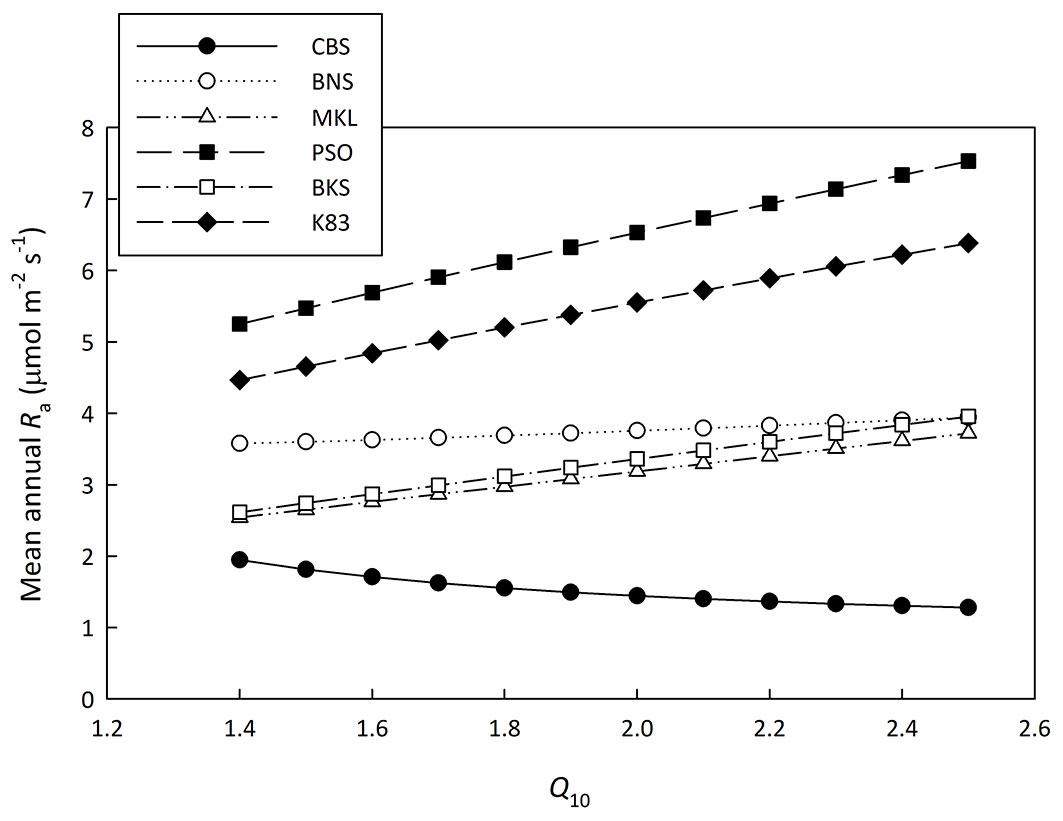
Concerning Q10, we analyzed the sensitivity of Q10 with Ra (Fig. 2). When the Q10 value varied from 1.4 to 2.5, Ra changed slightly for sites which have mean annual temperatures near 20 °C, (i.e., BNS - Fig. 2). However, these changes could be up to around 40% for other sites (Fig. 2). This means the Q10 sensitivity is a critical issue in the new method. The Q10 value for Re is available for CBS and BNS sites and it was used to drive the new method. For the other five tropical forests where Q10 is not available, it was set as 2.0 ([1], [42]) and the corresponding Ra estimates are shown in Tab. 2.
Fig. 2 - Sensitivity analysis of Ra to temperature sensitivity index (Q10). The mean annual autotrophic respiration rate (Ra) estimated with Q10 varied from 1.4 to 2.5 for each site.
Tab. 2 - A summary table for eddy flux based gross primary production (GPP), IBP based net primary production (IBP-NPP), metabolic theory based autotrophic respiration (Ra) and the new top-down method based NPP (New-NPP). All values are in the unit of tC ha-1 yr-1. (‡): For CBS and BNS, Q10 was derived from eddy flux based Re, for other forests Q10 was set at 2.0; (§): values in parentheses represent the range from estimates when Q10=1.4 to Q10=2.5; (£): values after “±” in this column are 20% uncertainties, as suggested by Desai et al. ([10]); other values after “±” in this table are standard deviations (STD); (1) Chen et al. ([6]); (2) Zhang et al. ([50]); (3) Dlioksumpun et al. ([11]); (4) Kosugi et al. ([23]); (5) Hirata et al. ([17]); (6) Malhi et al. ([30]); (7) Wang et al. ([44]); (8) Zhang et al. ([50]); (9) Kira ([22]); (10) Toma et al. ([43])
| Forest | Eddy flux GPP | IBP-NPP | R a ‡ | New-NPP £ |
|---|---|---|---|---|
| Forest1: CBS | 13.38 (1) | 7.69 (7) | 5.32 ± 0.31 | 8.06 ± 1.61 |
| Forest2: BNS | 23.42 ± 1.74 (2) | 8.80 (8) | 14.63 ± 0.86 | 8.79 ± 1.75 |
| Forest3: MKL | 23.98 (3) | 7.97 (3) | 12.06 (9.60~14.08)§ | 11.92 ± 2.38 |
| Forest4: PSO | 32.16 ± 1.32 (4) | 12.85 (9) | 24.72 (19.87~28.50) | 7.44 ± 1.48 |
| Forest5: BKS | 27.10 (5) | 14.70 (10) | 12.71 (9.87~14.97) | 14.39 ± 2.87 |
| Forest6: K83 | 31.40 (6) | 14.40 ± 1.30 (6) | 21.00 (16.90~24.15) | 10.40 ± 2.08 |
| Mean ± STD | 25.24 ± 6.85 | 11.07 ± 3.27 | 15.07 ± 6.90 | 10.17 ± 2.64 |
The third relevant issue which may induce additional uncertainties is the use of temperature response function to evaluate Ra. Several alternative functions are available for this case ([12]). For example, the highly cited Lloyd & Taylor ([27])’s function as (eqn. 7):
where E0 and T0 are two parameters which could be related to Q10 as (eqn. 8):
Similar to this, the classic Arrhenius function could be related to Q10 as (eqn. 9):
where Ea is the activation energy. We compared the application of Lloyd & Taylor ([27])’s function to the Q10 function of eqn. 3 with the dataset in CBS site. The uncertainty caused by this difference is small. To simplify the methodology, we eventually used eqn. 3 for all cases in this study.
Eddy flux based GPP and its uncertainties
One crucial component of the new top-down method is reliably calculating GPP with eddy covariance based carbon fluxes (Fig. 1). The GPP can be obtained by decomposing NEE as shown in eqn. 5. Extrapolating the post u* filtering nighttime Re to that of daytime is a common method within the flux community ([38]). It has successfully been used to reproduce global GPP ([2]). Nevertheless, the Reichstein et al. ([38]) method was criticized for not providing a reliable GPP value. Leaf respiration may be inhibited under light conditions. Using values extrapolated from nighttime, but rather that of daytime, overestimates Re and subsequently the GPP ([47], [46]).
As an alternative method, daytime respiration could be also obtained by extending daytime measurements to zero light, commonly termed as light response method ([48], [24]). Rather than an extensive discussion and comparison on decomposition techniques separating NEE into GPP and Re, we used CBS site’s data as a case analysis. The light response regression was done with a window of 10 days by using the Michaelis-Menten function as (eqn. 10):
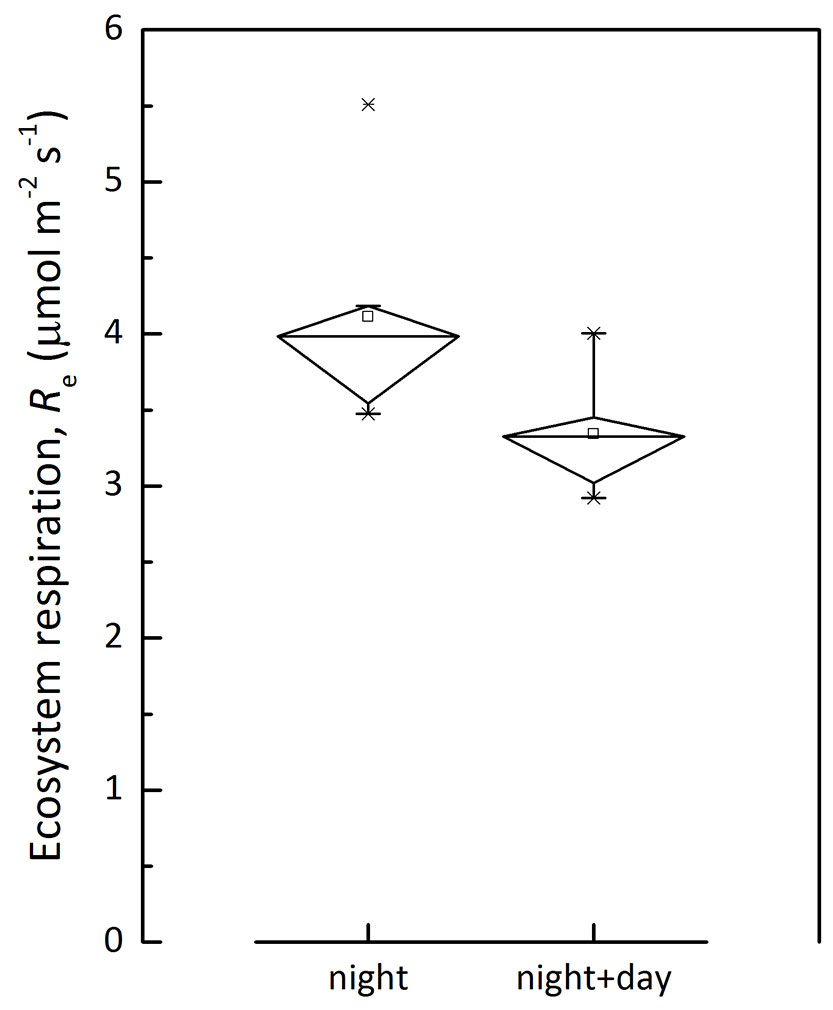
where I is the light intensity, α is the apparent quantum yield representing the slope under weak light, Pm is the light-saturated photosynthesis rate, Rd is the derived daytime ecosystem respiration. The temperature dependence of Rd and nighttime Re of CBS site is shown in Fig. 3. Nighttime Re was generally higher than that of daytime Re derived from light response. The Re estimation was compared between that derived from nighttime data only and that based on both day- and nighttime data (Fig. 4). This supports the claim that Re with nighttime flux was overestimated ([46]), though the methods include some difficulties to quantify components.
Fig. 3 - A comparison on daytime ecosystem respiration (Re, black circles and solid regression line) derived from light response and nighttime Re (dark grey circles with dashed line). The Q10 model (see text for detail) was used in fitting the dataset.
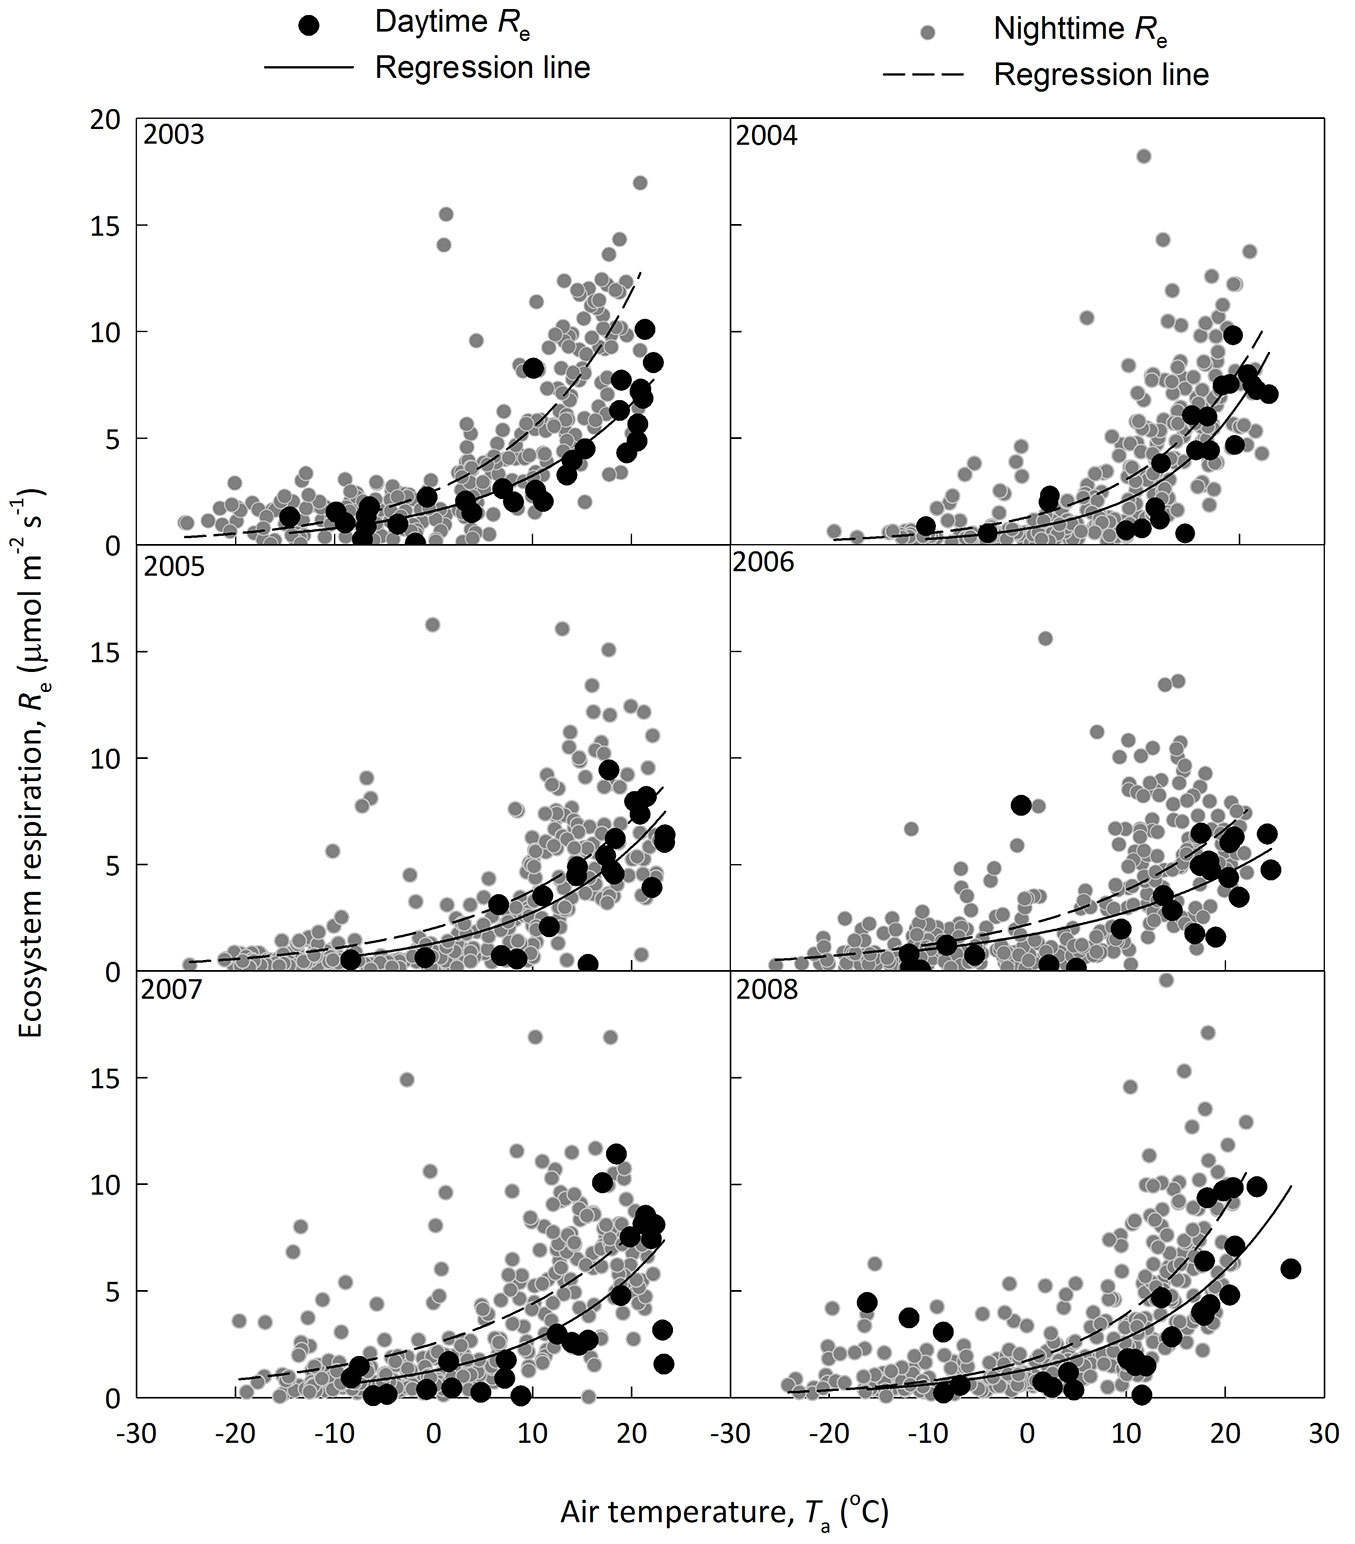
Fig. 4 - A comparison on mean ecosystem respiration rate estimated with nighttime data only (night) and a combining of both day- and night-time data (night+day).
(i) Can Rd accurately represent the daytime ecosystem respiration? Rd estimate is very sensitive to weak light observations. Weak light intensity usually occurs under transitional periods in the early morning, late afternoon or in periods of high cloud cover. Rapid and large changes in atmospheric stability will cause unnecessary uncertainties in this process, i.e., the flux burst effect in the morning ([14]).
(ii) Could Rd derived from the simple light response model represent the daytime ecosystem respiration in reality? A group of variables drive daytime fluxes including Rd. Lasslop et al. ([24]), for example, showed that a model water vapor pressure deficit (VPD) included could work better in obtaining Re and GPP than a model drive by temperature only.
Uncertainties along with decomposition techniques in deriving GPP are substantial. Desai et al. ([10]) compared 23 decomposition methods and reported that most methods differed up to 20% in estimates of both GPP and Re (see also [38], [48], [10], [24], [39]).
In this study, we cite published GPP values for each site (Tab. 2) as a defensible, persuasive and unified decomposition technique on eddy flux based GPP is currently unavailable ([10], [46]). Eddy flux data processing usually needs further site-specific information. We also compare the reported GPP to that obtained with an online processing procedure (⇒ http://www.bgc-jena.mpg.de/bgi/index.php/Services/REddyProcWeb) widely used in European Flux communities for CBS and BNS, both of which show high levels of agreement. Thus, the up-to-date GPP reported by site’s investigators could be viewed as a good option.
The matching of inventory plot with eddy flux footprint
To apply the proposed method, we should ensure that the plot used for the inventory is comparable with the eddy covariance flux footprint for that site. Nevertheless, the scale of inventory plot and eddy flux footprint is usually not well matched both in space and time. While an inventory plot is usually set in a few hectares, an eddy flux footprint could be as large as ~1 km2. In the current study, we selected six forests to validate the proposed method. The inventory plots of CBS, BNS, and PSO sites were just located within the eddy flux footprint. For the K83 site, inventory and eddy flux data have already been used in a matching method to address carbon balance ([32]). The forest type and disturbance history were the same in the inventory plot and eddy footprint for all six sites.
Another helpful experimental design is setting multiple small plots instead of a big one. Multiple small plots distributed in the footprint, when all footprint biomass estimation is not affordable, are definitely better in terms of representativeness than a single big one placed somewhere in the vicinity ([25]). This helpful design was not involved in the current study but was strongly recommended for future studies.
Comparison on the new top-down NPP and IBP based NPP
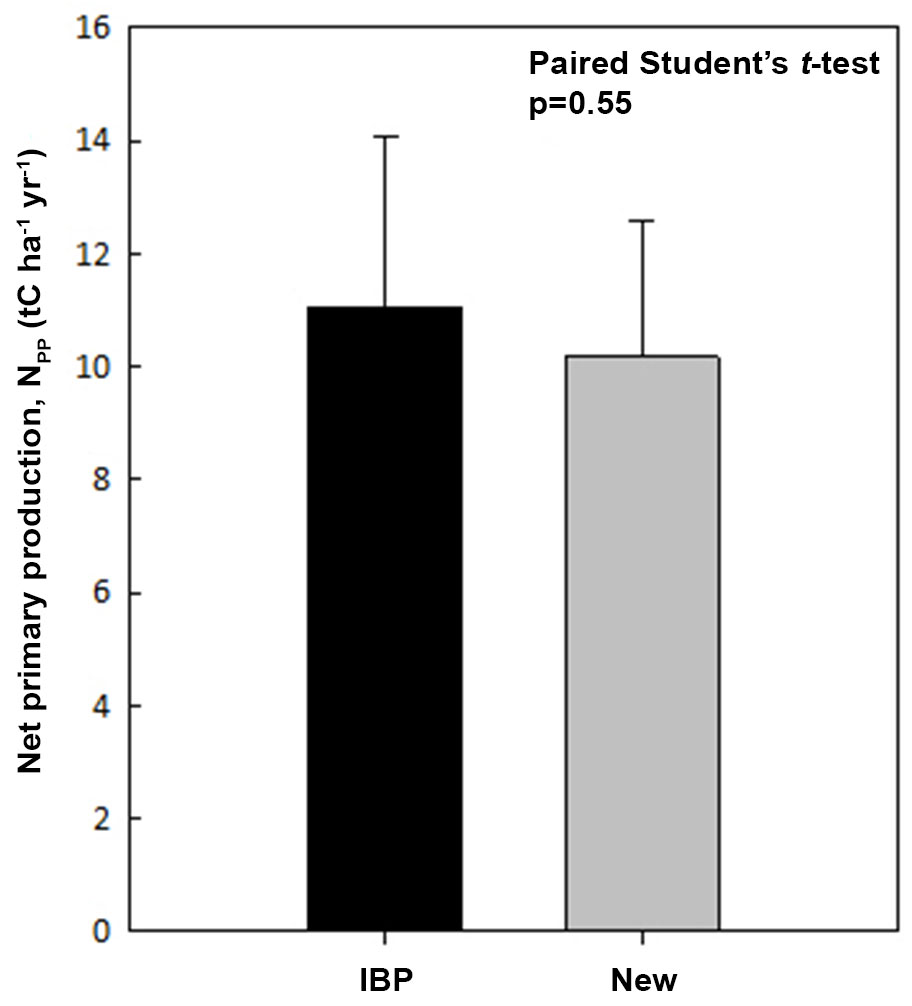
Both the new top-down NPP and the IBP based NPP estimates are listed in Tab. 2, and a paired Student t-test showed no significant difference (p=0.55 - Fig. 5). We also found NPP estimates are nearly identical for the CBS and BNS sites where Q10 is available, providing strong support for the new top-down method.
Fig. 5 - A comparison on net primary production (NPP) estimated with IBP method (IBP-NPP) and the new top-down method (New-NPP).
Nevertheless, the new NPP differed from the IBP NPP in the MKL, PSO and K83 sites. For the PSO and K83 sites, the new NPP seems to be underestimated whilst Ra overestimated. This underestimation may be related to the assumed fixed Q10 value. Conversely the MKL site shows the opposite, and the biomass of the MKL site is as low as that of the temperate CBS forest. The MKL forest is under its secondary growth. The stand age of this secondary forest is only around 38 years and the inventory data used to calculate biomass and Ra was collected in year 1992, when the stand age was only 14. Since biomass is expected to increase during the early stages of secondary growth, the biomass and Ra derived with data collected in 1992 is likely to be underestimated, which may account for the overestimation of Ra with the new method in MKL.
Further support for the new top-down methods can be derived from the carbon use efficiency (CUE), i.e., the ratio between NPP and GPP. CUE was reported to be about 0.50 in temperate forests ([45], [9], [49]) and about 0.35 in tropical forests ([29]). CUE derived from the new top-down method was 0.60 in temperate forest and around 0.3 for primary tropical forests (CUE is 0.37, 0.23, 0.33 for BNS, PSO, K83, respectively), which agree well with the previous suggestions.
The seasonal variation of NPP
Accurately quantifying the seasonal variation of forest NPP by the IBP method is challenging. The tradition temporal resolution for IBP based NPP is a year ([7]), which ignores temporal variability in climatically variable sites. Most of our knowledge of NPP seasonality is indirectly obtained through remote sensing ([13], [37]). The remote sensing inversion of NPP is based on the strong relationship between NPP and the vegetation index. We utilized the finest temporal resolution available for the top-down NPP to test the relationship between the NPP and the vegetation index.
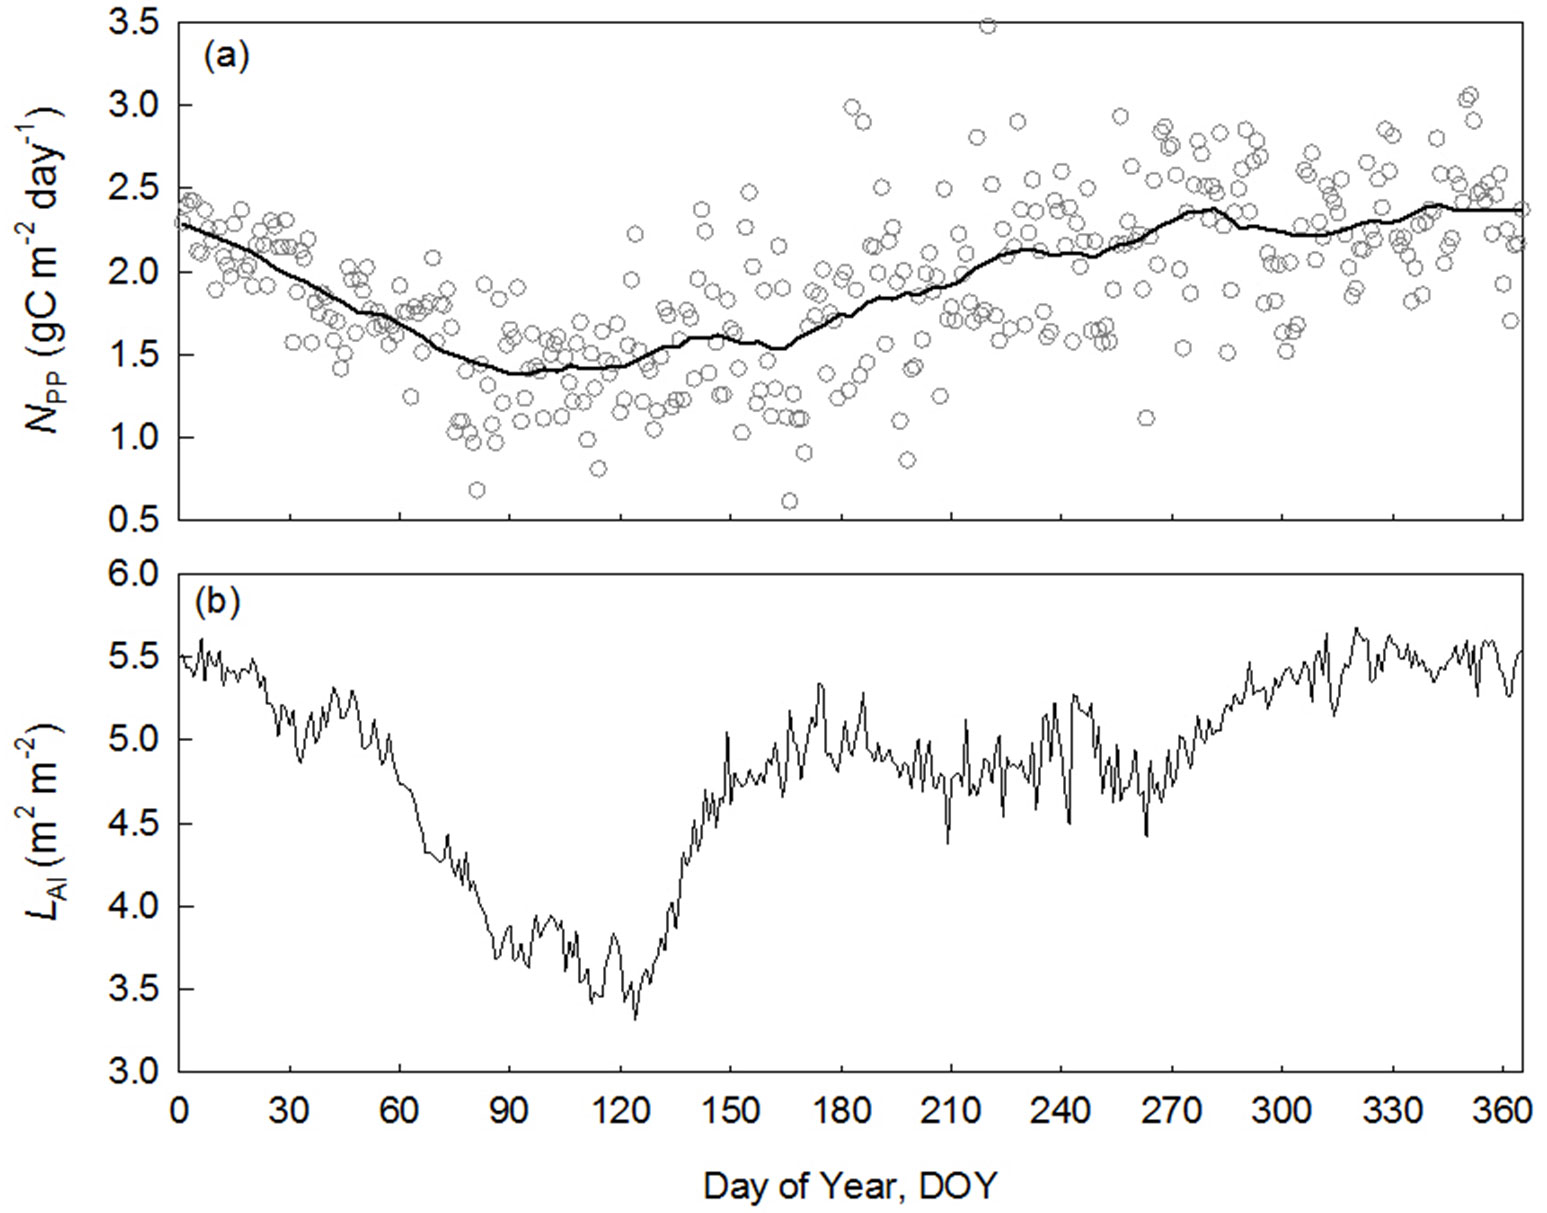
The seasonality in NPP is clear in BNS (Fig. 6a), and is lowest during the late dry season when water vapor pressure deficit (VPD) and soil water deficit peak (indicated by soil water content, SWC). The leaf area index (LAI) was also lowest in the period. A close relationship was found between LAI and NPP (Pearson’s r=0.56, n=365). This result confirmed the reliability of remote sensing derived NPP and provides a direct estimate on seasonal NPP.
Fig. 6 - Seasonal variation of net primary production (NPP) calculated by the proposed new method and leaf area index in a tropical rainforest of Xishuangbanna (BNS), China. (a): daily NPP in open circles in black grey, solid line show smoothing line; (b): daily leaf area index (LAI) derived from light transmittance.
Currently, many forest sites have installed eddy covariance systems and established inventory plots. A world-wide test on this new top-down method will both advance our knowledge on NPP and give a more solid terrestrial NPP estimation. The limitations and uncertainties of the new top-down method are substantial. Incorporating other process based models into the top-down method would increase accuracy and may enhance its value as a standard method.
Conclusions
Forest NPP is a fundamental parameter describing the ecosystem functioning. It is the change rate of biomass including woody, leaf and woody tissues, exudates and volatile organic carbon compounds. We proposed a novel method to quantify NPP using measurements that are different from the traditional IBP method. We propose the use of eddy covariance together with the total biomass and the scaling factor proposed by Mori et al. ([34]) to estimate the autotrophic respiration (Ra). Then NPP is simply obtained from the gross primary production (GPP) derived from eddy covariance, with the simple equation NPP = GPP - Ra.
Six sites were used to validate the proposed new method. They were selected because of the good match between inventory plot and eddy flux footprint. The new method provides reliable annual NPP estimations which are consistent with bottom-up results. This consistence was also supported by the past knowledge on carbon use efficiency. Taking the advantage of fine temporal resolution of the new top-down method, the seasonal changes of NPP at daily interval was presented. A close relationship between NPP and leaf area index was found at seasonal scale. This finding validated the new method on the one hand, and provided further support of using satellite vegetation index to address NPP dynamics on the other. The potential of this new method as a standard NPP method is high because of the world-wide network on eddy tower and inventory plot, however further work of using the method with cases under environmental stress is needed to fully evaluate its performance under variable conditions.
Acknowledgements
Eddy flux data sources include ChinaFLUX, AsiaFLUX, CForBio, website ⇒ http://www.ess.uci.edu/~lba/ and ⇒ http://www.ffpri.affrc.go.jp/labs/EA-FDPN/. We would like to express thanks to the projects of “Long-term monitoring of forest carbon dynamics in East Asia [EA-FDPN Phase II]”, ChinaFLUX, AsiaFLUX, CForBio and LBA for providing the data. The study was supported by National Natural Science Foundation of China (NSFC no. 31660142, 31200347), Youth Innovation Promotion Association of Chinese Academy of Sciences, and C-Project for talents of Hainan University.
References
CrossRef | Gscholar
Gscholar
CrossRef | Gscholar
Gscholar
Gscholar
CrossRef | Gscholar
Gscholar
Gscholar
Online | Gscholar
CrossRef | Gscholar
CrossRef | Gscholar
CrossRef | Gscholar
CrossRef | Gscholar
Authors’ Info
Authors’ Affiliation
Ecology Program, Department of Environmental Science, Hainan University, Haikou 570228 (China)
Alice Hughes
Yi-Ping Zhang
Xiao-Bao Deng
Min Cao
Yue-Hua Hu
Xishuangbanna Tropical Botanical Garden, Chinese Academy of Sciences, Kunming 650223 (China)
Department of Forest Vegetation, Forestry and Forest Products Research Institute, Tsukuba 305-8687 (Japan)
Zhan-Qing Hao
Institute of Applied Ecology, Chinese Academy of Sciences, Shenyang 110016 (China)
Forest Hydrology Lab, Graduate School of Agriculture, Kyoto University, Kyoto 606-8502 (Japan)
Department of Earth System Science, University of California, Irvine 92697 (USA)
Institute of Geographic Science and Natural Resources Research, Chinese Academy of Sciences, Beijing 100101 (China)
Institute of Botany, Chinese Academy of Sciences, Beijing 100093 (China)
Corresponding author
Paper Info
Citation
Tan Z-H, Hughes A, Sato T, Zhang Y-P, Han S-J, Kosugi Y, Goulden M, Deng X-B, Cao M, Hao Z-Q, Hu Y-H, Yu G-R, Ma K-P (2017). Quantifying forest net primary production: combining eddy flux, inventory and metabolic theory. iForest 10: 475-482. - doi: 10.3832/ifor2159-010
Academic Editor
Silvano Fares
Paper history
Received: Jul 01, 2016
Accepted: Feb 13, 2017
First online: Apr 12, 2017
Publication Date: Apr 30, 2017
Publication Time: 1.93 months
Copyright Information
© SISEF - The Italian Society of Silviculture and Forest Ecology 2017
Open Access
This article is distributed under the terms of the Creative Commons Attribution-Non Commercial 4.0 International (https://creativecommons.org/licenses/by-nc/4.0/), which permits unrestricted use, distribution, and reproduction in any medium, provided you give appropriate credit to the original author(s) and the source, provide a link to the Creative Commons license, and indicate if changes were made.

Web Metrics
Breakdown by View Type
Article Usage
Total Article Views: 53801
(from publication date up to now)
Breakdown by View Type
HTML Page Views: 44044
Abstract Page Views: 3913
PDF Downloads: 4559
Citation/Reference Downloads: 29
XML Downloads: 1256
Web Metrics
Days since publication: 3367
Overall contacts: 53801
Avg. contacts per week: 111.85
Article Citations
Article citations are based on data periodically collected from the Clarivate Web of Science web site
(last update: Mar 2025)
Total number of cites (since 2017): 2
Average cites per year: 0.22
Publication Metrics
by Dimensions ©
Articles citing this article
List of the papers citing this article based on CrossRef Cited-by.
Related Contents
iForest Similar Articles
Review Papers
Separating soil respiration components with stable isotopes: natural abundance and labelling approaches
vol. 3, pp. 92-94 (online: 15 July 2010)
Research Articles
Do the rubber plantations in tropical China act as large carbon sinks?
vol. 7, pp. 42-47 (online: 21 October 2013)
Research Articles
Effect of different dolomitic limestone dosages on soil respiration in a mid-altitudinal Norway spruce stand
vol. 12, pp. 357-365 (online: 05 July 2019)
Research Articles
Effects of altitudinal gradients on leaf area index, soil microbial biomass C and microbial activity in a temperate mixed forest ecosystem of Northwestern Turkey
vol. 10, pp. 334-340 (online: 15 December 2016)
Research Articles
Carbon and water vapor balance in a subtropical pine plantation
vol. 9, pp. 736-742 (online: 25 May 2016)
Research Articles
Distribution factors of the epiphytic lichen Lobaria pulmonaria (L.) Hoffm. at local and regional spatial scales in the Caucasus: combining species distribution modelling and ecological niche theory
vol. 17, pp. 120-131 (online: 30 April 2024)
Short Communications
Respiratory costs of woody tissues in a Quercus pyrenaica coppice
vol. 11, pp. 437-441 (online: 18 June 2018)
Short Communications
Influences of Black Locust (Robinia pseudoacacia L.) afforestation on soil microbial biomass and activity
vol. 9, pp. 171-177 (online: 16 February 2015)
Research Articles
Soil C:N stoichiometry controls carbon sink partitioning between above-ground tree biomass and soil organic matter in high fertility forests
vol. 8, pp. 195-206 (online: 26 August 2014)
Research Articles
Soil respiration and carbon balance in a Moso bamboo (Phyllostachys heterocycla (Carr.) Mitford cv. Pubescens) forest in subtropical China
vol. 8, pp. 606-614 (online: 02 February 2015)


