Do the rubber plantations in tropical China act as large carbon sinks?
iForest - Biogeosciences and Forestry, Volume 7, Issue 1, Pages 42-47 (2014)
doi: https://doi.org/10.3832/ifor0891-007
Published: Oct 21, 2013 - Copyright © 2014 SISEF
Research Articles
Abstract
The regrowth of tropical secondary forests and plantations can not offset the carbon release caused by tropical deforestation, consequently determining net carbon losses on tropical lands. However, large uncertainties remain in relation to this assumption. Here, we used a biometric method to estimate the net dry matter production and net ecosystem production in a rubber forest, the most widespread plantation type in tropical Southeast Asia. According to biometric estimates made during the study, the ecosystem was a carbon sink (790 gC m-2 yr-1). Net ecosystem carbon fluxes were measured by the eddy covariance method. The carbon budget estimated using the FluxNet procedure (904 gC m-2 yr-1) was closer to the biometric estimates in comparison to a method based on data measured during neutral atmospheric conditions. Overall, when considering the whole life cycle, including deforestation of the prior-existing tropical forest, the hypothesis of plantations serving as large carbon sinks is not supported by our study.
Keywords
Carbon Sink, Eddy Flux, Biometric Method, Neutral Atmospheric Condition
Introduction
The largest errors in assessing the terrestrial carbon balance are believed to stem from uncertain rates of tropical deforestation or rainforest conversion ([24], [25]). The conversion of tropical rainforest into plantations affects vegetation and soils and thus changes the amount of stored and fixed carbon in an ecosystem. The carbon released to the atmosphere by the destruction of tropical rainforests in Indonesia during 1981-1990 was 9.3×10¹⁴ gC ([23]), while the net release of carbon associated with land use change in sub-Saharan Africa over the period 2000-2005 was estimated to be 0.24×10¹⁵ gC yr-1 ([4]). Estimates of emissions indicate that if tropical grasslands are replaced by oil palm plantations, then carbon fixation in plantation biomass and soil organic matter results in the net removal of about 1.35×10⁸ g CO2 ha-1 from the atmosphere during the first 25-year cycle of oil palm growth ([11]). Stimulated by the high price of rubber (Hevea brasiliensis), rubber plantations have been replacing primary tropical rainforests with dramatic speed in recent years in China. In Xishuangbanna, Yunnan Province, plantations cover an area of 2.87× 10⁵ ha (statistical data are from 2011), and have spread to most areas except for protected nature reserves. This growth exceeded the expectations of the Chinese government, which encouraged and invested heavily in the planting of rubber trees to secure China’s social and economic development at the beginning of the 1950s. Rubber is not just an economic crop, but represents an important environmental issue of concern to the public, government, and the scientific community. Environmentalists tend to believe that planting rubber will induce more carbon release, lead to severe drought, and harm the environment, whereas the government states that rubber plantations are forests just like any other forest and will not cause any environmental harm.
Currently, the micrometeorological-based eddy covariance method is widely used for the investigation of carbon balance in a variety of ecosystems ([2], [3], [14]). The strength of this method lies in its efficacy in providing high temporal resolution flux data with a spatial representativeness of hundreds of hectares under slight to no disturbance when compared with traditional biometric methods ([16]). However, night time eddy flux data, commonly used to estimate ecosystem respiration and a necessary part of the annual carbon balance assessment, has been criticized for its low reliability ([12], [21], [27], [22]). To address this problem, the friction velocity (u*) correction method is used as a standard step in annual carbon budget assessments, from site-specific analysis to FluxNet community synthesis ([12], [36], [28]). Nevertheless, in some cases u* has not been a proper indicator of turbulence intensity ([1]), while in other cases, it was not possible to estimate a u* threshold for some sites ([30], [32]) or more than half of the nighttime data were removed after u* filtering ([29], [31]). Extrapolating these sometimes limited data to annual budgets will therefore cause greater uncertainty, and filling data gaps provides another substantial challenge ([9], [22]).
An alternative to the above approach is the use an inventory-based biometric method, which has been used to estimate forest Net Ecosystem Productivity (NEP), although there are limits to the estimation of soil C sequestration. In the tropics, eddy covariance-based carbon budgets have been reported to be generally higher than biometric estimates both before and after u* filtering ([20], [29], [21], [26], [31], [38]). As large uncertainties are associated with both methods, the question is which one should be adopted when assessing specific forest carbon budgets ([29]). In tropical rain forests, the high and uneven canopy, the high biodiversity, and the strong heterogeneity of the environment introduce extra uncertainties to measurements and data interpretation. For example, approximately 300 allometric measures per hectare were needed to fulfill the standard for species-specific allometric equations required for biomass estimations ([5]). This was unfeasible in field conditions, in that, e.g., exact breast-girth data were not available due to the presence of buttress roots ([7]).
In the Xishuangbanna tropical rainforest, both long-term catchment water observations and direct eddy covariance estimates indicate that more water underwent evapotranspiration in the rubber plantations than in the rainforest ([33]). However, little knowledge or observational data on carbon fluxes has been available so far.
In this investigation, we assessed the carbon budget of a 33-year-old rubber plantation in tropical China. Specifically, this study was designed to determine: (1) if adult tropical rubber plantations are carbon sinks or sources; (2) whether eddy covariance and biometric estimates converge in a monoculture forest; and (3) if rubber plantations are a potential carbon sink when compared to primary tropical rainforest.
Methods
Site description
The study site is located in the experimental area of the Xishuangbanna Tropical Botanical Garden (21° 55’ 30” N, 101° 15’ 59” E; size ~ 20 ha; elevation 570 m a.s.l.), Xishuangbanna, Yunnan Province, south-western China. In recent years, tropical rainforests have been largely replaced across the whole region by rubber plantations for economic reasons. The Xishuangbanna experimental area was established by the Chinese Academy of Sciences to study the impact of widespread rubber plantations on the local environment. The study site is included in a larger area, all planted with rubber trees.
The climate in this area is strongly seasonal with two air masses alternating over the year ([39]). Between May and October, the tropical southern monsoon from the Indian Ocean delivers most of the region’s annual rainfall, whereas the dry and cold air of the southern edges of the subtropical jet stream dominates the climate between November and April ([31]). The mean annual rainfall over the past 50 years was 1492 mm, and approximately 87% of this rainfall occurred during the wet half of the year (the rainy season). The mean annual temperature is 21.7 °C, with monthly mean values ranging from 15.9 to 25.7 °C ([31]). The general topography of the area is essentially hilly terrain.
The 33-year-old rubber plantation studied has a mean canopy height of approximately 22 m. Trees were planted 2 m apart in rows with mixed spacing between the rows, from narrow (4 m) to wide (12 m),. The main rubber-tapping period is from May to November. Fertilization is performed in April and July of each year, and understory weeds and seedlings are excluded using herbicides or by hand weeding.
Biometric-based NEP estimations
Assessment of the net ecosystem production was carried out by the forest department using the most commonly employed biometric method ([15], [18] - eqn. 1):
where NEPc is commonly defined as the net ecosystem production, NPP is the net primary production, Rh is the soil heterotrophic respiration, ΔB is the biomass increment, and Lp is aboveground and belowground litterfall production.
For rubber plantations, rubber tapping (as it relates to carbon loss) should be included in the NEP estimation. Thus, eqn. 1 was modified to (eqn. 2):
where NEPr is the adjusted NEP for the rubber plantation and Prt is the carbon lost from rubber tapping.
A method based on tree growth theory was proposed for estimating the biomass increment. Using the assumption that the biomass accumulation of a monoculture stand will be similar to that of individual tree growth, the logistic equation was used to fit the stand age vs. stand biomass curve. For a normal year, the biomass increment was then calculated as follows (eqn. 3):
where t is the year since planting, t is a positive integer starting from 1, and Ct is the carbon density in year t as calculated from the specific logistic equation. Rubber trees in plantations usually live no longer than 60 years, and trees 40 years or older exhibit low rubber production and are generally felled by farmers.
In our study area, we selected a stand where the age series ranged from 5 to 47 years. By using the investigation data of 30 rubber trees with different ages in the 10 stands (3 trees per stand) and diameter at breast height, a regression model of the biomass relating with DBH (diameter at breast height, 1.3 m) was established and applied to estimate the biomass of 30 rubber plantations with different stand ages ([35]). Biomass was then converted into carbon density using a factor of 0.5 ([31]). Litterfall production was estimated using the litter capture method. Twenty 0.25 m2 litter traps were placed randomly within 1 hectare of the area covered by the eddy flux footprint. All litter collections were sorted into leaves, small branches, flowers, fruits, epiphytic materials and “mixed matter,” and then dried to constant weight at 80 °C.
We selected 4 plots (10×15m) in the rubber plantation and 3 sub-plots (4×5m) in each plot, which were set as control (CK) and root trenching (NR). In the NR plots, we used a PVC pipe ( 630 mm, H 500 mm) to carry out root trenching (PVC pipes can prevent new root regrowth). In the center of each sub-plot one PVC connector was inserted 3 cm underground, mating a PVC pipe ( 200 mm, H 200 mm), creating a respiration box for measuring soil respiration. Soil respiration was measured using a static chamber combined with an infrared gas analyzer (Li-820, Li-Cor Inc., Lincoln, NE, USA). Sampling was performed every morning between 09:00 and 11:00 local time from March 2008 to February 2009 ([19]).
Eddy covariance-based NEE estimations
An open-path eddy covariance system consisting of a three-dimensional sonic anemometer (CSAT3, Campbell Scientific Inc., Logan, UT, USA) and an open-path infrared gas analyzer (Li-7500, Li-Cor Inc., Lincoln, NE, USA) were mounted at a height of 38.0 m on a 55-meter iron meteorological observation tower (Fig. S1 in Supplementary Material). Seven levels of instruments (at 2.2, 8.7, 16.8, 21.3, 28.9, 37.8, and 56.6 m) were mounted on the tower to obtain profiles of wind speed (A100R, Vector Instruments, Denbighshire, UK), air temperature, and relative humidity (HMP45C, Vaisala, Helsinki, Finland). Instruments for measuring wind direction (W200P, Vector Instruments, Denbighshire, UK) and rainfall (Rain Gauge 52203, R. M. Young Co., Traverse City, MI, USA) were installed at the top of the tower. Net radiation was calculated from the downward and upward, short- and long-wave radiation (CNR-1/CM11, Kipp & Zonen, Delft, the Netherlands) at a height of 28.6 m. Photosynthetically-active radiation was measured using linear sensors (LQS70-10, APOGEE, USA) at heights of 1.9 and 28.6 m. Soil moisture and temperature profiles were also monitored (CS616-L, Campbell, USA and 105/107 L, Campbell, USA, respectively). Two soil heat flux plates (HFP01, Hukseflux, the Netherlands), installed in south- and north-facing orientations, were used to measure the average soil heat flux. Eddy flux and meteorological data were separately collected using a CR5000 (Campbell Inc., USA) at a frequency of 10 Hz and a CR1000 (Campbell Inc., USA) every 30 min.
The net ecosystem CO2 exchange (NEE) was calculated as follows (eqn. 4):
where Fc is the eddy flux, Fs is the storage flux, ω is the vertical wind velocity, c is the density of CO2, the primes denote deviations from the mean and the over-bar indicates a time average, Δc is the variation in CO2 concentration, Δt is the time interval, and zr is the reference height (38.0 m). By convention, negative NEE values indicate CO2 flux from the atmosphere into the forest. Thus, NEE is equal to NEP, but with an opposite sign.
The software used to perform the eddy flux data processing is recommended by FluxNet and maintained online by the Max Planck Institute (⇒ http://www.b/⇒ http://www.bgc-jena.mpg.de/~MDIwork/eddyproc/index.php). The used software implements the Reichstein u* filtering and the flux-partitioning method ([28]), as well as the Lasslop flux-partitioning method ([17]). Before data processing, all commonly used steps, such as coordinate rotation ([34]), WPL correction ([37]), storage flux correction, and hard spike exclusion, were performed.
Micrometeorological theories and hypotheses are generally more accurate under neutral atmospheric conditions. Based on this consideration, we also used a method called “neutral atmospheric condition based eddy flux estimation” to process our carbon budget dataset. In this procedure, we selected the neutral atmospheric condition data (-1<ξ<1), which accounted for about 80% of all data, and filled the gap during non-neutral atmospheric conditions with environmental response curves derived from neutral atmospheric conditions ([32]). The atmospheric stability index (ξ) used in our method was obtained as follows (eqn. 5):
where L is the Monin-Obukhov length, κ is the Karman constant (0.41), g is gravitational acceleration (9.8 m s-2), θ* is the temperature scale, zr is the measurement height (m), θ is the potential temperature, u* is the friction velocity, w is the vertical wind velocity, and d is the zero-plane displacement height (m), which is specific for tall vegetation and was derived from the wind profile data.
Additional data quality assessments, such as ecosystem energy closure (Fig. S2 in Supplementary Material), spectrum analysis (Fig. S3 in Supplementary Material), flux environmental response (Fig. S4 in Supplementary Material), and cumulative frequency distribution of wind speed (Fig. S5 in Supplementary Material) were also performed.
Results
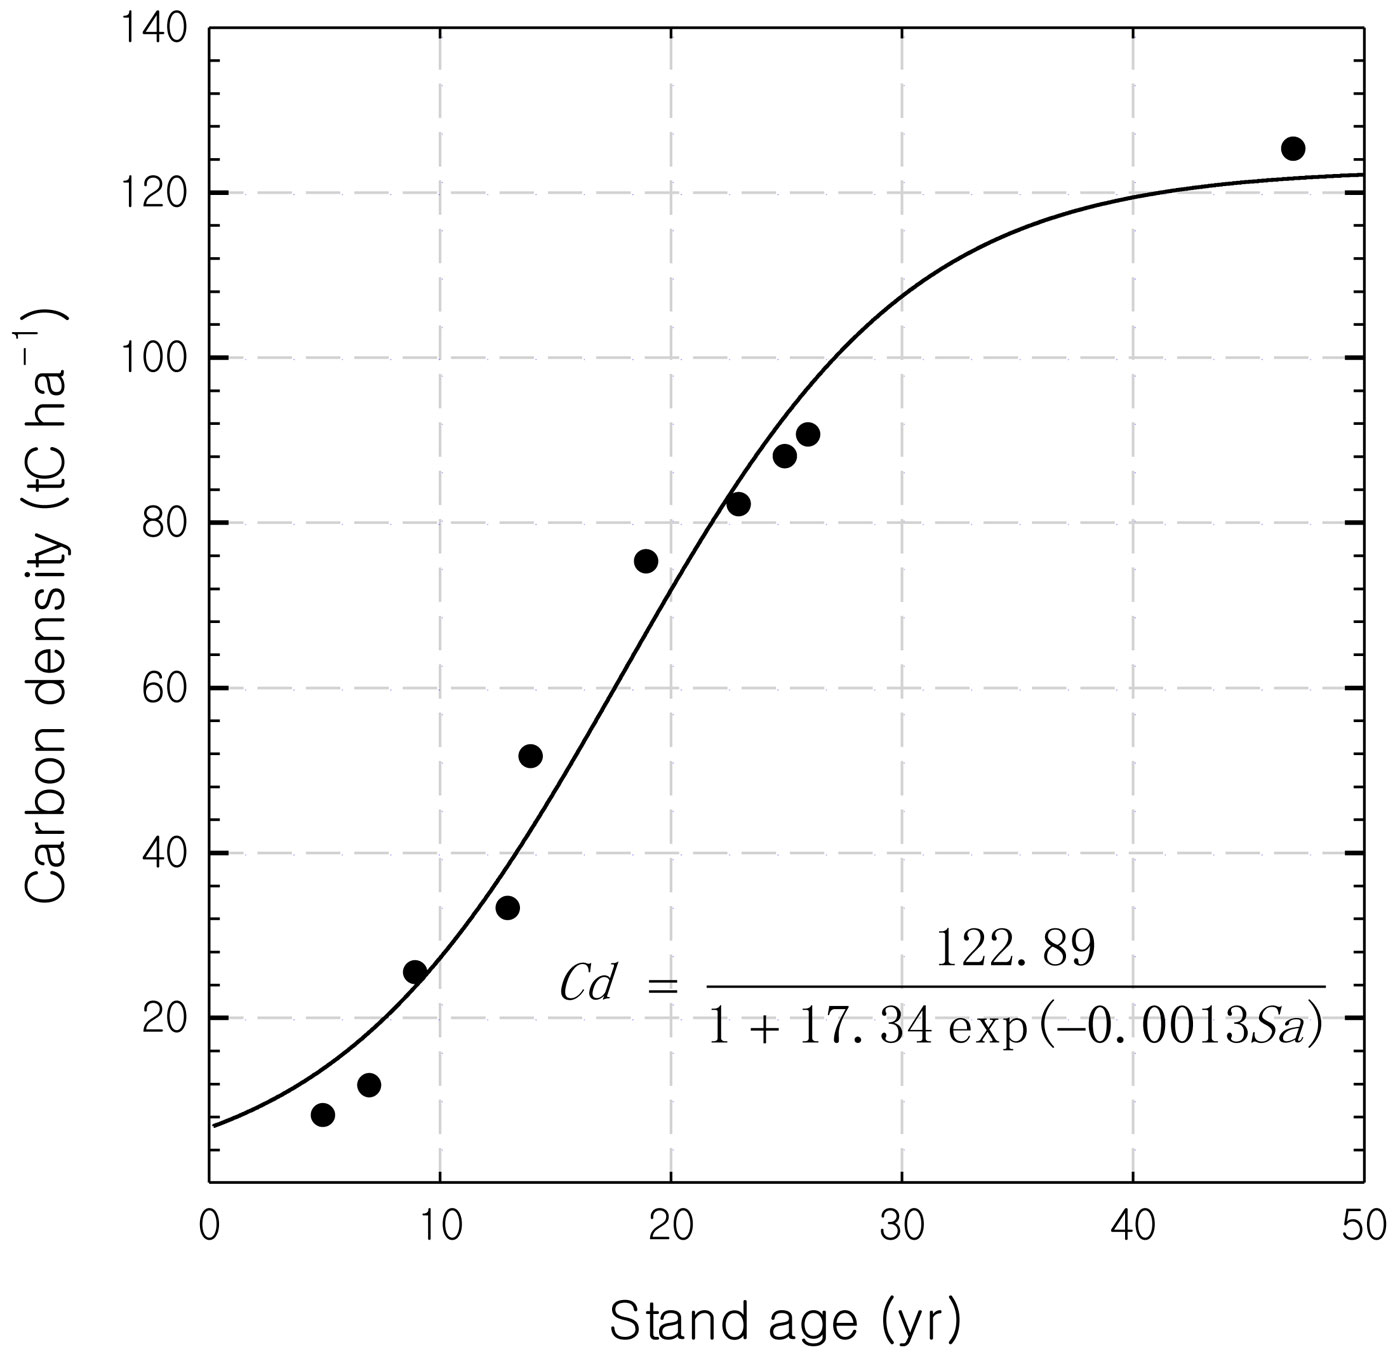
Logistic equations can be used to describe the relationship between stand age and carbon density as expected (Fig. 1). The predicted maximum carbon density of the rubber stands was 122.89 tC ha-1 at the age of 49 years. The largest carbon accumulation rate (4.9 tC ha-1 yr-1) occurred at 17 years. The biomass increment from 32 to 33 years as calculated from the equation was 1.37 tC ha-1 yr-1 (which is equal to 137 gC m-2 yr-1).
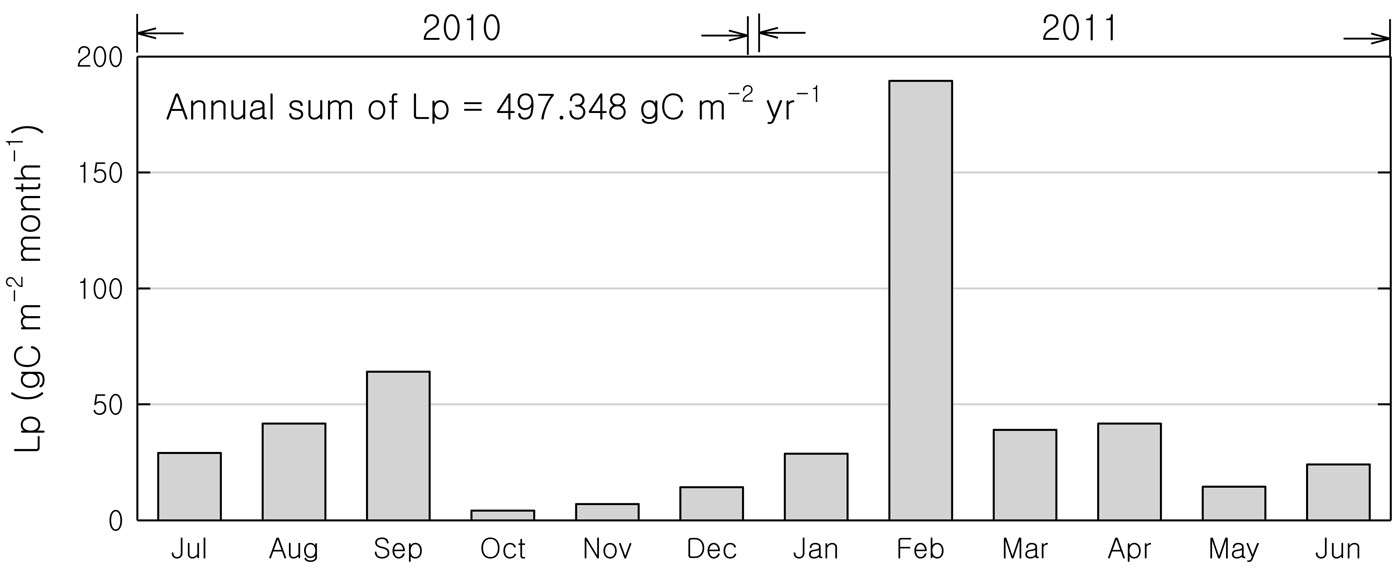
Rubber tree is an evergreen species in its native habitat, but in our study area trees become deciduous and shed their leaves after the coldest month (January). Aboveground litterfall production peaked in February (Fig. 2). The second aboveground litterfall peak in September was connected with fruit production. The annual aboveground litterfall production observed at the site was approximately 497 gC m-2. In this study, we did not measure the belowground litterfall production. If we conservatively assume that belowground litter input at this site is similar to aboveground litterfall ([8]), the total litterfall production was about 1000 gC m-2.
Fig. 2 - The monthly variations of aboveground litterfall production (Lp) in the rubber plantation from July 2010 to June 2011.
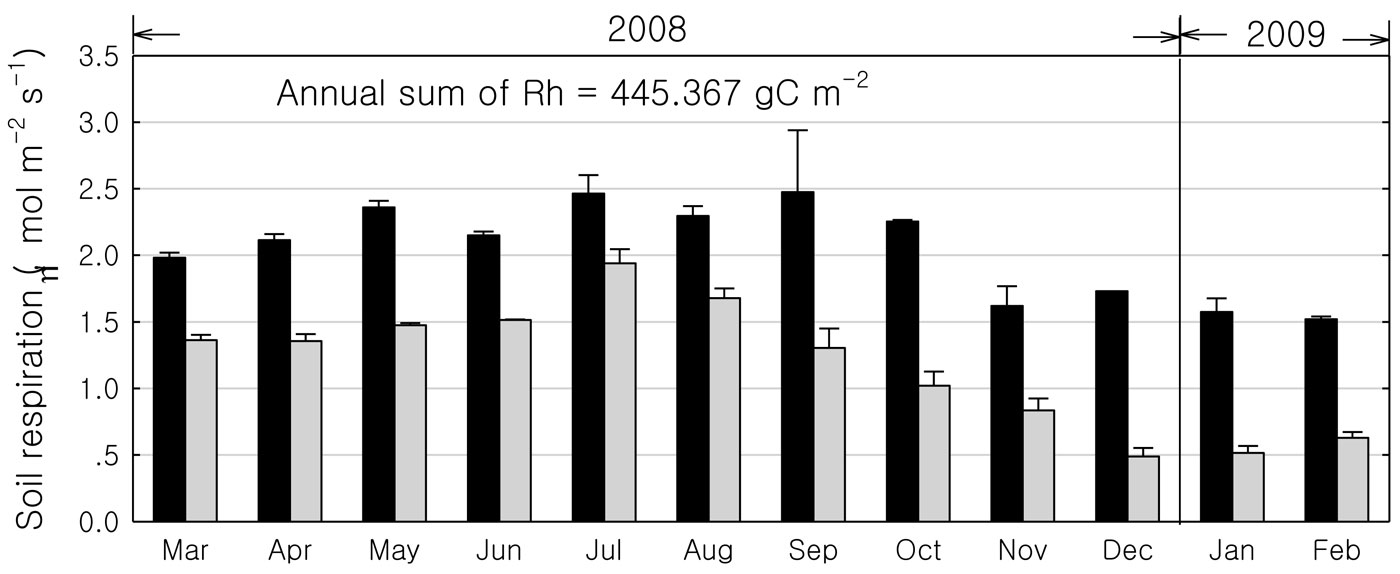
Soil respiration was higher during the rainy season than during the dry season, while the heterotrophic to total respiration ratio was higher during the dry season than during the rainy season (Fig. 3). Highest total and heterotrophic respiration were observed in September (2.5 μmol m-2 s-1) and July (1.9 μmol m-2 s-1). The annual heterotrophic respiration was about 445 gC m-2. We compared our soil respiration data with previously reported estimates at the same site using the soda lime absorption method ([10]), finding no significant differences (2.02 vs. 2.06 μmol m-2 s-1, respectively). Spatial heterogeneity in soil respiration was small at this site.
Fig. 3 - The monthly variations of soil respiration in the rubber plantation from March 2008 to February 2009. (Black columns): total soil respiration; (grey columns): heterogeneity respiration).
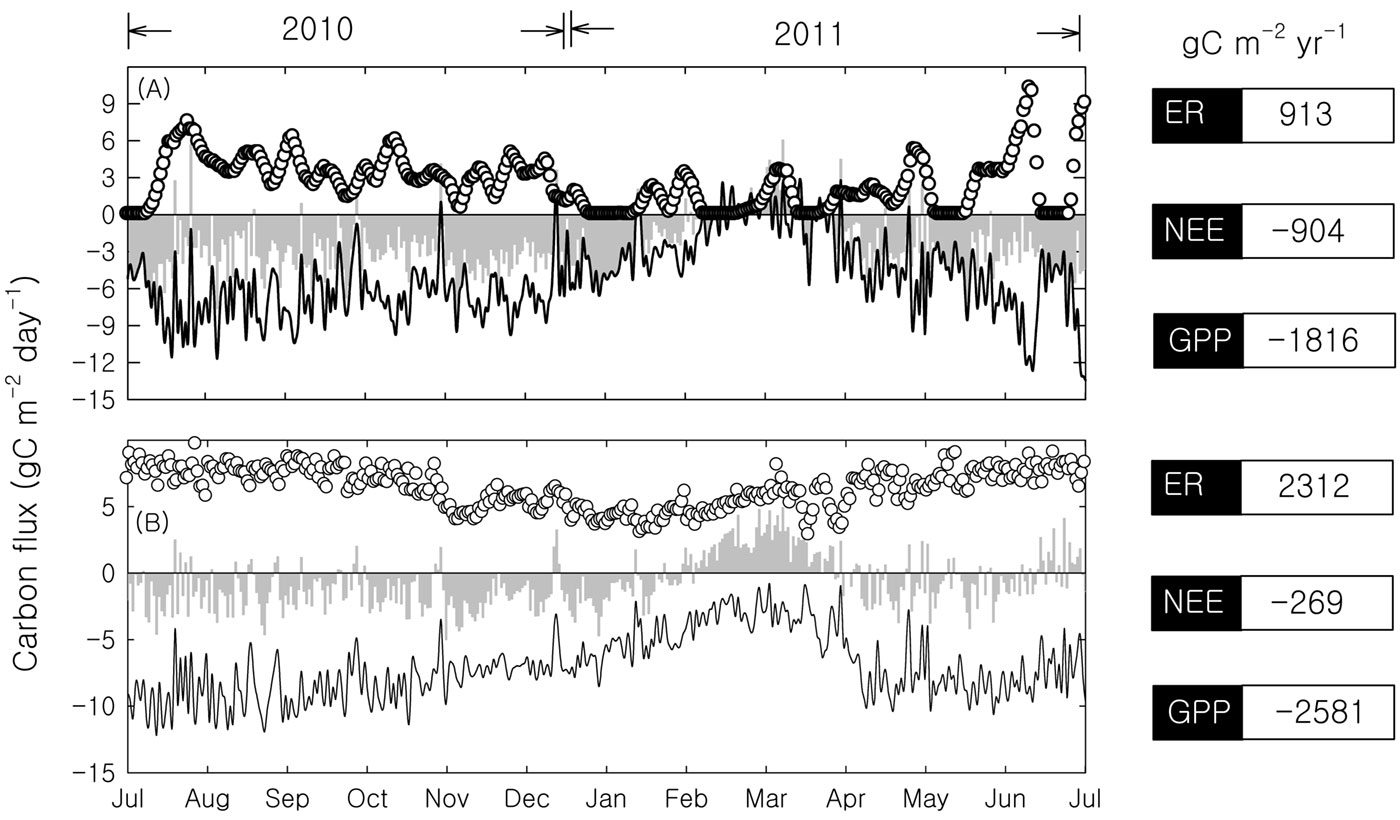
Based on the presented data and according to eqn. 1, NEPc was estimated to be 692 gC m-2 yr-1. The annual dry rubber production in our study area is 112 gC m-2. The carbon content of dry rubber was measured at 88% ([13]). Thus, Prt and NEPc were estimated to be 98 tC ha-1 yr-1 and 790 tC ha-1 yr-1, respectively. Thus the biometric estimation provided a NEP close to the value derived by the FluxNet procedure method (904 gC m-2 yr-1 - Fig. 4A).
Fig. 4 - The carbon flux of the rubber plantation by different data processing procedures. (A): FluxNet procedure method; (B): Neutral atmospheric condition method; (hollow circles): ecosystem respiration (ER); (grey columns): NEE; (black lines): GPP.
To avoid the effects of calm nights and strong winds, the neutral atmospheric condition method has been used as an alternative approach to studying an ecosystem’s carbon balance ([32]). The neutral atmospheric condition method provided a moderate NEE (-269 gC m-2 yr-1) and large GPP (-2.581 gC m-2 yr-1 - Fig. 4B). Thus the application of the neutral atmospheric condition method provided estimates of NEE fairly different from those obtained using both biometric- and FluxNet-based procedures. However, the seasonal pattern derived from the neutral atmospheric condition method makes it interesting for such analyses, if further refined.
Discussion
According to traditional biometric methods, the 33-year-old rubber plantation in our study is a carbon sink (790 gC m-2 yr-1). This value is larger than that obtained from a young Acacia crassicarpa plantation in south China (330 gC m-2 yr-1 - [6]), and significantly lower than estimates from a young Eucalyptus urophylla stand (1.960 gC m-2 yr-1 - [6]). The largest biomass increment (490 gC m-2 yr-1) occurred at 17 years. Assuming that the litterfall input and soil heterotrophic respiration are in a balanced state ([31]), the peak NEPc of the rubber plantation is 1045 gC m-2 yr-1, which is quite a large carbon sink, as suggested by previous studies ([6]). The biometric method cannot provide high temporal resolution for net carbon balances without disturbances. However, it can provide reliable annual carbon balance estimates, which can be used as a baseline value for more accurate studies based on eddy flux data processing.
The closest site to the rubber plantation at which comparable carbon flux measurements have been made is a primary tropical rainforest (approximately 10 km distant). The carbon sink strength (790 g C m-2 yr-1) of the rubber plantation is higher than that of the tropical rainforest (359 gC m-2 yr-1, based on the biometry method - [31]). Fertilizer input in the rubber plantation can increase the biomass accumulation. Over time, this may cause a gradual increase in the strength as carbon sink of the plantation. However, such an increase might potentially be totally or partially offset if soil respiration increased.
Belowground litter input plays an important role in the production estimation. According to previous studies, belowground litter production is reported to be even twice as large as aboveground litterfall ([8]). The actual NEP at our site may be much higher (1200 g C m-2 yr-1). Eddy flux measurements are dependent on several QA/ QC steps, such as u* filtering and gap filling ([20], [29]). Gap filling is often a challenge when eddy covariance datasets are complex ([29]), resulting in NEP estimation based on different methods that are sometimes not very close. In this study, we used data collected in neutral atmospheric conditions (which we call the neutral atmospheric condition method) to fill the data measured under non-neutral atmospheric conditions. The resulting NEE (-2.69 tC ha-1 yr-1) produced by the neutral atmospheric condition method is not close to the value obtained by biometric estimation (-7.90 tC ha-1 yr-1) and by the FluxNet procedure (-9.04 tC ha-1 yr-1). This is possibly related to the fact that the range selected for the neutrality of atmospheric conditions is not within the commonly recognized range. Instead, we do not consider the complete life cycle of the rubber plantation, starting with the deforestation of the previous tropical forest. Most of these data represent the biomass at a certain age without stating actual and maximum trunk height. Available data do contain inherent uncertainties associated with the lack of the complete life cycle. However, the seasonal patterns obtained using the neutral atmospheric condition method provide support for a further refinement of the method, with the aim of its possible future use to derive annual budgets, that should be primarily based on the evaluation of the impact of the different range of the stability index chosen for the application of the method.
Conclusions
According to the biometric estimates and the eddy-flux NEE derived with FluxNet procedure, the ecosystem studied was an important carbon sink, while the neutral atmospheric condition method provided a significantly lower NEE. If we consider the complete life cycle of the rubber plantation, starting from deforestation of the previous tropical forest, the hypothesis of plantations serving as large carbon sinks is not supported by our study. Here, only the carbon balance was examined for large-scale planting of rubber trees. Other important environmental issues, such as biodiversity loss, soil erosion, should be examined in the future.
Acknowledgments
We thank Xiao-Long Bai, Xue-Hai Fei, Jin-Xiang Xiong and Hong-Li Ji for their assistance in the field. This work was supported by Xishuangbanna Station for Tropical Rain Forest Ecosystem Studies (XSTRE), and by the National Science Foundation of China (41001063, 41271056, 41071071, 31200347), the Development Program in Basic Science of China (2010CB833501), the “Strategic Priority Research Program” of the Chinese Academy of Sciences (Grant no. XDA05070303) and the Chinese Academy of Sciences 135program (XTBG-T03).
References
CrossRef | Gscholar
CrossRef | Gscholar
CrossRef | Gscholar
Gscholar
Gscholar
Gscholar
Gscholar
Gscholar
Gscholar
CrossRef | Gscholar
CrossRef | Gscholar
CrossRef | Gscholar
Gscholar
Gscholar
Gscholar
Gscholar
Gscholar
Authors’ Info
Authors’ Affiliation
Zheng-Hong Tan
Yi-Ping Zhang
Li-Qing Sha
Xiao-Bao Deng
Yun Deng
Wen-Jun Zhou
Jun-Fu Zhao
Jun-Bin Zhao
Xiang Zhang
Wei Zhao
Nai-Sh Liang
Key Laboratory of Tropical Forest Ecology, Xishuangbanna Tropical Botanical Garden, Chinese Academy of Sciences, RC-666303 Menglun (China)
Zheng-Hong Tan
Yi-Ping Zhang
Wen-Jun Zhou
Jun-Fu Zhao
Jun-Bin Zhao
Global Change Ecology Group, Xishuangbanna Tropical Botanical Garden, Chinese Academy of Sciences, RC-650223 Kunming (China)
Xiao-Min Sun
Institute of Geographic Sciences and Natural Resources Research, Chinese Academy of Sciences, RC-100101 Beijing (China)
Corresponding author
Paper Info
Citation
Song Q-H, Tan Z-H, Zhang Y-P, Sha L-Q, Deng X-B, Deng Y, Zhou W-J, Zhao J-F, Zhao J-B, Zhang X, Zhao W, Yu G-R, Sun X-M, Liang N-S (2014). Do the rubber plantations in tropical China act as large carbon sinks?. iForest 7: 42-47. - doi: 10.3832/ifor0891-007
Academic Editor
Giorgio Matteucci
Paper history
Received: Nov 15, 2012
Accepted: Aug 30, 2013
First online: Oct 21, 2013
Publication Date: Feb 03, 2014
Publication Time: 1.73 months
Copyright Information
© SISEF - The Italian Society of Silviculture and Forest Ecology 2014
Open Access
This article is distributed under the terms of the Creative Commons Attribution-Non Commercial 4.0 International (https://creativecommons.org/licenses/by-nc/4.0/), which permits unrestricted use, distribution, and reproduction in any medium, provided you give appropriate credit to the original author(s) and the source, provide a link to the Creative Commons license, and indicate if changes were made.
Web Metrics
Breakdown by View Type
Article Usage
Total Article Views: 62003
(from publication date up to now)
Breakdown by View Type
HTML Page Views: 49834
Abstract Page Views: 5035
PDF Downloads: 5481
Citation/Reference Downloads: 37
XML Downloads: 1616
Web Metrics
Days since publication: 4474
Overall contacts: 62003
Avg. contacts per week: 97.01
Article Citations
Article citations are based on data periodically collected from the Clarivate Web of Science web site
(last update: Mar 2025)
Total number of cites (since 2014): 31
Average cites per year: 2.38
Publication Metrics
by Dimensions ©
Articles citing this article
List of the papers citing this article based on CrossRef Cited-by.
Related Contents
iForest Similar Articles
Research Articles
Quantifying forest net primary production: combining eddy flux, inventory and metabolic theory
vol. 10, pp. 475-482 (online: 12 April 2017)
Research Articles
Soil C:N stoichiometry controls carbon sink partitioning between above-ground tree biomass and soil organic matter in high fertility forests
vol. 8, pp. 195-206 (online: 26 August 2014)
Research Articles
Assessing the carbon sink of afforestation with the Carbon Budget Model at the country level: an example for Italy
vol. 8, pp. 410-421 (online: 02 October 2014)
Review Papers
Carbon neutrality of forest biomass for bioenergy: a scoping review
vol. 16, pp. 70-77 (online: 05 March 2023)
Research Articles
Estimating changes in soil organic carbon storage due to land use changes using a modified calculation method
vol. 8, pp. 45-52 (online: 17 June 2014)
Research Articles
An approach to estimate carbon stocks change in forest carbon pools under the UNFCCC: the Italian case
vol. 1, pp. 86-95 (online: 20 May 2008)
Review Papers
Monitoring the effects of air pollution on forest condition in Europe: is crown defoliation an adequate indicator?
vol. 3, pp. 86-88 (online: 15 July 2010)
Research Articles
Carbon and water vapor balance in a subtropical pine plantation
vol. 9, pp. 736-742 (online: 25 May 2016)
Review Papers
Comparative assessment for biogenic carbon accounting methods in carbon footprint of products: a review study for construction materials based on forest products
vol. 10, pp. 815-823 (online: 25 September 2017)
Research Articles
Tissue carbon concentration of 175 Mexican forest species
vol. 10, pp. 754-758 (online: 05 August 2017)

