
Soil CO2 efflux in uneven-aged and even-aged Norway spruce stands in southern Finland
iForest - Biogeosciences and Forestry, Volume 11, Issue 6, Pages 705-712 (2018)
doi: https://doi.org/10.3832/ifor2658-011
Published: Nov 06, 2018 - Copyright © 2018 SISEF
Research Articles
Abstract
Even-aged forests usually act as carbon sinks during most of their rotation. However, after clearcut they become sources of carbon for a period of several years. Applying uneven-aged forest management with selective cuttings will maintain tree cover and reduce the environmental impact on forest floor. The aim of this study was to compare the soil CO2 efflux between uneven-aged and even-aged Norway spruce stands with similar site properties, to investigate the effect of management practices on soil CO2 efflux and its possible correlation with soil environmental and chemical properties. We measured soil CO2 efflux in even- and uneven-aged Norway spruce stands (Picea abies [L.] Karst) in southern Finland during the summer of 2013 using closed chamber method on fixed measuring points. The study included two uneven-aged stands and two even-aged stands (a clearcut site and a mature even-aged stand). Soil moisture and soil temperature were measured at the same time as soil CO2 efflux. Soil cores were collected from the topsoil of each study plot to determine soil carbon and nitrogen concentrations. Mean soil CO2 efflux through the summer was highest in the clearcut plot (0.367 mg m-2 s-1) followed by the uneven-aged stands (0.298 and 0.257 mg m-2 s-1, respectively) and the smallest fluxes were measured in the mature even-aged stand (0.224 mg m-2 s-1). There was no statistically significant difference in soil CO2 efflux between the even- and uneven-aged stands of the same site fertility. Even- and uneven-aged stands did not differ significantly in soil moisture or soil temperature. Soil CO2 efflux increased steadily with soil temperature, whereas increasing soil moisture considerably increased soil CO2 efflux at lower moisture levels but only moderately at higher soil moisture levels. Soil carbon and nitrogen concentration did not differ between the study plots of the same fertility. Uneven-aged structure forestry did not prevent the increase in soil CO2 efflux after cuttings. However, the large variation in soil CO2 efflux rates within the uneven-aged stands suggests that the stand level CO2 efflux can be controlled with the intensity of the cutting.
Keywords
Uneven-aged Forest Structure, Even-aged Forest Structure, Soil CO2 Efflux, Norway spruce
Introduction
Around 30% of all carbon in terrestrial ecosystems is found in the boreal zone ([6]) and approximately two thirds of all carbon stored in terrestrial ecosystems is underground ([27], [13]). The amount of soil carbon depends on litter production and decomposition rate ([23]). Clearcuts used in conventional even-aged forest management bring an abrupt change to soil microclimate. Clearcut sites often act as net sources of carbon for several years ([18]) because litter production and litter decomposition rates increase after the clearcut and the soil preparation that follows (such as mounding or harrowing), tends to increase soil temperature and have an influence on soil moisture content ([36], [17]). This effect can last for several years until the uptake of carbon dioxide by the next generation of trees and the ground vegetation exceeds the amount of carbon released from the decomposition of soil organic matter ([18]).
By virtue of avoiding clearcuts and the related disturbance to forest soil, uneven-aged forestry could help to store more carbon in the soil than forests under conventional even-aged management ([41]). In northern Europe, however, data about the effect of uneven-aged forestry on soil carbon dynamics is sparse because most forests are managed following even-aged silviculture. In a recent review, Lundqvist ([24]) concluded that selection cuttings have somewhat reduced the volume growth of Norway spruce stands in Fenno-Scandia if compared with even-aged stands, but similar comprehensive comparisons have not been carried out on carbon sequestration. However, Nilsen & Strand ([26]) analysed data from an 81-year long comparative experiment of Norway spruce management in Norway to assess the effect of management on the carbon sequestration in the stands, finding that the even-aged stand contained more carbon both in the vegetation and soil than the uneven-aged stand. However, for a representative assessment of carbon sequestration or productivity, an uneven-aged stand close to steady state should be compared with an average over the age distribution of even-aged stands, not just with one stand at a selected age ([2]).
Litter production is important for soil carbon accumulation, and it largely depends on the amount of stand biomass and its allocation to foliage and fine roots that have the fastest turnover rates. This will likely vary between even-aged and uneven-aged stands ([26], [24]). An important factor that may be causing differences in litter decomposition is the more open stand structure of uneven-aged stands, typically consisting of closed-canopy and gap patches. Firstly, the ground vegetation varies between light and shade patches within the stand, causing variation in litter quality. Secondly, in boreal ecosystems soil decomposers are likely to be more active in the light patches where soil temperature and moisture are higher than in shaded patches ([36], [17]).
Other factors possibly causing variability in soil CO2 efflux include the availability of nitrogen to the decomposers ([31]), the total amount of carbon in the soil ([20]), the carbon to nitrogen (C/N) ratio, soil pH, as well as other soil chemical and physical properties ([44]). These factors have been found to correlate strongly with the type of ground vegetation, which is the basis for the standard site type classification used in Finland ([39]). Stands representing the same site type in this classification would not differ decisively in the basic soil characteristics that influence soil CO2 efflux.
In Finland, the general interest towards continuous cover forestry has recently increased with the new forest law (1308/ 2013, par. 2 - [9]), under which uneven-aged managements such as selective and small-gap cuttings have once again become possible management practices. In the light of new research results ([37], [38], [28]), uneven-aged forestry can lead to positive economic outcomes, but its effects on the carbon balance of forest ecosystems still remain largely unknown.
We focus on Norway spruce (Picea abies Karst.) stands here, because in Finland it is the most natural choice for uneven-aged forestry, as it is an economically important shade-tolerant tree species. Norway spruce naturally regenerates in the understorey of stand with low standing volume ([21]), which is beneficial for the proper functioning of an uneven-aged stand. Spruce stands also have a tendency to naturally develop towards uneven-aged structure, even if the stand started as an even-aged stand. It is possible to use more light demanding species like Scots pine (Pinus sylvestris L.) with sites of special properties, such as hillsides or stands with low fertility, but in Finland spruce is the only species with large-scale economic significance in terms of uneven-aged forestry.
The aim of this study was to investigate the extent to which uneven-aged spruce stands differ from even-aged spruce stands for the carbon dioxide released from the forest soil, and to study the factors that explain these differences. Our hypotheses were:
- The rate of soil CO2 efflux in Norway spruce stands is primarily controlled by soil temperature and moisture. Thus, management practices that modify these environmental conditions will affect soil CO2 efflux.
- Increasing tree cover reduces both soil temperature and soil moisture and thus the soil CO2 efflux.
- Increased soil temperature and soil moisture will lead to increased soil CO2 efflux in clearcuts and in gap areas in uneven-aged stands.
- Soil carbon and the C/N ratio will be greater in uneven-aged stands than in even-aged stands.
To test the hypotheses, we measured soil CO2 efflux, soil moisture and soil temperature in two even-aged (clearcut site and closed canopy) and two uneven-aged spruce stands during the growing season. We also evaluated the total soil carbon and nitrogen and the C/N ratio of the stands.
Material and methods
Study sites and experimental design
The sites were located in Latokartanon palsta in Lapinjärvi, southern Finland (60° 40′ N, 26° 6′ E). The study plots consisted of two uneven-aged Norway spruce stands under selective cuttings management and two even-aged stands under traditional rotation based management. The uneven-aged stands were: UA1, a spruce stand with a mix of aspen (Populus tremula L.) on herb-rich moist clay soil with high fertility, classified as Pulmonaria Viola type (PuViT -[5], [11]); and UA2, a spruce stand on mesic sandy soil with medium fertility, classified as Myrtillus type (MT - [5]). The uneven-aged study plots were established on natural-like stands (no previous regeneration treatments or known thinnings) of uneven age-distribution by the Natural Resource Institute Finland in 1991 with cuttings done in 2012 for UA1 and 1996 and 2012 for UA2. The basal areas of UA1 and UA2 were recorded after a selective cutting in 2012 at 15 m2 ha-1 and 12 m2 ha-1, respectively (Tab. 1.). The even-aged sites were: EA1, a clearcut site (previously spruce stand) on herb-rich moist clay soil with high fertility, classified as PuViT; and EA2, a mature spruce stand with closed canopy on mesic sandy soil with medium fertility, classified as MT and a basal area of 38 m2 ha-1 in 2012.
Tab. 1 - Basal area, tree height, diameter and site type of the four study plots. For the uneven-aged stands (UA1 and UA2), the basal area is given both after and (before) the selective cutting done in 2012.
| Variable | UA1 | UA2 | EA1 | EA2 |
|---|---|---|---|---|
| Basal area (m2) | 15 (27.7) | 12 (22.2) | 0 | 38 |
| Dominant tree height (m) | 22.7 | 24.2 | 0 | 24.8 |
| Median height (m) | 8.7 | 4.7 | 0 | 23 |
| Median diameter (cm) | 8.1 | 4.9 | 0 | 21 |
| Site type | Herb-rich | Mesic | Herb-rich | Mesic |
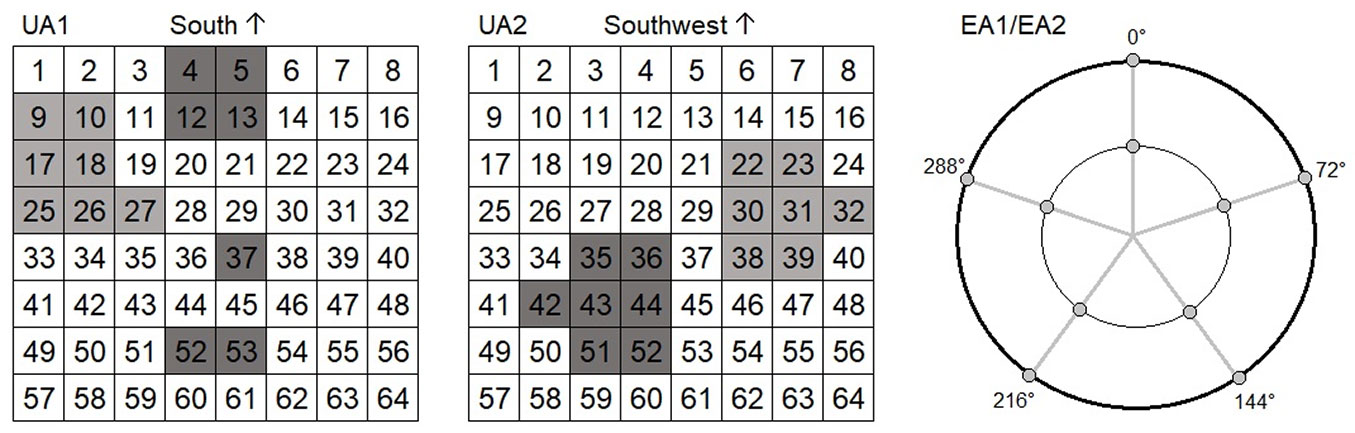
For the soil CO2 efflux measurements, experimental plots were delineated at the study sites. Because of the greater environmental variability at the uneven-aged sites, the uneven-aged plots were larger in area and defined as squares with a side of 40 meters, while the even-aged plots were circular with an 8-meter radius (Fig. 1). The uneven-aged stand was further divided into gap and closed-canopy areas, where soil CO2 efflux was measured on seven gap and seven closed-canopy points placed on a grid of 5 × 5 m (Fig. 1a). In the even-aged plots, we selected 10 points from each, arranged in two concentric circles at even intervals (Fig. 1b).
Fig. 1 - Placements of the measuring points (collars) in the study plots. The uneven-aged plots were 40 × 40 m square plots that were divided in 64 subplots. For the purpose of this study, 14 collars were planted in open and wooded subplots to create seven gap (light grey) and seven closed canopy points (dark grey). The even-aged plots were circular plots with a radius of eight meters (0° is north). Five collars were planted on two circles four and eight meters from the plot centre.
Soil CO2 efflux measurements
The soil CO2 efflux measuring points were prepared by fitting a piece of 200 mm diameter PVC-pipe on the forest floor to work as a collar for the chamber. The pipe was placed in the organic layer of the soil and insulated with fine sand from the outside. The vegetation inside the collar was left mostly intact, only larger plants that would have hindered the fitting of the chamber on the collar were cut regularly.
We used a closed dark chamber ([30]) to measure the soil CO2 efflux. The chamber (200 mm in diameter and 300 mm in height) was equipped with a small electric fan inside and was covered with aluminium foil to negate temperature changes from sunlight. A handheld logger (MI70® 2.05, Vaisala, Helsinki, Finland) was used with a CO2 probe (Vaisala GMP343® 2.10) to measure the carbon dioxide concentration. At individual measuring points the chamber was placed air-tight onto the collar with a fan to ensure the proper mixing of the air inside the chamber. The starting concentration of carbon dioxide in the chamber was checked for major inconsistencies and the measuring itself was monitored to ensure there were no leaks. Another probe (Vaisala HMP70Bc® 3.09) in the chamber measured air temperature and relative humidity.
The duration of an individual soil CO2 efflux measurement was five minutes with the logger recording values every 15 seconds, yielding 20 values for CO2 concentration, air temperature and air moisture. Data was collected every week from May 20th to August 27th, with the exception of week 31. There were four missing measuring points from both UA1 and UA2 at the beginning of the experiment due to delays in the setup of the study plots. There were also seven missing measurements from the EA2 plot in week 28 due to equipment failure. The measurements were normally taken between 11:00 am and 03:00 pm. The order in which the study plots were measured was rotated to counter the possible effects of different measuring times. The data was recorded on the logger and transferred to computer for data analysis. With the missing values, the 48 measuring points yielded a total of 657 flux measurements during the summer.
Soil temperature was also measured simultaneously next to the collar using a commercial digital thermistor meter. Soil moisture was measured at two locations close to each collar, using a Theta probe ML2x sensor (Delta-T Devices Ltd., Cambridge, UK) that was calibrated for organic soil. The probes were placed 50-100 mm into the soil, depending on the thickness of the moss and humus layer so that the probe reached the mineral soil.
Soil carbon and nitrogen measurements
We collected soil core samples from the study plots to determine the stocks of carbon and nitrogen in the soil, as well as the C/N ratio. Thirty core samples were collected from the uneven-aged plots (UA1 and UA2) and 20 core samples from the even-aged plots (EA2 and EA1). Damaged samples were dropped and after processing there were 30, 28, 17 and 18 samples for UA1, UA2, EA2 and EA1, respectively. The core samples were cylindrical with a diameter of 4.3 cm and a length of 27 cm. The core samples were divided into litter, humus, upper mineral and lower mineral layers. The different layers were measured and weighed and the C and N concentrations were measured using an elemental analyser (Vario MAX® analyser, Analysensysteme GmbH, Langenselbold, Germany).
It should also be noted that the sites were not divided evenly in gap- and closed canopy points. The actual number of gap- and closed canopy points for the uneven-aged study plots were 41% and 59% for UA1 and 26% and 74% for UA2, respectively. To estimate the actual difference between the uneven-aged sites and the even-aged sites, we must consider the study plot as a whole, rather than just the original measuring points. This was done by using weekly soil CO2 flux averages of the gap and closed canopy points of the uneven-aged study plots and weighing them according to the proportions of the gap and closed canopy points. The clearcut site (EA1) was considered to only have gap points and the mature even-aged stand (EA2) only closed canopy points.
Statistical analyses
To determine the differences in soil CO2 efflux between the study plots we used one-way analysis of variance with Tukey’s post-hoc test for pairwise comparison ([43]). Weekly averages weighted by the proportion of gap and closed canopy points for the uneven-aged study plots and the weekly averages for the even-aged plots were used in the analysis with a 5 % significance level. The analysis was done with the R statistical analysis software ([34]), mixed models were calculated using the “lme4” package ([1]). For the purpose of this study, the most interesting thing was the differences in CO2 efflux between the plots of the same site class (UA1 vs. EA1 and UA2 vs. EA2).
We used simple one-way analysis of variance with F-test to determine the differences in soil CO2 fluxes between the gap and closed canopy points within the uneven-aged plots and for the differences in soil carbon and nitrogen concentrations between different management practices on plots of the same site type (eqn. 1):
where yi,j is the mean for the collar i with treatment j being either gap or closed canopy, αj is the impact of the treatment (gap or closed canopy), μ is the grand mean and εi,j is the error. When comparing soil carbon and nitrogen yi,j is the mean for the plot i with management practice j (either uneven-aged or even-aged), μ is the grand mean, αj is the impact factor of the management practice and εi,j is the error term.
We also used simple one-way analysis of variance with F-test to determine the differences in the soil temperature and soil moisture between all the plots (eqn. 2):
where yi,j,k is the value of the CO2 efflux for the plot k on the collar j in week i, while αk is the impact of plot, μ is the grand mean and εi,j,k is the error factor.
Lastly, we tried to identify all the factors that affect soil CO2 efflux and possibly measure their impact. We studied this with a linear mixed model. Firstly, we considered as fixed effects soil temperature and soil moisture on soil CO2 efflux, the influence of which is well documented ([33], [14], [15]). The random effects were assumed to be caused by the plot, subplot (gap or closed canopy) and/or collar (eqn. 3):
where yk,i is the CO2 efflux for collar k in week i, xT;k,i and xM;k,i are temperature-based and moisture-based fixed effect variables (measured values or their non-linear transformations), respectively, for collar k in week i, b1 and b2 are the respective fixed effects parameters, up, us and uk are random effects due to plot, subplot and collar, b0 is the intercept and εi,j,k is the residual error.
Secondly, we tested for site fertility (F) and management practice (S) as additional fixed effects (eqn. 4):
where F is site fertility (F = 0 for herb-rich sites and F = 1 for mesic sites), S is management practice (S = 0 for even-aged and S = 1 for uneven-aged) and other symbols are as in eqn. 3.
Testing the effects was done using R-studio ([35]) with linear mixed effect models. The model was also tested with site structure and/or site fertility as fixed effects with and without soil moisture and soil temperature as fixed effects.
Results
Soil CO2 efflux
Soil CO2 efflux varied from 0.077 mg m-2 s-1 to 0.645 mg m-2 s-1 (Fig. 2). The highest mean soil CO2 efflux was measured on the clearcut site (EA1): 0.367 mg m-2 s-1. For the uneven aged stands UA1 and UA2, the mean fluxes were 0.298 and 0.257 mg m-2 s-1, respectively. The EA2-plot had the smallest soil CO2 efflux, with an average of 0.224 mg m-2 s-1.
Fig. 2 - The development of the mean CO2 efflux through the summer in different study plots. The uneven-aged stands (UA1 and UA2) are divided to closed canopy and gap points.
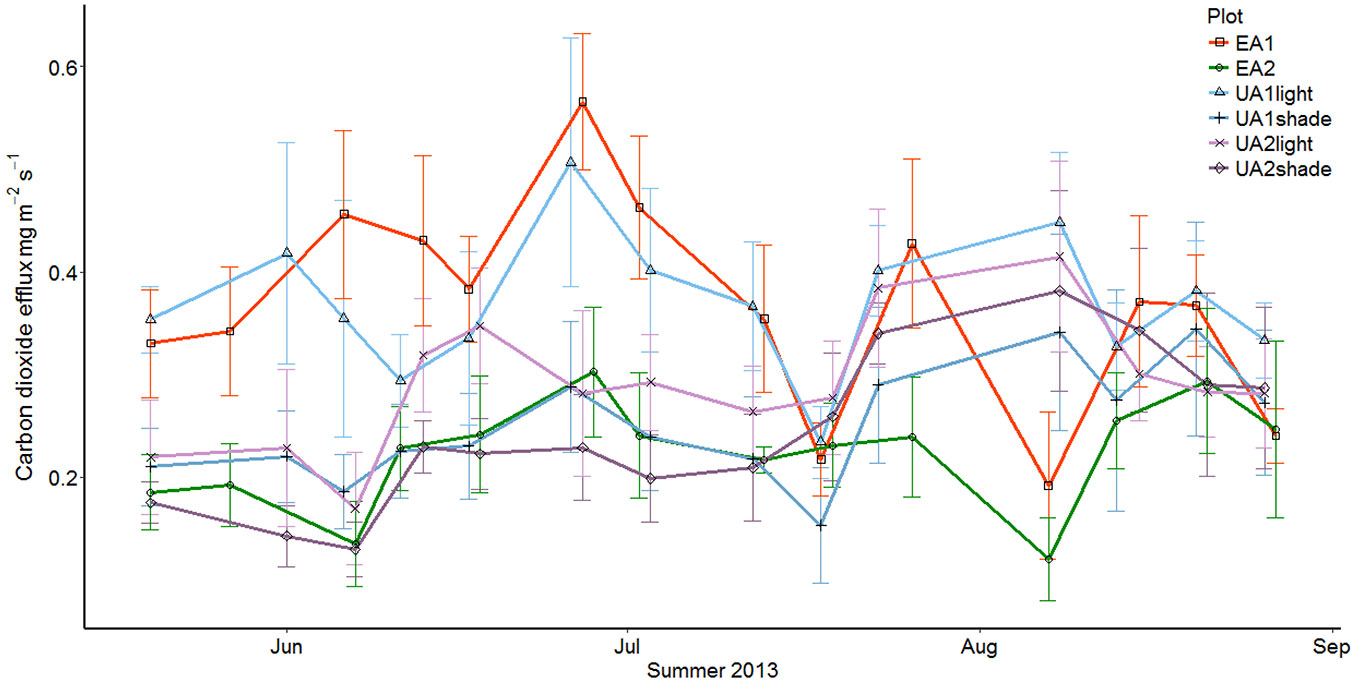
The statistical analysis did not yield significant differences between the relevant study plot pairs (Tab. S1 in Supplementary material), although the pair UA1-EA1 was close to the 5% significance level (p-value = 0.0676). The lack of statistically significant difference between UA2 and EA2 is to be expected, since the coverage of closed canopy points in UA2 was 76%, which means that the amount of tree cover in UA2 and EA2 did not differ much, though their structures did.
Gap and closed canopy points
There was a clear difference in soil CO2 efflux rates within the uneven-aged plots between the gap points and the closed canopy points. The mean soil CO2 efflux was clearly larger on gap points than in the closed canopy. The mean CO2 efflux for the UA1 gap points was almost identical to the EA1 mean flux: 0.368 mg m-2 s-1 and 0.367 mg m-2 s-1, respectively. The fluxes at the closed canopy points were surprisingly close between the two uneven aged plots: 0.250 mg m-2 s-1 for the more fertile UA1 and 0.246 mg m-2 s-1 for the mesic UA2. The gap points of UA2 were considerably lower by average than those of the UA1 were, as the mean carbon dioxide flux was only 0.290 mg m-2 s-1.
The difference between gap and closed canopy points within the site was clearer in UA1 than in UA2 (Fig. 2). One-way ANOVA showed statistically significant difference between gap and closed canopy points for UA1 (p=0.0026) but not for UA2 (p=0.096).
Soil environmental conditions
The mean soil moisture content was greater in the uneven-aged sites than in the even-aged sites with the corresponding site-class. The mean average soil moisture was 31.21% and 28.75% for UA1 and EA1, respectively, and 21.13% and 16.62% for UA2 and EA2. It is worth noting that the differences in soil moisture between the different sites varied throughout the summer. Stands of the same site-class were very close to one another in the spring and early summer, but by the end of the summer, the uneven-aged stands had a higher soil moisture content (Fig. 3). In the case of UA2 and EA2, this can be explained by the decreasing uptake of water on the UA2, when the annual herbs and weeds growing on the gap spots started to senesce. This should be true for the EA1 site as well, but it seems that for the clearcut site the lack of tree cover had a much heavier impact on the soil moisture content. This can be seen as more dramatic changes in soil moisture throughout the summer.
Fig. 3 - The development of soil moisture percentage throughout the summer. EA1 and UA1 stands are on clay soils, while UA2 and EA2 are on sandy soils. The uneven-aged stands are divided to closed canopy and gap points.
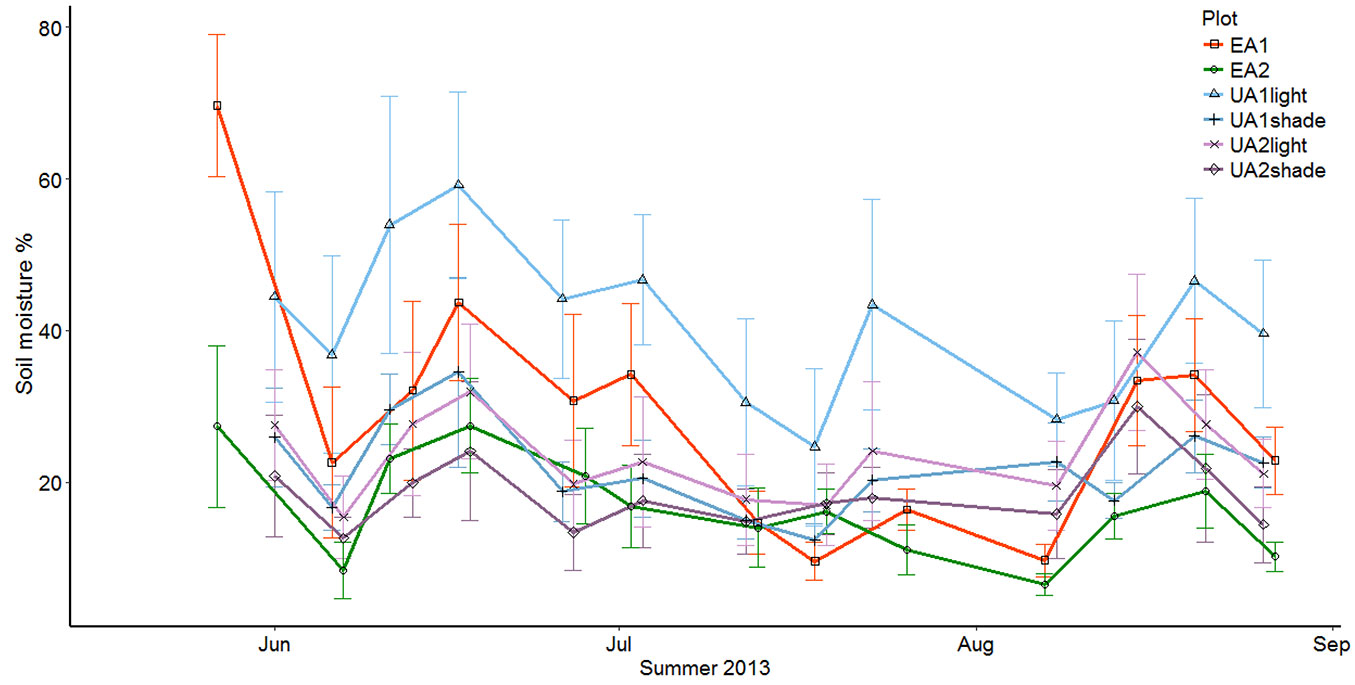
To compare the differences between the uneven-aged and even-aged structured stands of the same site class, we used a simple one-way analysis of variance (ANOVA) on the average weekly values (n=14), but found no statistically significant difference (p = 0.62 for UA1 vs. EA1, p = 0.07 for UA2 vs. EA2). However, since there was a large variation between the different measuring points (collars) inside the study plots, it seemed imperative to compare the plots by using the collar averages where all measurement times were pooled (n=14 for the uneven-aged plots and n=10 for the even-aged plots). This yielded lower p-values (p = 0.55 for UA1 vs. EA1, and p = 0.049 for UA2 vs. EA2),the latter indicating a statistically significant difference.
Mean soil temperature varied between 10 and 19 °C. The uneven-aged stands UA1 and UA2 were fairly close to each other with 14.23 °C and 13.96 °C, respectively, whereas the soil on the clearcut site (EA1) was the warmest with 14.65 °C and the soil on the mature even-aged stand (EA2) was the coolest with 12.96 °C. This shows that forest soil temperature was, at least partially dependent on the tree cover. All sites followed the same trend throughout the summer and there were no notable differences in temperature between sites (Fig. 4).
Fig. 4 - The development of soil temperature (°C) throughout the summer. The uneven-aged stands are divided to closed canopy and gap points.
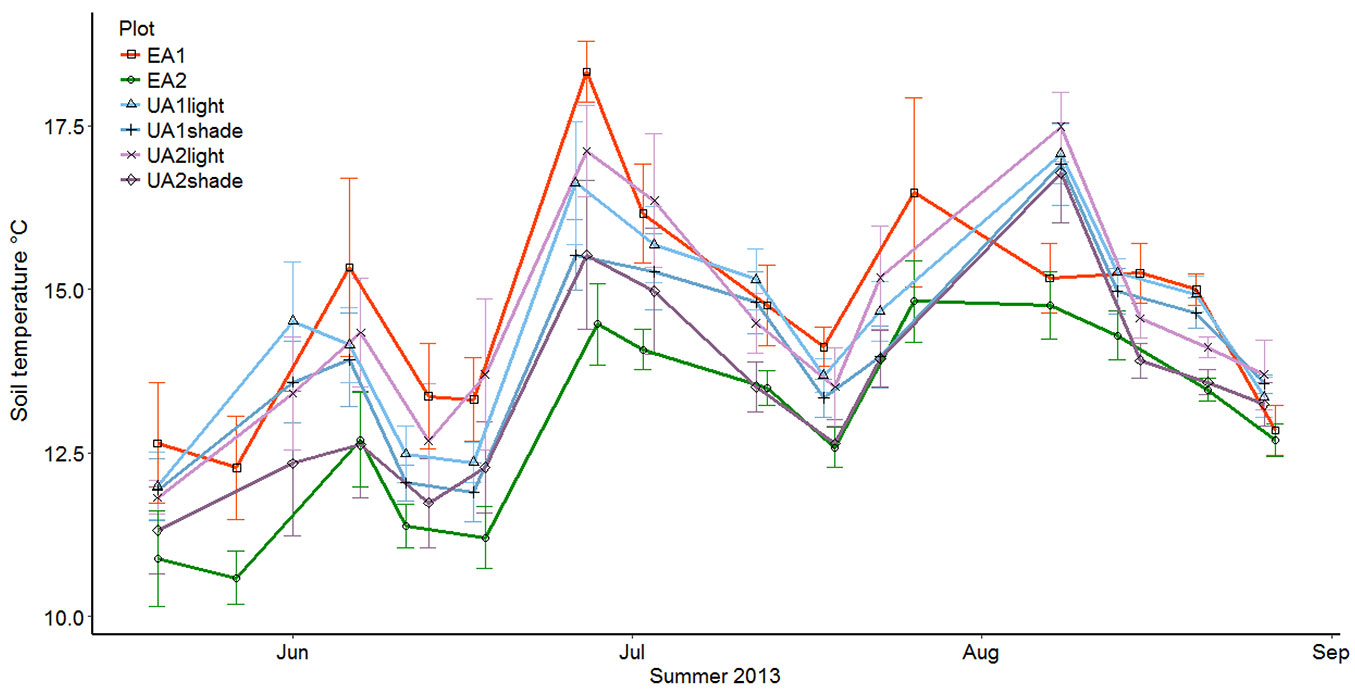
Like soil moisture, the effect of the two management practices on soil temperature was tested with a simple one-way analysis of variance. When using the weekly averages of the plots (n=14) no statistically significant differences could be detected between the plot pairs (p = 0.49 for UA1 vs. EA1, and p = 0.09 for UA2 vs. EA2). When using weekly averages for each collar (n=14 for the uneven-aged plots and n=10 for the even-aged plots) statistically significant difference could be detected between both pairs of sites (p = 0.02 for UA1 vs. EA1, and p = 0.0002 for UA2 vs. EA2). These results mean that the range of temporal variability was similar within the pairs but the overall levels differed significantly, when the temporal pattern was taken into account.
Soil chemical properties
The fertile sites (UA1 and EA1) showed higher soil carbon concentration and considerably higher nitrogen concentration than the mesic sites (UA2 and EA2 - Fig. 5, Tab. 2). There was no statistically significant difference in the amount of carbon or the amount of nitrogen between the study plots of the same site type. P-values for UA1 and EA1 were 0.075 and 0.697, and for UA2 and EA2 0.798 and 0.529 for carbon and nitrogen, respectively. However, the difference between UA1 and UA2 was significant for both carbon and nitrogen (0.005 and 4.63E-08) which suggests that the soil carbon and nitrogen concentrations were not determined by management practises, but with site type. The mean carbon and nitrogen amounts are given in Tab. 2.
Fig. 5 - Soil carbon and nitrogen amounts (kg m-2) as calculated with the 270 mm core samples. The amounts of carbon and nitrogen and the subsequent C/N-ratio are determined by the site type rather than the chosen management practise.
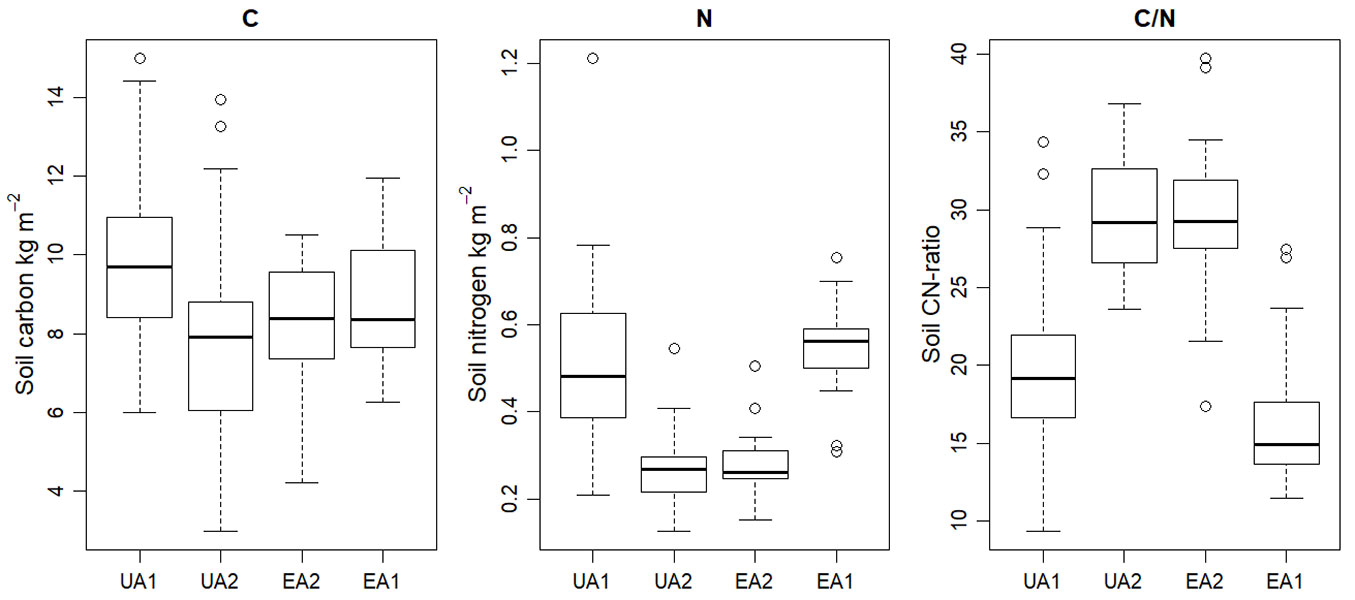
Tab. 2 - Soil carbon and nitrogen in organic and mineral layers. “Org” includes litter and humus layers and “Min” the mineral layers to the depth of 270 mm. C and N values are given in kg m-2 and CN represents the C/N ratio.
| Variable | UA1 | UA2 | EA2 | EA1 |
|---|---|---|---|---|
| Org C | 2.335 | 2.587 | 2.398 | 2.252 |
| Org N | 0.1 | 0.089 | 0.084 | 0.095 |
| Org CN | 23.31 | 29.178 | 28.387 | 23.678 |
| Min C | 7.334 | 5.375 | 5.737 | 6.19 |
| Min N | 0.423 | 0.182 | 0.202 | 0.45 |
| Min CN | 17.343 | 29.544 | 28.369 | 13.759 |
| Total C | 9.668 | 7.962 | 8.134 | 8.442 |
| Total N | 0.523 | 0.271 | 0.287 | 0.545 |
The effect of soil moisture and soil temperature on soil CO2 efflux
The relationship between soil respiration and soil temperature was in the form of yF = a·xT + b, and between soil respiration and soil moisture it was yF = a·ln(xM) + b, where yF is the soil CO2 flux, a and b are parameters (Tab. S2 in Supplementary material) and xT and xM are measured values of soil temperature and soil moisture. Because of these relationships, we chose to use temperature and the logarithmic transformation of soil moisture as the fixed effects variables in the regression analysis (eqn. 3 and eqn. 4).
As expected, soil temperature and soil moisture were statistically significant factors and including both of them improved the fit of the model. However, the addition of management practice and site fertility did not increase the goodness of fit of the model (Tab. S3, Tab. S4). This was to be expected, as the effect of management practice and fertility were already represented in the plot factor. Management practice became a significant factor when the plot factor was excluded from the model, but this did not improve the overall fit of the model.
The variation inside the plots was much larger than that between the plots (Tab. S4). This suggests that the small-scale differences in forest floor and soil can be more important drivers of soil CO2 efflux than the stand structure, site fertility or light conditions.
Discussion
The present study aimed to investigate how uneven-aged forestry and conventional even-aged forestry differ in soil CO2 efflux and ultimately soil carbon turnover. It can be argued that uneven-aged forestry avoids large disturbances and does, therefore, reduce carbon losses through soil CO2 efflux. Soil disturbances are widely known to cause carbon losses in agriculture ([7]). However, we found complex interactions of site fertility, stand age and canopy cover on soil CO2 efflux, showing that reductions of this flux due to uneven-aged silviculture are not evident, while our research emphasizes the potential role of canopy gaps on soil carbon efflux.
The main drivers of soil CO2 efflux were soil temperature and soil moisture. Variations of these environmental factors were also responsible for most of the differences between site types, management practises as well as for differences between gap and closed canopy subplots. On the other hand, the higher levels of soil CO2 efflux in the two more fertile sites (UA1 and EA1) were consistent with the higher soil carbon stocks in those sites and can be interpreted as more available carbon leading to higher decomposition rates and thus higher levels of respiration ([20]). The soil CO2 efflux was higher for the EA1 than for the UA1 site, while the soil carbon concentration was lower in EA1 (Tab. 2), suggesting that the added harvest residues from the clearcut or the soil mounding have accelerated soil CO2 efflux. However, this difference was not statistically significant.
Soil CO2 efflux
The gap points in UA1 and the clearcut site (EA1) had almost equal soil CO2 efflux rates even though the gaps created in UA1 were small and the canopy cover mostly intact. This indicates that increases in soil CO2 efflux that occur after a clearcut can also be observed after selective cutting under uneven-aged management. However, the difference between the fertile sites (UA1 and EA1) was very close of being statistically significant (p-value = 0.0676). The large difference in soil CO2 efflux between the gap and closed canopy points suggests that it might be possible to manage uneven-aged forests to have a significantly smaller soil CO2 efflux than in a clearcut site by limiting the size of canopy gaps.
On the other hand, it is also worth noticing that soil CO2 efflux from the closed canopy points of the uneven-aged stands were rather similar to the results of the mature even aged forest (EA2). As stated before the mean soil CO2 efflux for the EA2 was 0.224 mg m-2 s-1, whereas the closed canopy points of UA1 and UA2 were 0.250 mg m-2 s-1 and 0.246 mg m-2 s-1, respectively. Although the closed canopy points of the uneven-aged stands were distinctly larger than those of the EA2, they were not statistically different. This suggests that the areas in uneven-aged stand that retain tree cover, may have as small soil CO2 efflux as an even-aged stand with full tree cover.
Environmental control on soil CO2 efflux
In the light of the data it seems safe to say that the increase of soil moisture or soil temperature both increase soil CO2 efflux from the forest soil, as suggested by the literature ([33], [14], [15]). Soil respiration increases linearly as soil temperature rises, whereas the relationship between the CO2 flux and soil moisture is non-linear (Fig. S1 in Supplementary material).
As stated before, there were no statistically significant differences in soil moisture or soil temperature between the study plots of the same site type, when using weekly averages. When using the collar averages the difference was significant for soil temperature with both plot pairs and significant with UA2 and EA2 for soil moisture. It seems better to use the collar averages for the comparison so that we can better take into account the small-scale variation within the plot. Stones and large roots affect the soil moisture content and the abundance and structure of the ground vegetation affects soil temperature to some degree ([8]).
The difference in soil temperature suggests that the remaining tree cover can affect soil temperature. There was not a notable difference in soil moisture between UA1 and EA1, which suggests that the soil itself is a more important factor affecting soil moisture than the structure of the tree cover. UA1 and EA1 were both on clay soil, which retains moisture better than sandy soils in UA2 and EA2, where soil moisture mean was also lower. Kasurinen et al. ([16]) compared the evapotranspiration of disturbed and undisturbed sites of boreal forests. They suggest that evapotranspiration from clearcut sites is smaller than from forested sites, however, the difference is small. There is also the possibility that the deeper rooting depth of the forested sites adjust the surface water contents to be more equal between sites.
Nevertheless, there were clear differences in the temporal course of soil moisture during the summer. Soil moisture values in study plots of the same site type were very similar during spring and early summer, but after midsummer they tended to diverge, and the differences between the plots became more apparent. There are several factors that may contribute to this. Firstly, the difference in soil moisture between the UA1 and EA1, beginning in July (Fig. 3) was most likely due to the lack of tree cover for the clearcut site (EA1) which causes the soil to dry in the midsummer heat. Toward the end of the summer when precipitation increases the two sites once again showed similar moisture contents. The difference in soil moisture that occurred in July between UA2 and EA2 is more difficult to explain. It is possible that the abundant ground vegetation found in UA2 gap points could affect the difference. The ground vegetation uses the available water in early summer and thus with the remaining tree cover it could have kept the soil moisture at the same level as in EA2 with the full tree cover. After midsummer when the annual herbs and grasses begun to wither, the water consumption dropped in UA2 whereas in EA2 the water consumption continued as before. It is also possible that the thick moss-layer in EA2 absorbed part of the moisture in the dryer summer months ([40]), as the soil moisture was measured from the top of the mineral soil.
Soil carbon and nitrogen pools
The pools of soil carbon in the sites was consistent with an extensive study comparing soil carbon in different site types across Finland ([22]). They reported that the mean soil carbon content (down to 1 m) in southern Finland was 9-10 kg m-2 at herb-rich sites and about 8 kg m-2 at mesic sites. Soil nitrogen content and the C/N ratio were also representative of the site type and not dependent on the management practice. The lower C/N ratio at the EA1 compared with UA1 is consistent with the assumption that part of the nitrogen previously stored in the forest stand has been transferred to the soil with the harvest residues, especially foliage and fine roots that have high N contents ([12], [10]). While the N contents correlate with the plot-level respiration rates, we were not able to separate this effect from that of the more direct soil temperature and moisture effects.
Other factors, such as soil pH or soil texture, were not measured in our study. Instead, we classified the sites according to the Finnish site type system based on ground and field layer vegetation ([4]). Large soil surveys have shown the relation of site type with various soil characteristics important for, e.g., tree growth, microbial function and water retention. These include soil pH, humus layer thickness, organic layer nitrogen content and C/N ratio ([39]). For example, the average pH of the humus layer in Finland is 4.9 for herb-rich sites and 4.0 for mesic sites ([39]). The existence of these correlations explains the power of the site type concept and why it is used as a standard classification in virtually all Finnish studies of forest ecology and management ([19], [42]).
Data reliability
It must be noted that we only measured the carbon dioxide flux during summer, i.e., in the growing season. In addition, the measurements were carried out around midday and early afternoon, so the data do not represent a 24-hour average. This means that the data collected are not suitable for making accurate carbon balance estimations for long time periods, but it should be fine for estimating the scale of the flux and more importantly to understand the effects of different management practices on the carbon dioxide flux.
For the consistency and reliability of soil CO2 efflux measurements it was important that the chamber and the individual collars remained air tight. In our study, there were not any major problems with the chamber itself or its equipment, apart from the battery failure in week 28. The collars required some maintenance throughout the summer. Regular cuttings of vegetation inside the collar meant that the soil respiration was not on a completely natural level, but the cutting was necessary on the herb-rich sites. The collars stayed firmly on the ground for most of the time, but after heavy rains, the sand used as insulation outside the collars required some trimming. Two collars had to be refitted on to the ground during the summer.
As the main criterion for the placement of the collars in the uneven-aged stands was the light or closed canopy conditions of the spot, the soil under the collar and the overall characteristics of the spot were mostly over-looked. There seemed to be quite a large variation of the CO2 flux between the collars, even within the seemingly homogeneous even-aged stands (Fig. 6). Causes for this kind of within-plot or subplot variation include large stones or roots in the soil, decaying stumps near the collars, type of vegetation in and around the collar and the thickness of the organic layer of the soil. As the number of collars was relatively low, uncertainty due to sampling errors is large. However there is no reason to assume that any of the measuring points were somehow unique and that this sort of variation in forest floor and soil is not normal ([3], [25]).
Fig. 6 - The mean CO2 efflux (CO2 mg m-2 s-1) of the individual measuring points (collars). On the uneven-aged plots the gap grey boxes are gap points and the dark grey ones are closed canopy points. White boxes are even-aged points.
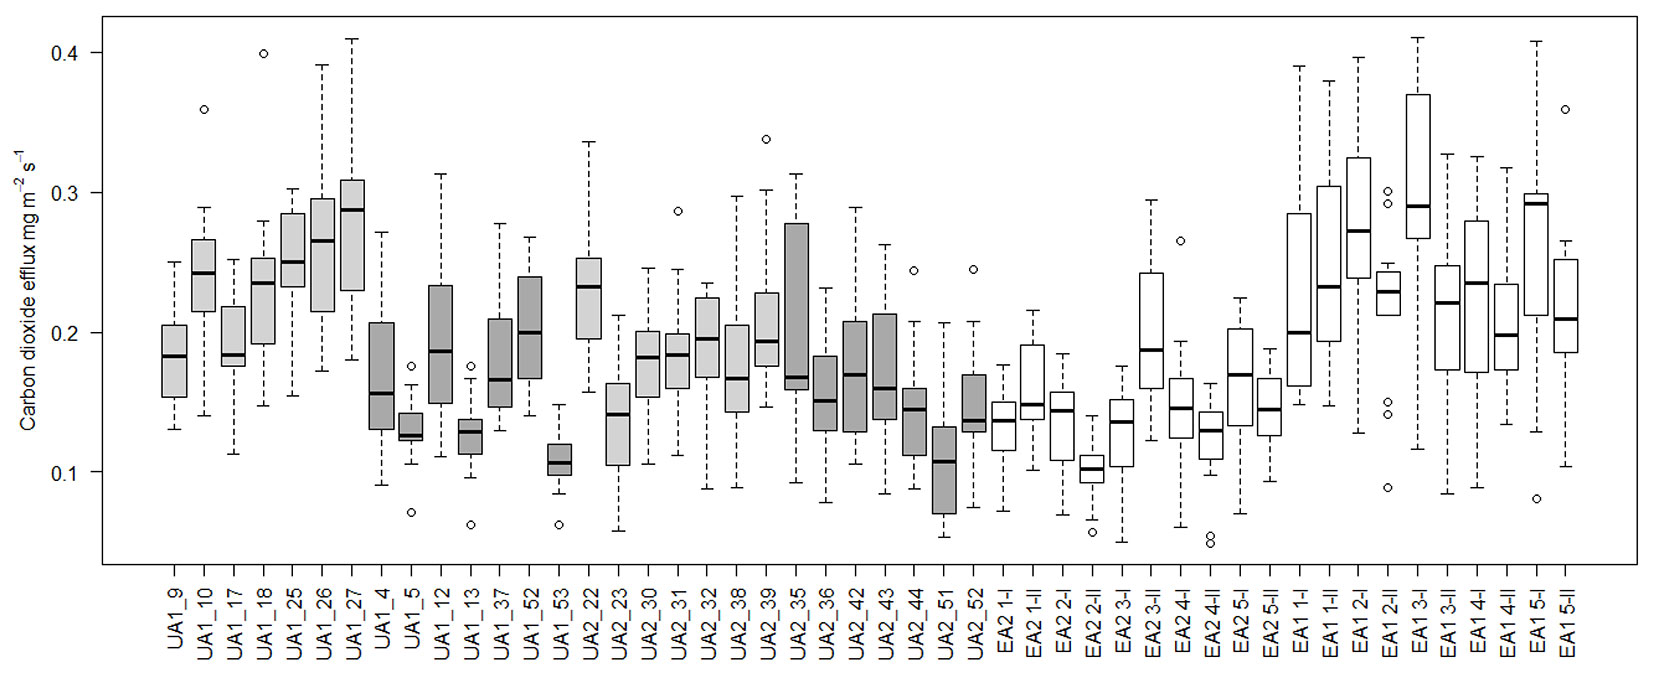
There is also a possibility that the chamber measurements underestimate the CO2 efflux. According to Rayment ([32]) and Pumpanen ([29]) the closed chamber systematically underestimates the CO2 efflux. This is possibly because the actual volume in effect does not include just the volume of the chamber, but also the air filled space in the ground under the chamber ([32]).
Conclusions
Using uneven-aged forestry does not remove the sudden soil CO2 efflux increase from forest soils that follows cuttings. However, the higher levels of soil CO2 efflux in uneven-aged stands were mainly from areas were the tree cover had been removed, whereas the areas of remaining tree cover had lower levels of soil CO2 efflux similar to those of growing even-aged stands. This suggests that by controlling the area of remaining tree cover the amount of CO2 released from soils can be controlled. This is supported by the results showing increased soil temperature with decreased tree cover. Even though soil moisture clearly affects the soil CO2 efflux, it seems that soil moisture is not greatly affected by the management practise, but rather by the soil type. This seems to be the case for soil carbon and nitrogen contents as well. Of course, a stand that has been under uneven-aged management for the time of several tree generations could have higher carbon and nitrogen concentrations than an even-aged stand, but for now, this is only speculation and more research is needed on the long-term effects of uneven-aged management.
Acknowledgements
Funding for this study was provided by the Maj and Tor Nessling foundation and by EU FP7 grant # 311970 (FORMIT). AK was the main author and data collector for this study. AM helped with the study design and manuscript structure in addition of providing advice and comments. JP provided the models and means for data handling and instructions for the use of field equipment. JS constructed the original study plot design and collected and analysed the soil core samples. FB was behind the original idea for this study and provided comments and advice as well as help with field work.
References
Gscholar
Gscholar
Gscholar
Gscholar
Gscholar
Gscholar
CrossRef | Gscholar
CrossRef | Gscholar
Gscholar
Gscholar
Gscholar
Gscholar
Supplementary Material
Authors’ Info
Authors’ Affiliation
Annikki Mäkelä
Jussi Saarinen
Frank Berninger
University of Helsinki, Department of Forest Sciences, P.O. Box 27 (Latokartanonkaari 7) FI-00014 Helsinki (Finland)
University of Eastern Finland, Department of Environmental and Biological Sciences, P.O. Box 1627, FI-70211 Kuopio (Finland)
Corresponding author
Paper Info
Citation
Kumpu A, Mäkelä A, Pumpanen J, Saarinen J, Berninger F (2018). Soil CO2 efflux in uneven-aged and even-aged Norway spruce stands in southern Finland. iForest 11: 705-712. - doi: 10.3832/ifor2658-011
Academic Editor
Ana Rey
Paper history
Received: Oct 20, 2017
Accepted: Sep 18, 2018
First online: Nov 06, 2018
Publication Date: Dec 31, 2018
Publication Time: 1.63 months
Copyright Information
© SISEF - The Italian Society of Silviculture and Forest Ecology 2018
Open Access
This article is distributed under the terms of the Creative Commons Attribution-Non Commercial 4.0 International (https://creativecommons.org/licenses/by-nc/4.0/), which permits unrestricted use, distribution, and reproduction in any medium, provided you give appropriate credit to the original author(s) and the source, provide a link to the Creative Commons license, and indicate if changes were made.

Web Metrics
Breakdown by View Type
Article Usage
Total Article Views: 48520
(from publication date up to now)
Breakdown by View Type
HTML Page Views: 39760
Abstract Page Views: 4180
PDF Downloads: 3639
Citation/Reference Downloads: 6
XML Downloads: 935
Web Metrics
Days since publication: 2803
Overall contacts: 48520
Avg. contacts per week: 121.17
Article Citations
Article citations are based on data periodically collected from the Clarivate Web of Science web site
(last update: Mar 2025)
Total number of cites (since 2018): 4
Average cites per year: 0.50
Publication Metrics
by Dimensions ©
Articles citing this article
List of the papers citing this article based on CrossRef Cited-by.
Related Contents
iForest Similar Articles
Research Articles
Effect of different dolomitic limestone dosages on soil respiration in a mid-altitudinal Norway spruce stand
vol. 12, pp. 357-365 (online: 05 July 2019)
Research Articles
Potential relationships of selected abiotic variables, chemical elements and stand characteristics with soil organic carbon in spruce and beech stands
vol. 14, pp. 320-328 (online: 09 July 2021)
Research Articles
The effect of soil conditions on submountain site suitability for Norway spruce (Picea abies Karst.) in Central Europe
vol. 16, pp. 210-217 (online: 31 July 2023)
Research Articles
Dynamics of soil organic carbon (SOC) content in stands of Norway spruce (Picea abies) in central Europe
vol. 11, pp. 734-742 (online: 06 November 2018)
Research Articles
Impacts of Norway spruce (Picea abies L., H. Karst.) stands on soil in continental Croatia
vol. 12, pp. 511-517 (online: 02 December 2019)
Research Articles
The manipulation of aboveground litter input affects soil CO2 efflux in a subtropical liquidambar forest in China
vol. 12, pp. 181-186 (online: 10 April 2019)
Research Articles
Different harvest intensity and soil CO2 efflux in sessile oak coppice forests
vol. 9, pp. 546-552 (online: 25 March 2016)
Review Papers
The soil-conscious forestry and the forbidden apple
vol. 17, pp. 252-268 (online: 16 August 2024)
Research Articles
Twenty years of conversion: from Scots pine plantations to oak dominated multifunctional forests
vol. 10, pp. 75-82 (online: 19 October 2016)
Research Articles
Spatial heterogeneity of soil respiration in a seasonal rainforest with complex terrain
vol. 6, pp. 65-72 (online: 07 February 2013)
iForest Database Search
Search By Author
Search By Keyword
Google Scholar Search
Citing Articles
Search By Author
Search By Keywords
PubMed Search
Search By Author
Search By Keyword


