The conversion into high forest of Turkey oak coppice stands: methods, silviculture and perspectives
iForest - Biogeosciences and Forestry, Volume 13, Issue 4, Pages 309-317 (2020)
doi: https://doi.org/10.3832/ifor3483-013
Published: Jul 10, 2020 - Copyright © 2020 SISEF
Research Articles
Abstract
The goal of this study is to assess the impact of different thinning approaches for coppice conversion into high forest of Turkey oak stands in Italy. The stand structure and the tree/shrub diversity were analyzed in 27 long-term monitoring plots from 7 experimental trials in the Colline Metallifere district (Tuscany, Central Italy) to verify the consistency of the original cultivation goals with the current stand structures. Three different approaches were applied from 1969 onwards: thinning from below, selective thinning, and no-management. Three indexes of specific diversity (Specific Richness, Shannon index and Importance Value) and two indexes of vertical diversity (Vertical Evenness and Coefficient of variation of tree height) were used to analyze and compare the outcome of management practices. The results showed a significantly higher dimensional variability and basal area, and a more complex vertical diversity in control plots and in the plots subject to selective thinning, as compared with plots subject to thinning from below. Tree species richness was high in all plots, independently of the thinning type applied. Based on our results, we suggest Turkey oak-dominated transitory stands to be initially managed by thinning from below, which is easy to be implemented and economically feasible. Selective thinning may be applied later with the aim of promoting sporadic but valuable tree species and increasing tree species diversity.
Keywords
Forest Monitoring, Thinning from Below, Selective Thinning, Biodiversity, Mediterranean Area
Introduction
Turkey oak coppices (Quercus cerris L.) cover 18.4% (675,532 ha) of the forest area under the coppice system in Italy (INFC 2005 - [21]). This forest type is located in the hilly and mountainous areas throughout the peninsula from the plains up to 1000 m a.s.l. The traditional cultivation goals were firewood, charcoal, fodder for cattle breeding and, since the 1800s, the production of railway sleepers ([42]). The lack of regular and timely harvestings, the maintenance of coppice under lengthened rotations or its conversion into high forests were the practices addressed to withstand its reduced profitability after the fall of the firewood market occurred from 1960-70. More efficient logging systems and the availability of higher wood harvests per unit area allowed the reduction of costs ([46], [21]).
The main goals of coppice conversion into high forest, which has been undertaken in most countries since the second half of the 1900s on a share of coppice area in the public domain, were to: (i) increase the value of semi-natural forests, i.e., increase their biological, structural and functional diversity from the stand to the landscape level; (ii) re-establish the bio-ecological features of less intensive and more long-living ecosystems ([20], [38], [7]). The production of wood assortments other than firewood was also expected ([2], [8]). Several research trials were set up to: (i) define and improve the cultivation techniques; (ii) find evidence of positive stand growth trend far beyond the ages of customary rotations ([1], [4]); (iii) check the eco-physiological functioning of outgrown, thinned and unthinned coppices for growth efficiency, canopy properties and water relationships ([12], [13]); and (iv) identify the physical-mechanical quality of wood and the feasibility for improvement by hygro-thermic treatments in view of their possible use for plywood and panels ([3], [6], [50]).
Within the wide cover of Turkey oak-dominated stands, both coppice and high forest systems may provide significant contributions to the current demand of renewable energy and contribute to biodiversity conservation, soil protection, carbon sequestration, landscape quality and recreational value ([18], [14], [15], [16], [27], [32], [33], [37], [41], [34]). Moreover, the multifunctional role of forests and their sensitivity to social, economic and environmental changes call for defining management criteria able to warrant the maintenance of goods and services, and improve system resilience ([22], [24], [45], [19], [36], [30], [31]).
The priority goal of the conversion of Turkey oak coppice into high forest is to re-establish the original physiognomical, structural and tree compositional diversity. This is why its implementation should be limited to well-served and fertile areas, and special attention should also be devoted to valuable tree species other than Turkey oak ([48], [49]). Silvicultural approaches for the conversion into high forests have been different in research trials and the practice of forestry, and varied as a function of the environmental and social context, as well as the main cultivation goal ([40]).
This paper analyses for the first time a large dataset from seven experimental trials located in the Colline Metallifere - a main forest district in Tuscany (Central Italy) characterized by hilly and mountainous marginal contexts - with the aims of: (i) describing the methods applied in the research trials established from 1969 onwards by the current CREA (Council for Agricultural Research and Economics); the main differences between trials were type, intensity and frequency of thinning and/or age of first thinning; (ii) analysing the impacts of the different silvicultural approaches on stand structure and tree/ shrub compositional diversity, to verify the consistency of current stand structures with the original cultivation goals, i.e., either favouring pure and one-storied Turkey oak stands or favouring mixed and multi-storied crops since the conversion cycle.
Materials and methods
Study area
The dataset originates from 27 permanent plots for a total monitoring area of 5.6 ha distributed in 7 long-term experimental trials in the Colline Metallifere, South-West of Tuscany (Central Italy). This area is the main and wider system facing the Tyrrhenian coast, ranging from the plains up to an elevation of 1060 m a.s.l. Bedrock is made by argillite and clay-calcareous flysch (⇒ http://sit.lamma.rete.toscana.it/websuoli/). Soils are deep to shallow with a reduced differentiation of the vertical profile ([11] - Tab. 1). The Mediterranean climate in the area is characterized by hot and dry summer and the occurrence of autumn-winter rainfall (Tab. 1). Forests cover reaches 84% and coppices are 90%. Turkey oak stands are the prevailing type (26%); holm oak (22%), thermophilous deciduous broadleaved (19%) and mixed evergreen sclerophillous / deciduous forests (17%), complete the composition per type.
Tab. 1 - Main climatic data. (Ta): mean annual temperature; (Ts): mean summer temperature; (Ra): mean annual rainfall; (Rs): mean summer rainfall; (Ia): Ra/(Ta+10) mean annual dryness index (de Martonne); (Sd): summer dryness and soil type at the research sites.
| Research sites |
Meteorological site (elev.) | Ta (°C) | Ts (°C) | Ra (mm) | Rs (mm) | Ia | Sd (days) | Soil Type |
|---|---|---|---|---|---|---|---|---|
| FON FOS FOT POG TRO | Monterotondo (670 m a.s.l.) |
12.1 | 20.5 | 1112 | 113 | 50 | 60 | Typic Ustorthents, loamy-skeletal, mixed, calcareous, mesic, shallow |
| MR | Chiusdino (450 m a.s.l.) |
13.4 | 21.4 | 827 | 114 | 35 | 62 | Typic Dystrusteps, loamy-skeletal, siliceous, mesic |
| CS | Monteverdi (300 m a.s.l.) |
13.3 | 21.3 | 896 | 92 | 38 | 81 | Typic Ustorthents, fine-loamy, mixed, calcareous, mesic |
Design of trials
The main site parameters and characteristics are reported in Tab. 2. Trials were designed as long-term monitoring protocols, i.e., aimed at reaching the end of the conversion cycle. The elevation range varies between 305 and 720 m a.s.l., North aspect is prevailing, and different slopes are present. Two trials were designed according to randomized blocks (3 thesis and 4 blocks in CS; and 3 thesis and 2 blocks in MR) or without any replication (the other sites), thus allowing the establishment of large-sized plots and ensuring larger tree populations in the long run. Plot size varied from 900 to 2400 m2 in the replicated designs and from 2500 to 5000 m2 at the other sites.
Tab. 2 - Main site characteristics, design of trial, applied silvicultural approach and monitoring time at the 7 experimental sites. (Co): no-management (control); (Be): thinning from below; (Se): selective thinning.
| Characteristics | Treatment | TRO | FON | FOT | FOS | POG | MR | CS |
|---|---|---|---|---|---|---|---|---|
| Elevation (m a.s.l.) | 720 | 610 | 585 | 580 | 570 | 325 | 305 | |
| Aspect | N | NO | NE | E-NE | E-NE | O | N-NO | |
| Slope (°) | 8 | 10 | 8 | 10 | 10 | 12 | 15 | |
| Plots (n) | 2 | 2 | 2 | 1 | 2 | 6 | 12 | |
| Plot size (m2) | 2500 | 2500 | 3200 | 5000 | 4700 | 2400 | 900 | |
| Silvicultural approach | Co | - | - | - | - | 1 | - | 4 |
| Be | 1 | 2 | 1 | 1 | 1 | 4 | - | |
| Se | 1 | - | 1 | - | - | 2 | 8 | |
| Thinnings (n) | Co | - | - | - | - | - | - | - |
| Be | 1 | 1 | 2 | 2 | 1 | 1 | - | |
| Se | 2 | - | 2 | - | - | 2 | 2 | |
| Stand age at the first inventory (yrs) | 42 | 34 | 47 | 38 | 35 | 55 | 20 | |
| Stand age at the last inventory (yrs) | 50 | 47 | 54 | 45 | 55 | 57 | 65 | |
Silvicultural options
The silvicultural approaches varied across sites as a function of the final conversion goal: (i) building up pure, one-layered Turkey oak stands; (ii) establish Turkey oak high forests with a complementary layer of other tree species; (iii) rearrange into mixed stands where other valuable broadleaves are pooled to Turkey oak. Two different thinning methods and the no intervention choice were here applied, as described below.
(a) Thinning from below (Be) applied in 10 plots. This is the most common practice for coppice conversion into high forest. All the trees living in the dominated layer and, partly, in the co-dominant layer if badly-shaped, damaged or competing with dominant trees, were removed.
(b) Selective thinning (Se) applied in 12 plots. A positive selection was undertaken here to improve the growth of best-shaped trees removing only their direct competitors. Selected trees included the dominant species Turkey oak, but also the other valuable tree species, where present. This thinning method was implemented with a different timing within the trials: a relatively high number of candidate trees (1100 and 1500 ha-1) were selected in a juvenile stand age (20 years) in CS; a limited number of target trees was chosen in the other cases (80-150 ha-1) at higher stand ages (42 to 56 yrs).
(c) Control (Co), no silvicultural treatment applied (5 plots). Stand evolution followed strictly the natural post-cultivation dynamics.
Monitoring and data analysis
Survey varied in time and was balanced according to the main goal of the experiment. Indeed, while periodical surveys of tree density, growth and productivity were implemented almost everywhere, more detailed surveys such as individual tree mapping and canopy parameters measurements, were carried out in a few specific plots.
The following parameters were recorded in each plot before and after each thinning: stand age, individual tree diameter at 1.30 m (DBH), tree height (measured on a representative sample to build up the tree height-DBH relationship), and the tree species assessment.
Data processing provided the number of trees per hectare (N), the basal area (Ba, m2 ha-1), the dominant diameter (Dd, the diameter of 100 largest trees, cm) and the mean diameter (DBH, cm). The above parameters were computed separately for each of three layers, i.e., the lower (tree height lower than 1/3 of dominant height), the intermediate (tree height between 1/3 and 2/3 of dominant height), the upper layer (tree height higher than 2/3 of the dominant height).
A set of indexes describing stand structure, complexity and tree biodiversity were calculated ([35]). The site-index was defined by dominant tree height (DH, m), tree density by the number of trees (N) and basal area (Ba, m2 ha-1) per species and per hectare. Stand growth and dynamics over the subsequent inventories were assessed by the current increment of basal area (CiBa, m2 ha-1 yr-1) and the tree mortality rate (M%). Thinning type was assessed as a function of removal intensity (percentage of removed stems, N%; and percentage of removed basal area, Ba%), ratio between removed Ba and Ba increment in the period (increment and felling), ratio between removal intensity in terms of Ba% and removal intensity in terms of N% (TT ratio - [26]). This last index takes values higher than 1.1 when dominant trees are being removed (i.e., selective thinning, thinning from above, crown thinning), and values lower than 0.9 when dominated trees are being removed.
Three indexes of species diversity and two indexes of vertical diversity were selected to analyze and compare the effects of different silvicultural treatments on tree/shrub composition and stand structure. The Specific Richness index (S) highlights the number of species (trees/shrubs) in the stand, which reflect (though conditioned by sample size) the ecosystem quality, allowing the assessment of disturbances on specific composition. The second species diversity index was Shannon (SH, [47] - eqn. 1):
where pi = ni /N with ni as the number of trees of the i-th species and N as the total number of trees. The index ranges between 0 and + ∞ and allows to compare specific diversity as a function of the stand parameters and the applied treatment.
The third index was the Importance Value (IV) determined for each species ([9] - eqn. 2):
where pi is as above and qi = bai /Ba with bai as the basal area of trees of the i-th species and Ba as the basal area of the plot. This index accounts for the presence of each species averaging out tree density and productivity.
All the species diversity indexes (S, SH and IV) were computed both at the stand level and for each tree layer (0-1/3, 1/3-2/3, 2/3-1 of the dominant height) to assess possible differences among the applied treatments.
Among the vertical diversity indexes, we used the Vertical Evenness (VE), a descriptor of tree layering ([39] - eqn. 3)
where s is the number of height classes, pi = ni /N with ni as the number of trees in each height class and N as the total number of trees. It was calculated both at the stand level and for each tree layer (0-1/3, 1/3-2/3, 2/3-1 of the dominant height). The index ranges from 0 (one-layered stand) to 1 (multi-layered stand). In addition, the coefficient of variation of tree height (CV) was computed as a measure of variability within each plot ([29]).
The analysis of variance (ANOVA) was applied to test for differences in the above parameters and indexes among treatments (control, selective thinning, thinning from below). A preliminary analysis was firstly made to verify the assumptions of parametric models (i.e., the normality of distributions and the homogeneity of variances). The post-hoc Tukey’s HSD test was used to test for differences among treatment mean values for each parameter analyzed. ANOVA and Tukey HSD test were carried out both at the stand level and for each tree layer to detect possible within layer differences not advisable at the plot level.
A multivariate linear model was fitted on plot level data using the above parameters as predictors of tree biodiversity (SH) and structural complexity (VE). Given the differences (unit and range) among the predictors, data were standardized. The basic structure of the models was (eqn. 4):
where I is the intercept, x1, …, xn are the predictors selected according to results from ANOVA. All models were run using the statistical language implemented in the software R ver. 3.5.2 ([44]).
Results
Thinning characterization
The two thinning treatments applied in the Turkey oak coppices were significantly different in terms of Ba% and N% (TT = 0.65 in Be e TT = 1.16 in Se). The age of the first thinning was delayed in the case of thinning from below (90% of plots thinned the first time between 20 and 40 yrs), while it was earlier (within the age of 20 yrs) under selective thinning (Se). Thinning intensity was higher for thinning from below (55%) than for selective thinning (45% - Tab. 3). Concerning the harvesting intensity with respect to the basal area increment stored up between subsequent practices, nowhere the full wood increment was removed.
Tab. 3 - Thinning trials (type, frequency and intensity) at the experimental plots. Significant (p<0.05) differences in rows are marked with different letters.
| Characteristics | Class/Stat | Thinning from below |
Selective thinning |
|---|---|---|---|
| Number of applied thinnings | - | 1-2 | 2 |
| Age at the first thinning (% of plots) |
≤ 20 yrs | 10 | 67 |
| 20-40 yrs | 90 | 33 | |
| Elapsed time (yrs) between thinnings | Mean ± SD | 20.00 ± 5.83 a | 20.00 ± 4.82 a |
| Thinning type (TT) | Mean ± SD | 0.65 ± 0.15 a | 1.16 ± 0.35 b |
| Intensity of thinning (% of plots, according to basal area removed) |
≤ 20 % | 25 | 32 |
| 20-35 % | 25 | 63 | |
| > 35 % | 50 | 5 | |
| Increment and Felling (% of felling to basal area increment) |
Mean ± SD | 55.0 ± 11.8 a | 45.0 ± 15.4 a |
Structural dynamics
At the first monitoring inventory, the site index of the trials (Tab. 4) was intermediate with reference to the data for similarly aged stands reported in the literature. The dominant tree height ranged from 17.6 to 18.6 m within the ages spanning 23-38 yrs, without any significant differences among the applied thinning practices and sites. In the plots subject to thinning from below, the first monitoring inventory was undertaken 10-12 years after the first thinning. This is why the three treatments were quite different in terms of number of tree per hectare, which was significantly lower (p<0.05) in the plots thinned from below (2681 ha-1) than in the control plots (4347 ha-1) and in the plots not yet thinned by selective thinning (4448 ha-1).
Tab. 4 - Main stand parameters (mean values ± standard error) for stand age, tree dominant height (DH), number of stems (N), basal area (Ba), mean tree diameter (DBH), Importance Value index for Quercus cerris L. (IVQc), recorded at the first inventory (see Tab. 2 for years) per silvicultural treatment. Significant differences (p<0.05) are marked with different letters (Tukey HSD test).
| Parameter | Control | Thinning from below |
Selective thinning |
|---|---|---|---|
| N of plots | 5 | 10 | 12 |
| Age (yrs) | 23 ± 2.7 | 38 ± 2.1 | 25 ± 3.3 |
| DH (m) | 18.0 ± 0.2 a | 18.6 ± 0.8 a | 17.6 ± 0.5 a |
| N total (n ha-1) | 4347 ± 180 a | 2681 ± 400 b | 4448 ± 442 a |
| Ba (m² ha-1) | 27.38 ± 1.24 a | 29.69 ± 1.80 a | 27.94 ± 1.47 a |
| DBH (cm) | 9.0 ± 0.2 a | 13.0 ± 1.2 b | 9.4 ± 0.8 a |
| IVQc | 0.70 ± 0.05 a | 0.71 ± 0.05 a | 0.82 ± 0.08 a |
The basal area varied from 27.38 m2 in the control plots to 29.69 m2 in Be, without any significant differences among treatments because the time elapsed since the first thinning from below and the first stand inventory allowed the recovery of the removed basal area.
Significant differences (p<0.05) in mean DBH were observed between the plots thinned from below (DBH = 13.0 cm) and those selectively thinned (DBH = 9.4 cm) or unthinned (DBH = 9.5 cm).
Turkey oak presence was high in all plots, but the differences were not significant.
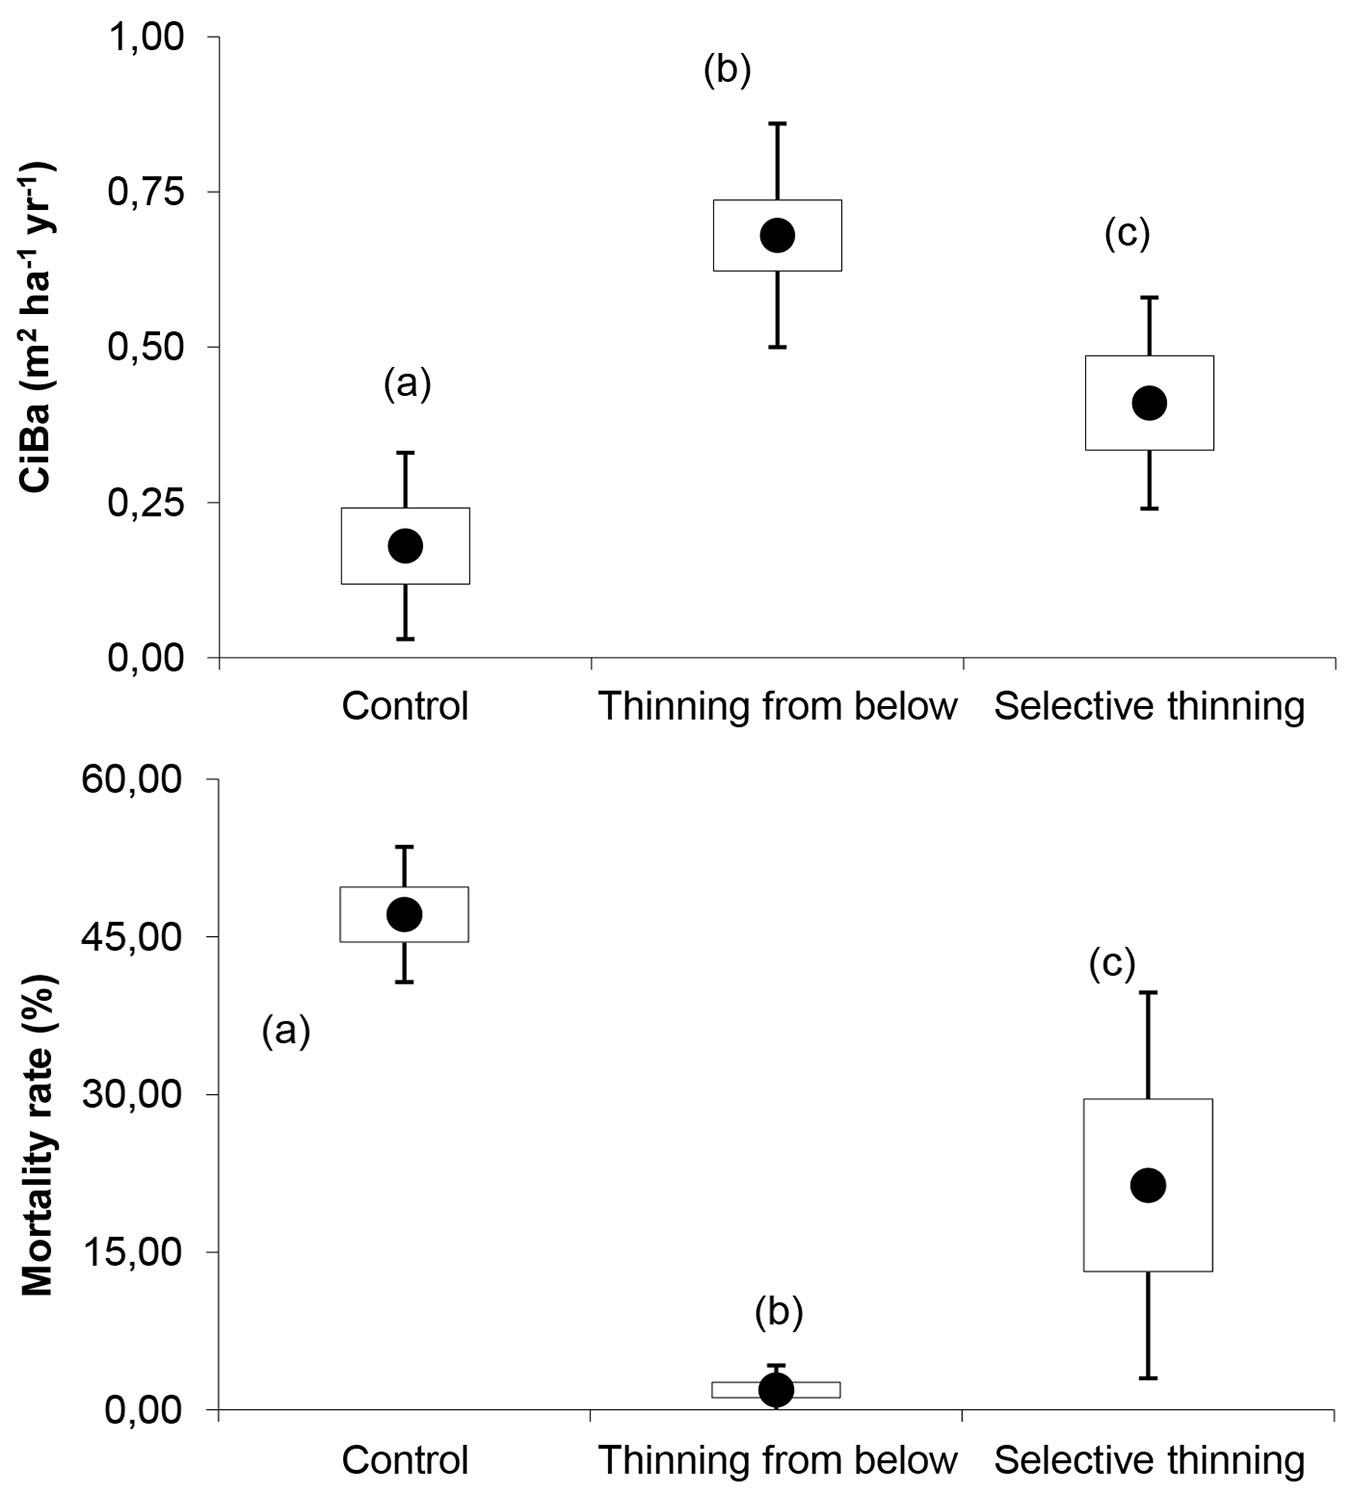
The evaluation of stand dynamics as a function of the applied silvicultural treatment was undertaken by comparing the values of three quantitative indexes: the current increment of basal area (CiBa), the tree mortality rate (M), and the difference between the dominant and mean diameter (Dd-DBH), calculated over the period between the occurrence of last thinning and the last inventory. CiBa reflects the stand growth performance, the mortality rate is dependent on the tree competition process, and the parameter Dd-DBH indicates the effect of thinning type on tree size structure.
The current basal area increment recorded over the last period (Fig. 1) was significantly higher (p<0.05) in the plots thinned from below (CiBa = 0.68 m2 ha-1 yr-1) than in those selectively thinned (CiBa = 0.41 m2 ha-1 yr-1) and the control plots (CiBa = 0.18 m2 ha-1 yr-1). The mortality rate (M%) showed an opposite trend: low values of increment in control plots reflect a high level of inter-individual competition and consequently high tree mortality values (M% = 47.1%). Contrastingly, negligible tree mortality rates were recorded in the plots thinned from below (M% = 1.9%). The plots subjected to selective thinning (M% = 21.4%) were shown to be different from the plots managed under the other approaches (Be and Co) because the reduction in tree density in the dominant layer was linked to the full release of dominated and overtopped layers.
Fig. 1 - Mean, standard error and standard deviation of current basal area increment (above) and mortality rate (below) recorded over the last period at each silvicultural approach. Significant differences (p<0.05) are marked with different letters.
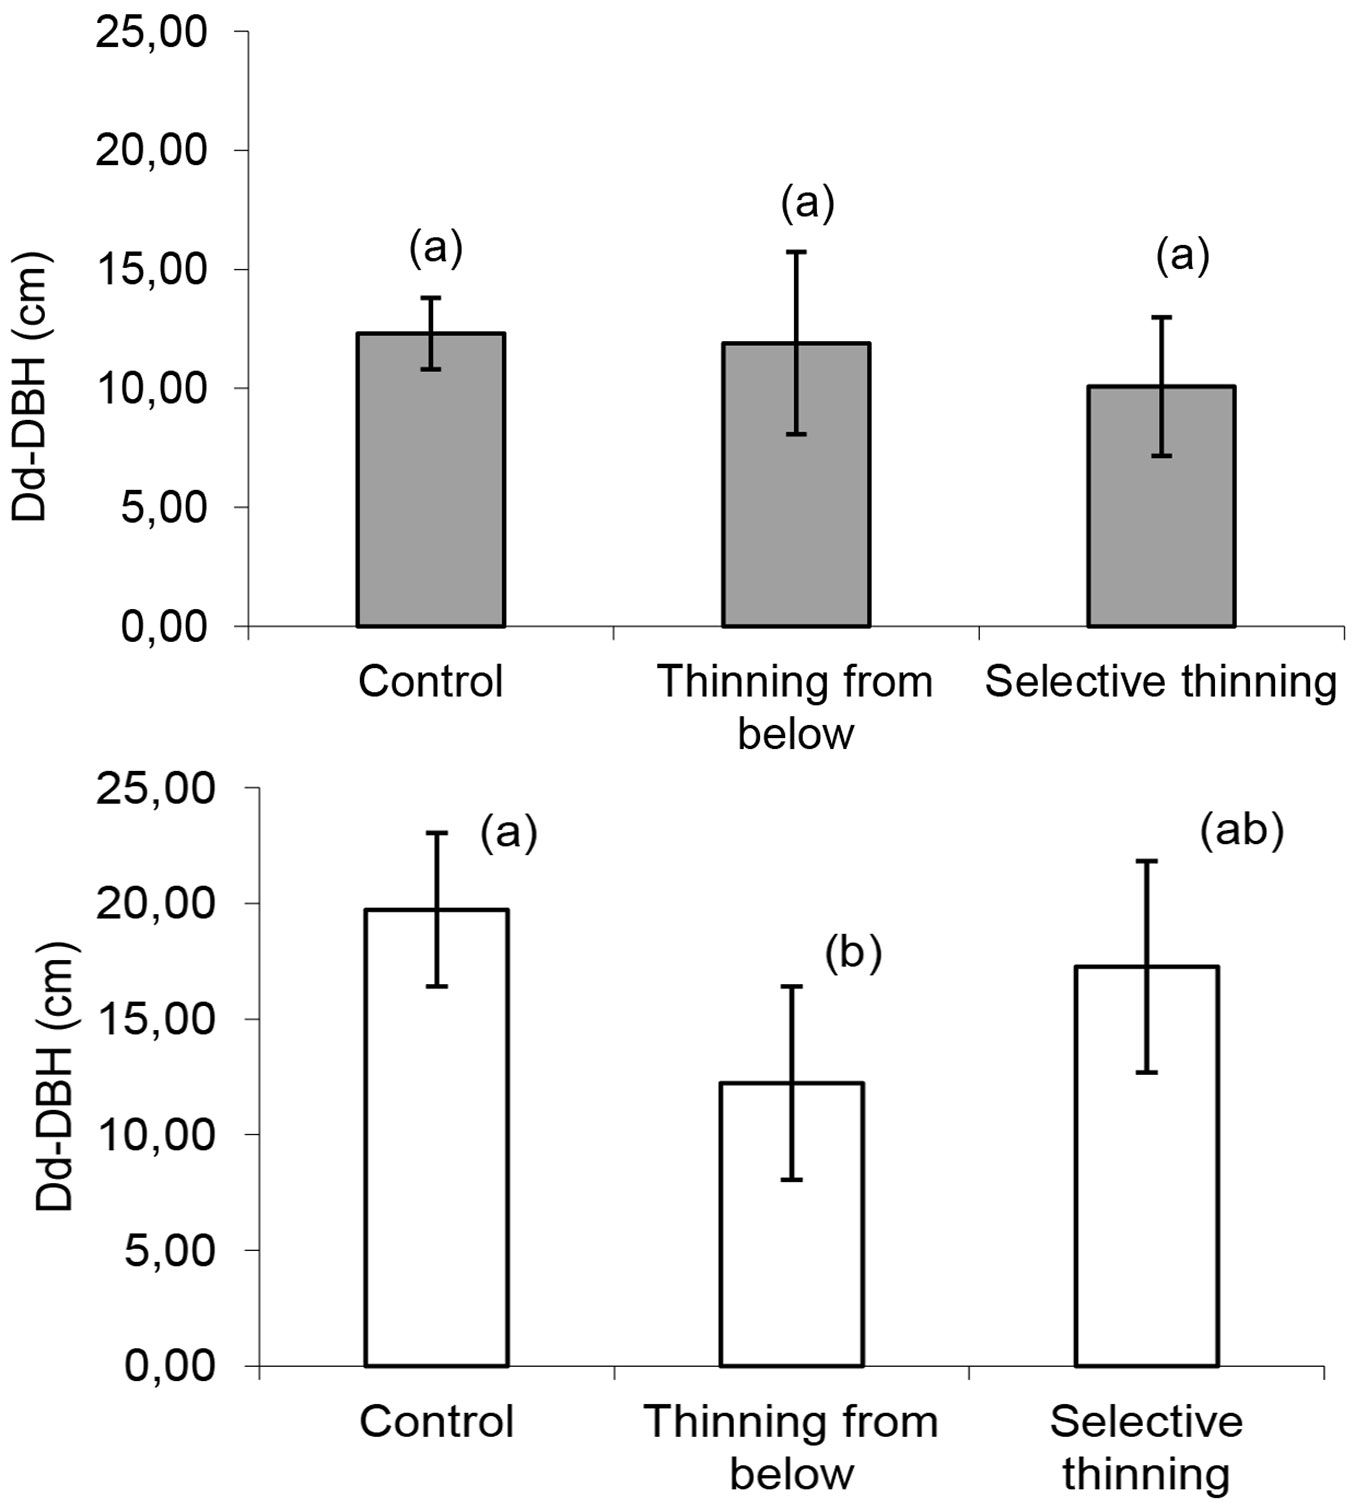
The difference between the dominant and mean diameter (Dd-DBH) highlighted a reduced variability among both plots and treatments at the first inventory (Fig. 2). At the end of the monitoring period, the differences in Dd-DBH between the plots thinned from below and the other treatments were significant (p<0.05). In the absence of any thinning and in the case of selective thinning, a significant increase in Dd-DBH was recorded, while thinning from below had low and steady DBH differences.
Fig. 2 - Differences between dominant diameter (Dd) and mean diameter (DBH) according to the applied treatment at the beginning (above) and end (below) of monitoring time. Significant differences (p<0.05) are marked with different letters.
Impact of thinning on stand vertical structure and tree biodiversity
Stands had similar ages, ranging from 52 to 63 years at the last inventory (Tab. 5). The dominant height was different only for Be (DH = 20.7 m), and these stands were approximately 10 years younger than the others. Stand tree density was higher and significantly different (p<0.05) in the control areas (2041 trees ha-1) and in those under selective thinning (1697 trees ha-1) than that recorded in the plots thinned from below (1082 trees ha-1). At the same time, significantly lower basal area values (p<0.05) were recorded in the plots thinned from below (Ba = 24.99 m2 ha-1) than in the other plots. In the selectively thinned plots, both the release of the dominated layer and the incremental boost of the selected stems led to high basal area values (Ba = 33.49 m2 ha-1) that were comparable to those measured in the control plots (Ba = 39.99 m2 ha-1).
Tab. 5 - Main stand parameters (mean values ± standard error) for tree age, dominant tree height (DH), number of stems (N), basal area (Ba), mean tree diameter (DBH) recorded at the last inventory (see Tab. 2 for the reference age) per silvicultural treatment. Significant differences (p<0.05) in rows are marked with different letters.
| Variable | Layer | Control | Thinning from below |
Selective thinning |
|---|---|---|---|---|
| N of plots | 5 | 10 | 12 | |
| Age (yrs) | 63 ± 4.5 | 52 ± 4.5 | 61 ± 5.6 | |
| DH (m) | 25.7 ± 3.5 a | 20.7 ± 2.5 b | 24.7 ± 2.8 a | |
| N total (n ha-1) | All layers | 2041 ± 533 a | 1082 ± 604 b | 1697 ± 785 a |
| Upper layer | 666 ± 257 a | 620 ± 248 a | 550 ± 178 a | |
| Medium layer | 365 ± 327 a | 291 ± 286 a | 338 ± 209 a | |
| Lower layer | 1010 ± 325 a | 171 ± 232 b | 810 ± 734 a | |
| Ba (m2 ha-1) | All layers | 39.99 ± 4.77 a | 24.99 ± 6.56 b | 33.49 ± 7.96 a |
| Upper layer | 35.56 ± 5.51 a | 22.62 ± 4.84 b | 29.33 ± 6.44 c | |
| Medium layer | 2.48 ± 1.51 a | 1.61 ± 1.93 a | 2.49 ± 1.56 a | |
| Lower layer | 2.00 ± 0.79 a | 0.23 ± 0.30 a | 1.67 ± 1.47 a | |
| DBH (cm) | 16.1 ± 2.7 a | 18.3 ± 3.6 a | 16.8 ± 3.3 a | |
A different distribution of trees and basal area becomes evident by splitting data into layers. The upper and middle layers had a similar number of trees in all the three treatments, while differences among the treatments were significant (p < 0.05) in the lower layer (171 trees ha-1 in Be, 810 and 1010 trees ha-1 in Se and Co, respectively). The three treatments showed significantly different (p < 0.05) basal area only in the upper layer (Ba = 35.56, 22.62, 29.33 m2 ha-1 in Co, Be and Se respectively).
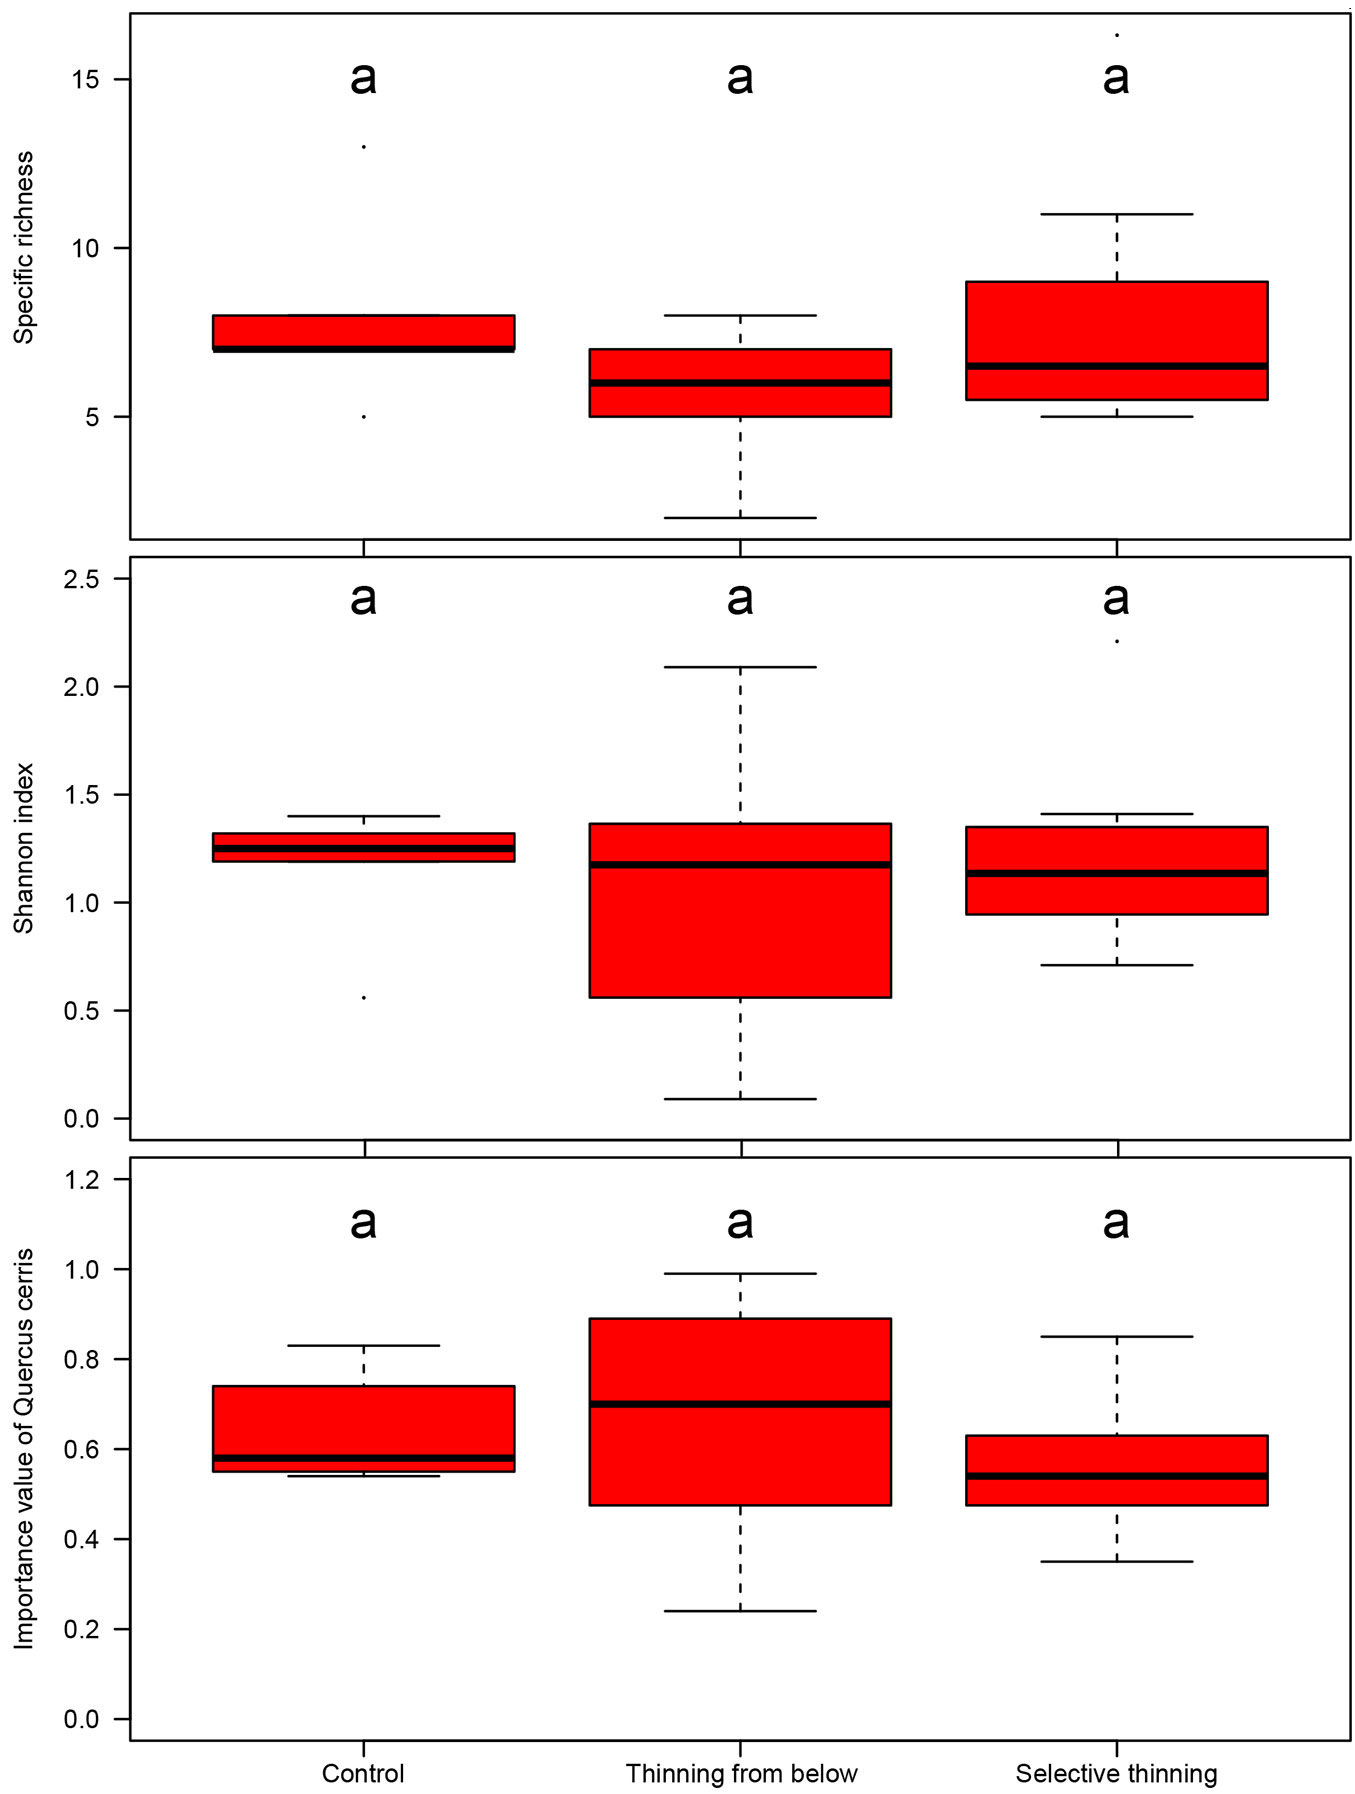
The impact of the applied silvicultural treatment on tree specific diversity is shown in Fig. 3. At the last inventory, the number of tree species (specific richness, S) reached high values in all the three treatments: up to 16 species in the control plots, up to 25 in the Be plots and up to 28 in the Se plots, even though the mean values per treatment did not show any significant difference.
Fig. 3 - Box-plots of specific richness (S), Shannon index (SH) and importance value (IV) of Quercus cerris according to the different silvicultural treatments at the last inventory. Significant differences (p<0.05) are marked with different letters.
Quercus cerris L., Quercus pubescens Willd., Quercus ilex L., Fraxinus ornus L., Fraxinus angustifolia Vahl., Ostrya carpinifolia Scop., Acer campestre L., Sorbus domestica L., Sorbus torminalis L. (Crantz), Pyrus pyraster L. (Burgsd), Malus sylvestris L. (Mill.) were the most common species in the three treatments; Quercus crenata Lamm., Carpinus betulus L. and Prunus avium L. appeared only in the thinned plots.
The Shannon index (SH) did not show significant differences among silvicultural treatments, though the mean value in the control plots was slightly higher (SH = 1.28) and less variable than that in the other plots. As for the thinned plots, a high mean value and low variability were recorded in the Se treatment (SH = 1.21 vs. 1.11 in Be). The same trend was observed for the oak importance value (IV). All the treatments were characterized by similar index values (IV = 0.60, 0.64, 0.55 in Se, in Co, Be and Se respectively), but the highest variability was observed in the Be plots.
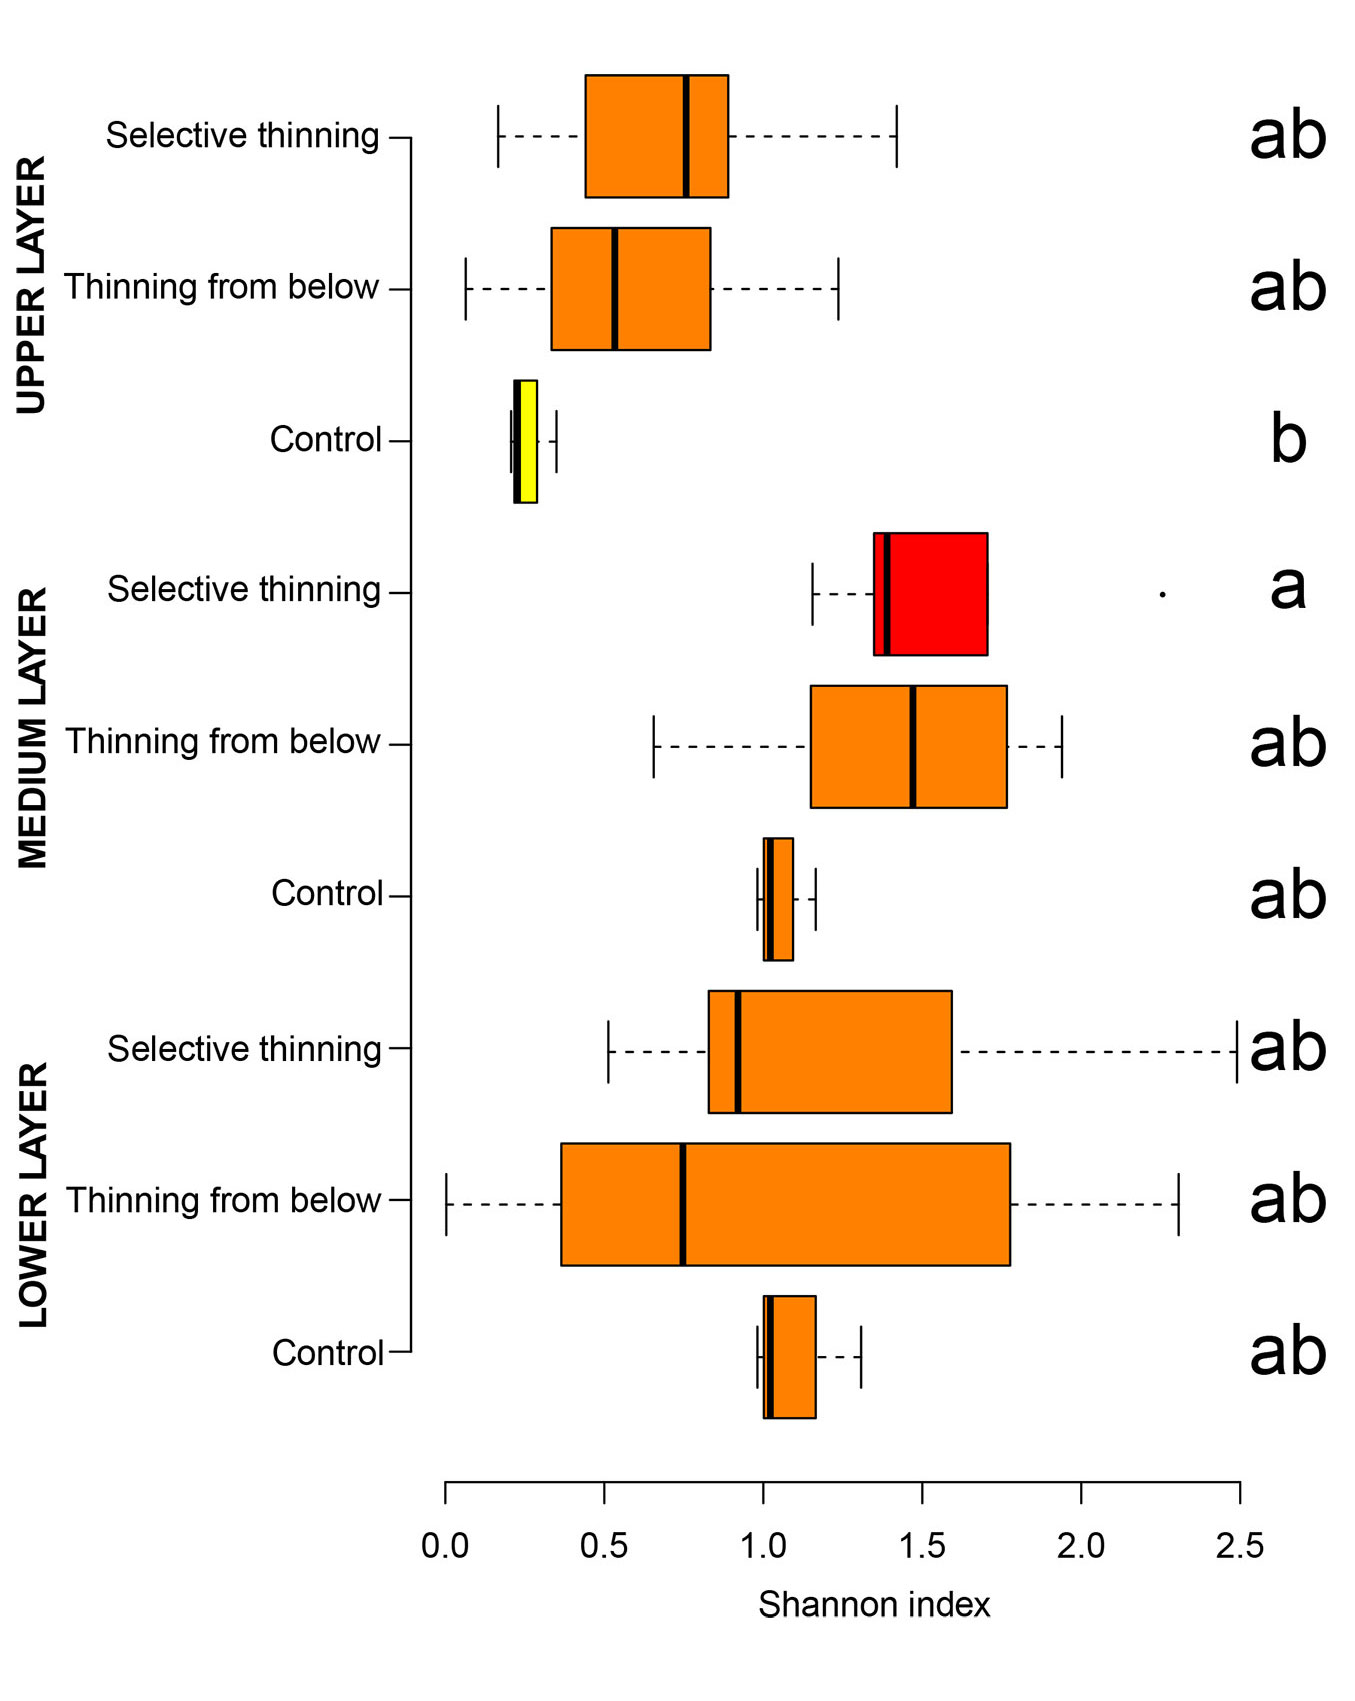
The analysis of SH per tree layer (Fig. 4) did not reveal any significant difference among the treatments, though the Se plots showed values slightly higher than the others treatments. Within the layers, low values of SH were observed in the upper layer (0.21, 0.57, and 0.72 in Co, Be and Se, respectively), while high SH values were recorded in the middle (1.05, 1.39, and 1.54) and lower layers (1.12, 0.99, and 1.24 in Co, Be and Se, respectively).
Fig. 4 - Box-plot of the Shannon index in the different vertical layers per silvicultural treatments. Significant differences (p<0.05) are marked with different letters.
The silvicultural treatment also influenced the relative importance of the other tree species in the different layers. While oak maintained its dominance in the upper layer, the other tree species became prevalent in the middle (M) and lower (L) layers in both Co (IVother M = 0.80, L = 0.99) and Se (IVother M = 0.89, L = 0.99). In the Be plots, good light conditions following thinning allowed Quercus cerris to remain in the middle (IVQc M = 0.31) and lower (IVQc L = 0.22) layers.
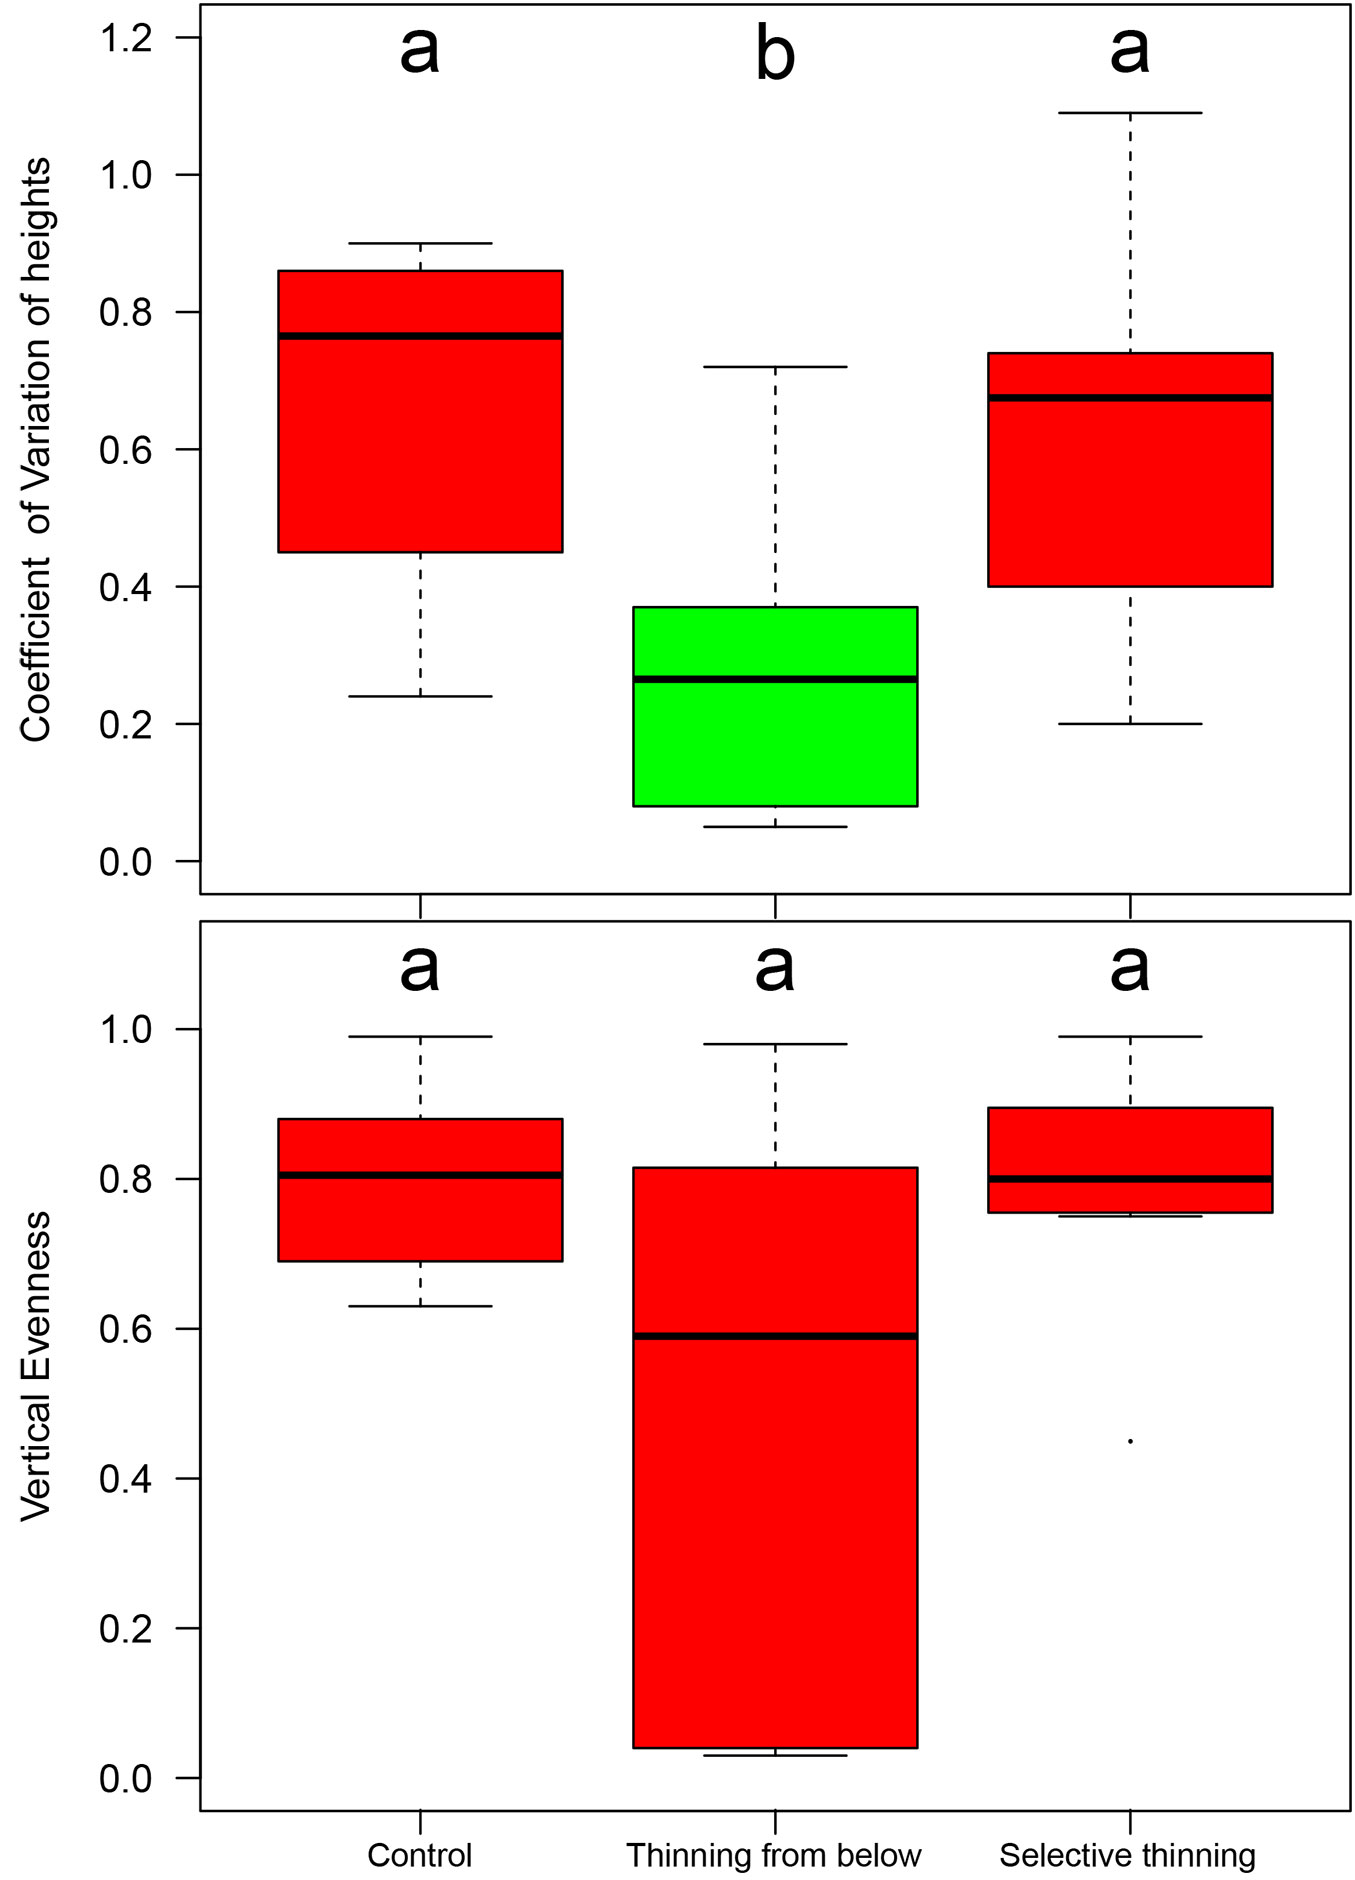
The index describing the stand structural variability within the vertical layers (CV - Fig. 5) highlighted a general homogeneity of tree height values recorded in the Be plots (CV = 0.33) and, in contrast, a high variability in the Co plots (CV = 0.75) and Se (CV = 0.61) plots, with values that were significantly different (p<0.05). The vertical evenness values indicated a well-detectable difference between the control plots and those thinned selectively (VE = 0.83 vs. 0.79, respectively) where the vertical stand structure was multi-layered vs. the two-layered structure in Be (VE = 0.70), due to the presence of a complementary, dominated layer where many new sprouts were grown under the dominant main crop following the applied practices.
Fig. 5 - Box-plots of the coefficient of variation (CV - above) and vertical evenness (VE - below) of tree height in the different silvicultural treatments. Significant differences (p<0.05) are marked with different letters.
The results of multivariate model analysis are reported in Tab. 6. Regardless of the type of treatment, the most significant factors affecting tree biodiversity were the specific richness (accounting for 35.5% of the total variance), site index (14.0%) and vertical stand structure (19.2%). Stand density appeared to have a negative influence on the Shannon index (6.1%). At the same time, the Shannon index (49.9%) and, on a smaller scale (8.0%), the time elapsed since last thinning were the predictors that best explained the differences in vertical structure. The number of trees per hectare (10.5% of variance explained) had a negative influence on vertical evenness.
Tab. 6 - Multivariate model analysis of the selected diversity indices. (df): degrees of freedom; (S) specific richness; (N): tree density (number of tree ha-1); (DH): dominant height; (VE): vertical evenness; (SH): Shannon index.
| Response Variable |
Predictor | Sum of Square |
Explained Variance (%) |
Effect | df | F-value | Prob(>F) |
|---|---|---|---|---|---|---|---|
| Shannon Index | S | 0.889 | 35.52 | + | 1 | 56.705 | 8.24E-07*** |
| N | 0.153 | 6.11 | - | 1 | 9.758 | 0.0006** | |
| DH | 0.350 | 14.01 | + | 1 | 22.366 | 0.0001*** | |
| VE | 0.481 | 19.24 | + | 1 | 30.717 | 3.58E-05*** | |
| Residuals | 0.266 | 10.65 | - | 7 | - | - | |
| Vertical Evenness | Time from last thinning | 0.097 | 7.98 | + | 1 | 8.602 | 0.0085** |
| S | 0.127 | 10.52 | - | 1 | 11.336 | 0.0032** | |
| SH | 0.606 | 49.85 | + | 1 | 53.738 | 5.98E-07*** | |
| Residuals | 0.214 | 17.62 | - | 19 | - | - |
Discussion
Silvicultural choice
Thinning from below had the largest impact on stand structure when compared to the control plots and those under selective thinning, with a negative effect on dimensional variability (Dd-DBH), stand density (N and BA) and vertical structural diversity (CV). In contrast, thinning from below had a positive influence on productivity (CiBA) due to the heavy reduction of competition within all layers.
The selective thinning treatment allowed the maintenance of a high and structured tree species diversity (SH) and improved homogeneity of the vertical structure (VE), although the differences among treatments were not significant. These findings should be considered within the environmental context where the treatments were applied. The studied area is characterized by low elevations and a Mediterranean climate, and these characteristics may favour a high tree specific and vertical diversity. In this context, two different silvicultural goals can be pursued: promote Turkey oak as the main species or favour the establishment of mixed stands, both of which are achievable in the medium and long term by applying thinning from below or selective thinning. A good site index, such as that recorded at all the study sites, is the basic requirement to successfully apply conversion into high forest. The thinning from below is an “easy-to-manage” practice, which involves high removals in terms of number of trees basal area and is therefore economically affordable, thereby leading to uniform stand structures. Moreover, the subsequent cultivation over the full conversion cycle is simplified. The good compositional-structural diversity delayed the age of the first thinning, allowed a high intensity of removals and made it possible to extend the intervals between subsequent thinnings.
Selective thinning, although requiring more attention, was successfully applied because the pre-existing tree specific diversity was composed of valuable tree species. In this case, thinning was applied early enough so as to allow the selection of candidate trees before the occurrence of tree reaction to thinning and the reduction of the commercial value of timber due to inter-individual competition. In general, selective thinning was less intensive than that from below.
Quantitative attributes
The no-management option (control plots) or thinning in the dominant layer (i.e., selective thinning plots) resulted only in an increased tree density, which was significantly different from the density recorded in the thinning from below up to the current stand ages.
Both the maintenance of the dominated layer and the incremental reaction of selected trees led to high basal area values that were comparable to those in the control plots. The low mortality rate within plots thinned from below was due to the early reduction in competition in the main crop layer and the removal of the dominated and overtopped layers. Since high stand productivity is an index of efficiency and effective functionality ([5], [28], [43]), thinning intensity more than thinning type is key for balancing tree density and productivity ([17]).
Tree size structure in terms of mean DBH, dominant diameter, and their difference, is also directly related to the applied thinning type. Thinning from below led to low differences among trees in the stands, while selective thinning maintained an increased stand structural diversity and therefore high differences among trees, as compared to the control treatment. Moreover, the presence of large trees allow the maintenance of a wide diversity of bryophytes and lichens ([23]).
Tree biodiversity
The maintenance/improvement of tree specific diversity is one of the objectives of the conversion of coppices into high forests. This approach was first applied to mountain coppices, where species richness is usually low and Turkey oak has been favoured since long time because more resistant to repeated coppicing, as compared to other species. Later, coppice conversion was applied in piedmont and hilly areas, where the stand composition is more complex and tree specific diversity may improve the adaptability and resilience of stands ([25], [19], [31], [21], [17]).
The results of this study suggest that stand diversity can be deeply affected by site characteristics, such as site index and tree species composition. However, thinning type plays a key role in regulating the tree density and therefore the structural diversity of the stand. Indeed, the heavy reduction in stem number and the vertical simplification due to thinning from below contributed to increase the share of Quercus cerris, thus reducing the Shannon index value in this treatment. The lack of significant differences in diversity among treatments and the higher variability observed in the Be plots are likely due to the time passed since the last thinning (from 1 to 20 years), which allowed the resprouting of the stools and the re-establishment of the lower and middle layers similar to those recorded in Se and Co plots.
Vertical stand structure
Our results show that tree species diversity and the time passed since the last thinning significantly affect the vertical stand structure in Turkey oak coppices. Thinning from below clearly simplified the vertical stand structure, though the prompt resprouting of thinned stools established a subsidiary layer a few years later, thus increasing the structural diversity of the whole stand.
Regarding the selective thinning treatment, the maintenance of the subsidiary layer, as well as the application of localized thinnings around a few valuable selected trees, allowed the conservation of both specific and vertical diversity, where this was a pre-existing feature ([39], [10]).
Conclusions
The parameters and indexes analysed in this study are effective descriptors of the different phases of coppice conversion into high forests. The transitory phase analysed here should aim to enhance the ecological functions of the stands and their ecological value, making use of easily applicable forestry techniques. In the analysed stands, the silvicultural practices applied over the last decades were consistent with the original purposes of either (i) favouring Turkey oak or (ii) setting up mixed, more structured stands.
Turkey oak dominance in the studied coppices may be usefully reduced where other tree species are already present in the transitory phase. The post-coppice cultivation dynamics largely depends on site characteristics and local tree species composition. Wherever present, the dissemination and regeneration of other species should be promoted by suitable silvicultural practices, from selective thinning up to tree-oriented silviculture. Turkey oak-dominated stands may be managed, at least in the first phase, by thinning from below which is easy to implement and economically feasible. Selective thinning may be pursued later when target trees may be confidently identified, with the aim of promoting valuable tree species and favouring their conservation in the next cycles. The release of an adequate canopy cover in the upper layer may control both the resprouting and vitality of cut stools in fire-prone environments.
Natural regeneration in transitory Turkey oak coppices and their timber production are critical issues that are still open and will be approached in the next future.
Acknowledgments
We wish to thank all the technicians of CREA/CRA/ISSEL who have cooperated in the establishment of the monitoring network and in data collection. The authors received no specific funding for this work. The authors declare that no competing interests exist.
References
Gscholar
Gscholar
Gscholar
Gscholar
Gscholar
Gscholar
Gscholar
Gscholar
Gscholar
Gscholar
Gscholar
Gscholar
Gscholar
Gscholar
Gscholar
CrossRef | Gscholar
CrossRef | Gscholar
Gscholar
Gscholar
Gscholar
Gscholar
Gscholar
Authors’ Info
Authors’ Affiliation
Claudia Becagli 0000-0001-5182-2352
Giada Bertini 0000-0003-0882-3127
Paolo Cantiani 0000-0001-8179-2115
Francesco Pelleri 0000-0003-2055-0280
Dalila Sansone
Gianfranco Fabbio 0000-0002-3407-4994
Council for Agricultural Research and Economics, Research Centre for Forestry and Wood (CREA-FL), v.le Santa Margherita 80, I-52100 Arezzo (Italy)
CNR - Institute of Biosciences and BioResources (IBBR), v. Madonna del Piano 10, I-50019 Sesto Fiorentino, FI (Italy)
Corresponding author
Paper Info
Citation
Manetti MC, Becagli C, Bertini G, Cantiani P, Marchi M, Pelleri F, Sansone D, Fabbio G (2020). The conversion into high forest of Turkey oak coppice stands: methods, silviculture and perspectives. iForest 13: 309-317. - doi: 10.3832/ifor3483-013
Academic Editor
Marco Borghetti
Paper history
Received: Oct 10, 2019
Accepted: Apr 30, 2020
First online: Jul 10, 2020
Publication Date: Aug 31, 2020
Publication Time: 2.37 months
Copyright Information
© SISEF - The Italian Society of Silviculture and Forest Ecology 2020
Open Access
This article is distributed under the terms of the Creative Commons Attribution-Non Commercial 4.0 International (https://creativecommons.org/licenses/by-nc/4.0/), which permits unrestricted use, distribution, and reproduction in any medium, provided you give appropriate credit to the original author(s) and the source, provide a link to the Creative Commons license, and indicate if changes were made.

Web Metrics
Breakdown by View Type
Article Usage
Total Article Views: 42992
(from publication date up to now)
Breakdown by View Type
HTML Page Views: 36479
Abstract Page Views: 3128
PDF Downloads: 2540
Citation/Reference Downloads: 9
XML Downloads: 836
Web Metrics
Days since publication: 2212
Overall contacts: 42992
Avg. contacts per week: 136.05
Article Citations
Article citations are based on data periodically collected from the Clarivate Web of Science web site
(last update: Jul 2026)
(No citations were found up to date. Please come back later)
Publication Metrics
by Dimensions ©
Articles citing this article
List of the papers citing this article based on CrossRef Cited-by.
Related Contents
iForest Similar Articles
Research Articles
Modeling of time consumption for selective and situational precommercial thinning in mountain beech forest stands
vol. 14, pp. 137-143 (online: 16 March 2021)
Research Articles
Interactions between thinning and bear damage complicate restoration in coast redwood forests
vol. 13, pp. 1-8 (online: 08 January 2020)
Research Articles
Tree-oriented silviculture: a new approach for coppice stands
vol. 9, pp. 791-800 (online: 04 August 2016)
Research Articles
Impact of thinning on carbon storage of dead organic matter across larch and oak stands in South Korea
vol. 9, pp. 593-598 (online: 01 March 2016)
Research Articles
Long-term outcome of precommercial thinning on floristic diversity in north western New Brunswick, Canada
vol. 1, pp. 145-156 (online: 25 November 2008)
Research Articles
Comparison of alternative harvesting systems for selective thinning in a Mediterranean pine afforestation (Pinus halepensis Mill.) for bioenergy use
vol. 14, pp. 465-472 (online: 16 October 2021)
Research Articles
Long-term effects of thinning and mixing on stand spatial structure: a case study of Chinese fir plantations
vol. 14, pp. 113-121 (online: 08 March 2021)
Research Articles
Early responses of biodiversity indicators to various thinning treatments in mountain beech forests
vol. 11, pp. 609-618 (online: 25 September 2018)
Research Articles
Investigating the effect of selective logging on tree biodiversity and structure of the tropical forests of Papua New Guinea
vol. 9, pp. 475-482 (online: 25 January 2016)
Research Articles
Deriving tree growth models from stand models based on the self-thinning rule of Chinese fir plantations
vol. 15, pp. 1-7 (online: 13 January 2022)
iForest Database Search
Search By Author
Search By Keyword
Google Scholar Search
Citing Articles
Search By Author
Search By Keywords
PubMed Search
Search By Author
Search By Keyword


