Biomass equations for European beech growing on dry sites
iForest - Biogeosciences and Forestry, Volume 9, Issue 5, Pages 751-757 (2016)
doi: https://doi.org/10.3832/ifor1881-009
Published: Jun 17, 2016 - Copyright © 2016 SISEF
Technical Reports
Abstract
Biomass equations for European beech (Fagus sylvatica L.) trees growing on dry sites have not been published, although such equations are needed for a proper estimation of the biomass of beech trees growing naturally at their drought limit in dry forests. We aimed to: (1) develop new allometric above-ground biomass equations for European beech trees growing on dry sites; (2) compare these equations with existing biomass equations. We harvested 86 plants, ranging from saplings to trees, from forest stands on south-facing slopes at 5 locations in Germany and Switzerland. Whole plant weights were measured in the field after felling, and samples from stem, branches and leaves of every harvested plant were brought to the laboratory. We developed diameter- and height-based regression equations for the total above-ground biomass, stem with bark biomass, and biomass of the branches with leaves and further compared them with the existing equations from the literature. Our results showed that the 5 current diameter-based equations available in the literature significantly overestimate the total above-ground biomass, the stem with bark biomass and the biomass of branches and leaves. With increasing tree size, the proportion of the biomass of branches and leaves to the total tree biomass decreased significantly. We also found that the inclusion of height in biomass models did not influence the prediction of total above-ground biomass, but significantly improved the prediction of stem biomass. We recommend that researchers and foresters use the equations developed in this study to quantify the biomass of beech trees growing under similar site conditions.
Keywords
Above-ground Biomass, Stem Biomass, Abandoned Oak Coppiced Forest, Stunted Growth, Plant Size Allometry
Introduction
Coppicing was a common practice in the forests of central Europe. However, it has been gradually declining since the end of World War II ([15], [20]). For example, in Germany relatively young coppiced forests (< 40 years old) located in fertile sites accessible by forest roads have been converted to high forests for timber production in the last few decades ([20]). Today, managed coppiced forests cover only 0.7% of the total forest area of Germany ([2]). Nonetheless, coppiced forests located in commercially unviable and dry sites are abandoned. The area of such abandoned older coppiced forests in Germany is estimated to be several thousand km² ([26]), located mostly in the hilly terrains in the states of Baden-Württemberg, Bavaria, Rhineland-Palatinate and Hesse; the areas are owned by state, private, and community organizations, such as municipalities. The actual area of such forests is difficult to ascertain because most privately owned forests are not inventoried by the National Forest Inventory of Germany. In Switzerland, abandoned coppiced forests dominated by oaks can be found mainly in Jura, Plateau and the Pre-Alps regions. The area of such forests is nearly 5400 ha, 2.4% of the stocked forests in these three regions of Switzerland ([32]).
Sessile (Quercus petraea [Matt.] Liebl.) and downy (Quercus pubescens Wild.) oak commonly dominate the abandoned coppiced forests of central Europe. Nevertheless, due to the cessation of forest management activities in the 1940s, natural succession has been taking place in these stands ([22], [16]). European beech (Fagus sylvatica L.) is one of the most common and dominant tree species in central European forests, with a high level of shade tolerance and a wide-ranging geographic distribution ([8], [2]), growing naturally from seeds under the canopy of oak-dominated abandoned coppiced forests. Natural regeneration of beech trees in oak coppiced forests is more prominent in ecotones where oak coppiced forests and beech-dominated forests overlap on the hillslopes ([22], [16], [12]).
Species-specific biomass equations for trees are vital to accurately estimate the biomass and productivity of forests. Variation in biomass within species occurs due to changes in site quality and management practices ([18], [7]). Site-specific biomass equations for oak trees growing in abandoned aged coppiced forests were recently developed ([26]), but the existing biomass equations for beech trees were mostly established from trees harvested in high forests from moist and fertile sites. The equations were primarily built for codominant and dominant trees, often with DBH (diameter at 1.3-m height) ranging from 7 to 80 cm or more ([33]). However, beech trees growing in abandoned oak coppiced forests on dry, south-facing sites would not reach such dimensions due to the dense oak overstory and low water availability. Biomass equations from beech trees from these types of forests are still lacking in the literature. In this study, we aimed to present new biomass equations (above-ground biomass or “AB”, stem with bark biomass or “ST”, and branch with leaf biomass or “BR”) for European beech trees growing in abandoned oak coppiced forests on dry sites. In addition, we tested how the proportion of stem and branch biomass to the total above-ground biomass changed with tree size in such forests.
Materials and methods
Study sites and management history
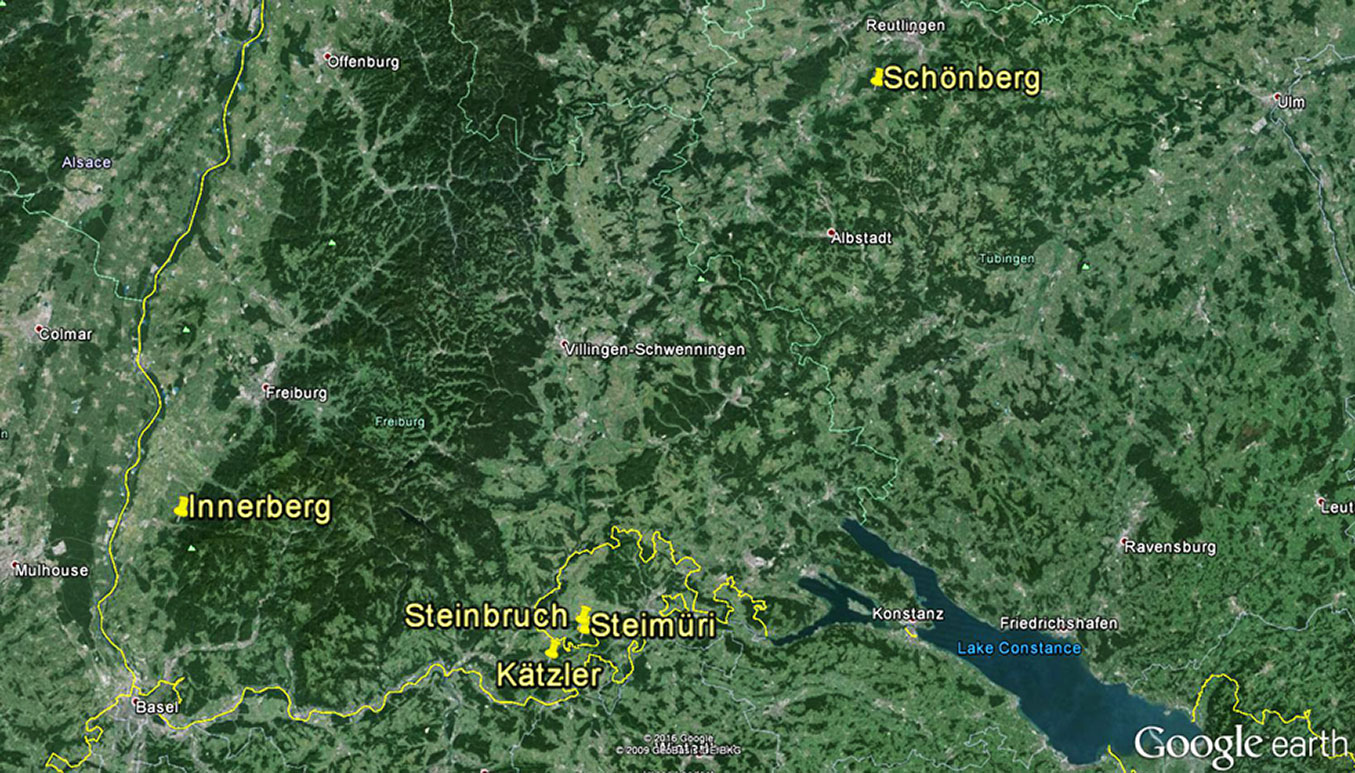
We selected abandoned coppiced forest stands from 5 locations in southern Germany and northern Switzerland (Fig. 1). These five stands were located in southern aspects with slope ranging from 16° to 31°, thus receiving high solar irradiation. The stands had not been commercially managed since the end of World War II, and beech trees were naturally regenerating by seed at their drought limit under the canopy of oaks ([12]). These stands have rendzina soil and were formed on Jurassic limestone (Tab. 1). More detailed description of the sites’ characteristics can be found in Sayer ([22]), Kohler et al. ([16]) and Gärtner et al. ([12]).
Fig. 1 - Locations of the study sites in Germany and Switzerland (yellow pins). Map source: Google Earth®.
Tab. 1 - Description of the study sites. (MAT): mean annual temperature; (MAP): mean annual precipitation; (ASWSC): available soil water storage capacity; (1): as in Gauer & Aldinger ([13]); (2): latitude and longitude are given in decimal degrees.
| Study site |
Stand code |
Region (Growing zone / Growing district) 1 |
Long E Lat N2 |
Altitude1 (m a.s.l.) |
Size1 (ha) |
MAT1 (°C) |
MAP1 (mm) |
Days > 10 °C |
Slope angle1 (°) |
Aspect1 (°) |
ASWSC1 (mm) |
|---|---|---|---|---|---|---|---|---|---|---|---|
| Innerberg (D) |
IN | Oberrheinisches Tiefland und Rhein-Main-Ebene/Markgräflerland |
7.67 47.81 |
524 | 0.9 | 9.7 | 934 | 177 | 23 | 155-180 | 58 |
| Schönberg (D) |
SOB | Schwäbische Alb/Traufzone der Mittleren Alb |
9.12 48.42 |
781 | 0.8 | 7.1 | 1067 | 143 | 31 | 205-243 | 76 |
| Kätzler (D) |
KAT | Südwestdeutsches Alpenvorland/Klettgau |
8.43 47.62 |
566 | 0.3 | 8.6 | 1049 | 164 | 30 | 185-228 | 53 |
| Steimüri (CH) |
SMU | Südwestdeutsches Alpenvorland/Klettgau |
8.50 47.65 |
584 | 0.5 | 8.6 | 1049 | 164 | 24 | 251-280 | 52 |
| Steinbruch (CH) |
SBR | Südwestdeutsches Alpenvorland/Klettgau |
8.50 47.67 |
643 | 0.4 | 8.6 | 1049 | 164 | 16 | 210-220 | 50 |
Sampling design
The average stand size was 0.6 ha, ranging from 0.3 to 0.9 ha. In each stand, at least three 400 m² plots were established, with a total number of 19 plots. We dug soil profiles in each plot to calculate the available soil water storage capacity (ASWSC) and to ascertain the magnitude of dryness in the stand level (see [4] for the ASWSC calculation procedures used). The stand-level mean values of ASWSC in all five forest stands ranged from 50 to 76 mm (Tab. 1). Forest sites having ASWSC in this range were classified as “very dry” to “dry” sites according to the Forest Site Classification of Germany ([24]). In the summers of 2012 and 2013, we inventoried all of the beech saplings and trees growing in those plots. In total, 230 beech saplings and trees were found and inventoried. We classified plants as “saplings” if they were approximately 2 cm in diameter at a 1.3-m height from the ground or thinner in diameter within the height limit of 1.5 m, as reported in the guidelines provided in National Forest Inventory of Germany ([2]). All of the plants taller than 1.5 m with a diameter at 1.3 m (DBH) of more than 2 cm were classified as trees. The dendrometric information of those 230 plants are provided in Tab. S1 (Supplementary material). The 230 plants were further categorized into two size classes: saplings and trees. The diameter measured at root collar (DRC, taken at 5 cm above ground) in saplings ranged from 1.1 to 4.1 cm, whereas the DBH of trees ranged from 2 to 18 cm. Considering this stand-level dendrometric information, we selected 86 plants out of the 230 plants to be harvested for developing the biomass equations. Because the stands were located on dry sites, we observed stunted growth in beech trees and saplings while gathering our inventory data. It is worth noting that Chakraborty et al. ([5]) showed that beech saplings with a DRC of 4.1 cm could be as old as 42 years when growing in dry, south-facing forests. To address the phenomenon of stunted growth, we decided to create two sets of biomass equations for the 86 harvested plants: (1) 20 saplings for which the DRC and height were considered to be the independent variables for biomass model construction and parameter estimation, termed the “DRC category” and designated as “shorter plants”; (2) 66 trees for which DBH and height were considered to be the independent variables for biomass model construction and parameter estimation, termed the “DBH category” and designated as “taller plants”. The range of the DRC and DBH of 86 plants were 1.1-4.1 cm and 2-18 cm, respectively. The mean diameter, height, and height/DRC ratio for the shorter trees were 2 cm, 1.8 m and 89, respectively, with standard deviations of 0.9, 0.8 and 28, respectively; the mean diameter, height, and height/DBH ratio for the taller trees were 8.7 cm, 9 m and 112, respectively, with standard deviations of 4, 3 and 27, respectively (Tab. S2 and Tab. S3 in Supplementary material).
Plant harvesting and weighing in the field and laboratory
After felling, the plant height and height to the crown base (height of the lowest living foliage) was measured. The fresh weight of the whole tree (AB_fresh) was measured directly in the field using a portable spring scale (0.5 kg accuracy). The tree was then separated in two different portions: the main stem with bark and without branches (ST_fresh) and all the branches with leaves (BR_fresh). The fresh weight of ST and BR were measured in the field. Depending on the height, the tree crown was vertically divided into three equal compartments. Sub-samples were collected for further analysis in the following steps: (1) stem disks of a 10-cm length were first cut at 10 cm above ground and then at 1-meter intervals until the tip of the tree; (2) three randomly chosen branches were collected from each of the three vertical crown compartments; and (3) the fresh weight of individual disks and branches was measured in the field using portable electronic scales (accuracy 0.001 kg). Finally, samples collected in the field were brought to the laboratory for an accurate dry biomass calculation by determining the moisture content.
Collected disks were weighed after drying in the oven at 105 °C until a constant weight was achieved. Similarly, sample branches with leaves were chipped and dried in oven at 105 °C. The dry weight of the nth stem (STn) or branch (BRn) was calculated as follows (eqn. 1):
where TDW and TFW are the total dry weight and the total fresh weight, respectively, and Xdry and Xfresh are the dry and fresh weights of the stem (ST) or branch (BR), respectively. Finally, the total above-ground biomass of each of the 86 plants were calculated as the sum of the dry weights of stems with bark and branches including leaves (Tab. S2 and Tab. S3 in Supplementary material).
Parameterization of biomass models and statistical analysis
The biomass models were developed, compared, and validated in four consecutive steps:
- we developed diameter-based biomass equations (separately for fresh and dry biomass) based on the power function that is commonly used to estimate biomass: Y = a · Db, where Y is the biomass, D is either the DBH or DRC, and a and b are the model constant and coefficient, respectively. The biomass predicted from DBH-based models was used to compare the existing biomass equations of beech trees. We found five published equations for European beech trees ([1], [6], [19], [21], [25]). We selected equations from literature that covered the DBH range of the European beech trees harvested in this study (2-18 cm);
- we log transformed DRC, DBH and biomass to remove heteroscedasticity and nonlinear trends in the data. We performed linear regression analysis to develop biomass equations using biomass as a function of DBH or DRC;
- we added the height of the tree as a covariate in the equations, even though the tree heights were correlated with their respective diameters (see Fig. S1 in Supplementary material); however, we decided to use both variables in the estimation of biomass and volume because the deviation between these variables may vary with age, site quality, stand composition and density;
- finally, we calculated the root mean squared error (RMSE) for both equations (i.e., with or without tree heights). RMSE indicates the unexplained variation between modelled and observed values for the smallest to largest trees of the entire population. The equation with the lowest RMSE and highest adjusted R² values provides the best prediction.
The equations were validated by comparing modelled vs. observed values. The Shapiro-Wilk test was used to verify whether the data followed the normal distribution. Nonparametric tests, such as Spearman’s ρ correlation analysis and the Wilcoxon’s signed rank test, were used when the data were not normally distributed. Otherwise, Pearson’s r correlation analysis and pair-sampled t-test were used. The equations were accepted when modelled and observed values in biomass did not differ significantly. Statistical analyses were performed by statistical package SPSS v. 20.0 ([14]).
Results
DRC- and DBH-based biomass equations
In all of the allometric equations for fresh and dry biomass calculated for the DRC category, the adjusted R2 values were significantly high (adj-R2 ≥ 0.7 - Tab. 2). The predicted biomass values were not significantly different from the observed ones (Wilcoxon signed-rank test - Tab. S4 in Supplementary material). The adjusted R2 values were significantly high (adj-R2 ≥ 0.8) for all of the allometric equations for fresh and dry biomass in trees where the DBH was used as biomass predictor (Tab. 3). Again, the predicted biomass values were not significantly different from the observed ones (Wilcoxon signed-rank test - Tab. S5 in Supplementary material). When we studied the relationship between the fresh and dry biomass weights in each trunk compartment, significantly high positive correlations were found between all dry and fresh equations for both the DRC and DBH categories (Tab. S6 in Supplementary material). The moisture content per compartment was calculated from the fresh and respective dry weights of the sub-samples that were brought to the laboratory from the field. The highest amount of moisture content was found in the BR (DBH category: 47.7%, DRC category: 48.7%), followed by the AB (DBH category: 40.8%, DRC category: 44.6%) and ST sections (DBH category: 37.5%, DRC category: 38.4%).
Tab. 2 - Allometric equations (for the DRC category) for predicting fresh and dry biomass for different trunk compartments as well as for the total above-ground fresh and dry biomass for beech saplings growing on dry sites. All the models are based on the power function equation: biomass (kg) = a · DRCb. (AB): total above-ground biomass; (ST): stem with bark biomass; (BR): branch biomass including foliage; (SE a): standard error of coefficient a; (SE b): standard error of coefficient b.
| Biomass component |
Equation | Coefficients | Adj-R² | P-value | N | |||
|---|---|---|---|---|---|---|---|---|
| a | SE a | b | SE b | |||||
| AB | Fresh | 0.073 | 0.014 | 2.415 | 0.244 | 0.84 | < 0.001 | 20 |
| Dry | 0.04 | 0.008 | 2.408 | 0.248 | 0.83 | < 0.001 | 20 | |
| ST | Fresh | 0.027 | 0.006 | 2.412 | 0.304 | 0.77 | < 0.001 | 20 |
| Dry | 0.019 | 0.005 | 2.199 | 0.317 | 0.71 | < 0.001 | 20 | |
| BR | Fresh | 0.043 | 0.01 | 2.408 | 0.295 | 0.78 | < 0.001 | 20 |
| Dry | 0.02 | 0.005 | 2.533 | 0.312 | 0.77 | < 0.001 | 20 | |
Tab. 3 - Allometric equations (for the DBH category) for predicting fresh and dry biomass for different trunk compartments as well as for the total above-ground dry and fresh biomass for beech trees growing on dry sites. All of models are based on the power function equation: biomass (kg) = a · DBHb. (AB): total above-ground biomass; (ST): stem biomass with bark; (BR): branch biomass including foliage; (SE a): standard error of coefficient a; (SE b): standard error of coefficient b.
| Biomass component |
Equation | Coefficients | Adj-R² | P-value | N | |||
|---|---|---|---|---|---|---|---|---|
| a | SE a | b | SE b | |||||
| AB | Fresh | 0.353 | 0.052 | 2.154 | 0.070 | 0.94 | < 0.001 | 66 |
| Dry | 0.201 | 0.029 | 2.173 | 0.068 | 0.94 | < 0.001 | 66 | |
| ST | Fresh | 0.159 | 0.021 | 2.346 | 0.062 | 0.96 | < 0.001 | 66 |
| Dry | 0.100 | 0.013 | 2.343 | 0.063 | 0.96 | < 0.001 | 66 | |
| BR | Fresh | 0.233 | 0.056 | 1.781 | 0.113 | 0.79 | < 0.001 | 66 |
| Dry | 0.123 | 0.029 | 1.776 | 0.112 | 0.79 | < 0.001 | 66 | |
Biomass equations based DBH, DRC and height
The log transformed allometric biomass equations based on DBH, DRC and height are presented in Tab. 4. Overall, adjusted R² was higher in above-ground (AB) and stem biomass (ST) equations when both DBH and height were included as independent variables, compared to those equations based solely on DBH. The root mean squared errors (RMSE) in the AB and ST equations were lower when DBH and height were included in the biomass equations than in the biomass equations based solely on DBH. However, the adjusted R² and RMSE did not differ between the DBH- and DBH-and-height-based equations for estimating branch biomass (Tab. 4). A similar trend (high adjusted R² and low RMSE) was found in saplings (DRC category) for estimating above-ground and stem biomass when the height and DRC of saplings were included in the model, but this trend was not found in the estimation of branch biomass of saplings (Tab. 4). The slight increase in model precision (1% lower values of RMSE) due to the inclusion of height did not influence the biomass prediction, and as a result, the observed and modelled values from diameter- and diameter-and-height-based models did not differ significantly, except in stem biomass for trees (DBH category) where the inclusion of height significantly reduced the difference between observed and modelled values (Tab. S7 in Supplementary material).
Tab. 4 - Biomass equations developed by linear regression using log-transformed data. Two sets of equations are presented, with and without the inclusion of height. Lower root mean squared error (RMSE) and higher adjusted R² indicate higher precision of the models in predicting biomass. (SE a): standard error of coefficient a; (SE b): standard error of coefficient b; (const.): model constant.
| Indep. variable |
Eqn no |
Target variable | Equation | a | b | const. | SE a |
SE b |
RMSE | N | Adj-R² | p-value |
|---|---|---|---|---|---|---|---|---|---|---|---|---|
| DBH | 1 | Total above-ground biomass (AB) | Log(AB) = 2.173·Log(DBH) - 0.697 |
2.173 | - | -0.697 | 0.068 | - | 0.12 | 66 | 0.94 | <0.001 |
| 2 | Stem biomass (ST) | Log(ST) = 2.361·Log(DBH) - 1.011 |
2.361 | - | -1.011 | 0.068 | - | 0.12 | 66 | 0.95 | <0.001 | |
| 3 | Branch biomass (BR) | Log(BR) = 1.776·Log(DBH) - 0.912 |
1.776 | - | -0.912 | 0.112 | - | 0.20 | 66 | 0.79 | <0.001 | |
| DBH, height |
4 | Total above-ground biomass (AB) | Log(AB) = 1.711·Log(DBH) + 0.680·Log(Height) - 0.918 | 1.711 | 0.680 | -0.918 | 0.152 | 0.203 | 0.11 | 66 | 0.95 | <0.001 |
| 5 | Stem biomass (ST) | Log(ST) = 1.654·Log(DBH) + 1.040·Log(Height) - 1.334 | 1.654 | 1.040 | -1.334 | 0.132 | 0.176 | 0.10 | 66 | 0.97 | <0.001 | |
| 6 | Branch biomass (BR) | Log(BR) = 1.775·Log(DBH) + 0.002·Log(Height) - 0.912 | 1.775 | 0.002 | -0.912 | 0.272 | 0.364 | 0.20 | 66 | 0.79 | <0.001 | |
| DRC | 7 | Total above-ground biomass (AB) | Log(AB) = 2.405·Log(DRC) - 1.396 |
2.405 | - | -1.396 | 0.083 | - | 0.10 | 20 | 0.83 | <0.001 |
| 8 | Stem biomass (ST) | Log(ST) = 2.201·Log(DRC) - 1.723 |
2.201 | - | -1.723 | 0.317 | - | 0.13 | 20 | 0.71 | <0.001 | |
| 9 | Branch biomass (BR) | Log(BR) = 2.524·Log(DRC) - 1.698 |
2.524 | - | -1.698 | 0.316 | - | 0.13 | 20 | 0.77 | <0.001 | |
| DRC, height |
10 | Total above-ground biomass (AB) | Log(AB) = 1.752·Log(DRC) + 0.659·Log(Height) - 1.353 | 1.752 | 0.659 | -1.353 | 0.373 | 0.299 | 0.09 | 20 | 0.86 | <0.001 |
| 11 | Stem biomass (ST) | Log(ST) = 0.944·Log(DRC) + 1.269·Log(Height) - 1.641 | 0.944 | 1.269 | -1.641 | 0.371 | 0.297 | 0.09 | 20 | 0.86 | <0.001 | |
| 12 | Branch biomass (BR) | Log(BR) = 2.368·Log(DRC) + 0.157·Log(Height) - 1.688 | 2.368 | 0.157 | -1.688 | 0.532 | 0.436 | 0.13 | 20 | 0.75 | <0.001 |
Proportions of stem and branch biomass in relation to tree size
The proportions of stem (ST) and branch (BR) biomass to the total above-ground biomass (AB) were assessed from the sampled plants. Taller plants had 71% stem biomass and 29% branch biomass, whereas shorter plants had 44% stem biomass and 56% branch biomass. We found a significant negative correlation between the DBH and proportion of BR biomass for taller plants (Pearson’s r = -0.575, N = 66, p < 0.001). This implies that leaf and branch biomass decrease with increasing tree size. However, such a dependency on diameter was not observed in shorter plants (Spearman’s ρ = 0.127, N = 20, p > 0.05).
Comparisons of DBH based biomass equations with published equations
The equations for the dry biomass of taller plants (DBH category) were compared with published equations for different compartments: total above-ground biomass, stem biomass, and biomass of branches and foliage (Fig. 2). We found that for the total above-ground biomass (AB), all of the equations from past studies ([1], [6], [19], [21], [25]) significantly overestimated the biomass for the beech trees used in this study (Fig. 3, Tab. S8 in Supplementary material). The slope of the equations indicated that with an increase in DBH, the overestimation by previously published equations became higher.
Fig. 2 - Relationships between DBH and dry biomass in this study and previous studies for above-ground biomass (a) stem biomass (b), and biomass of branches and foliage (c).
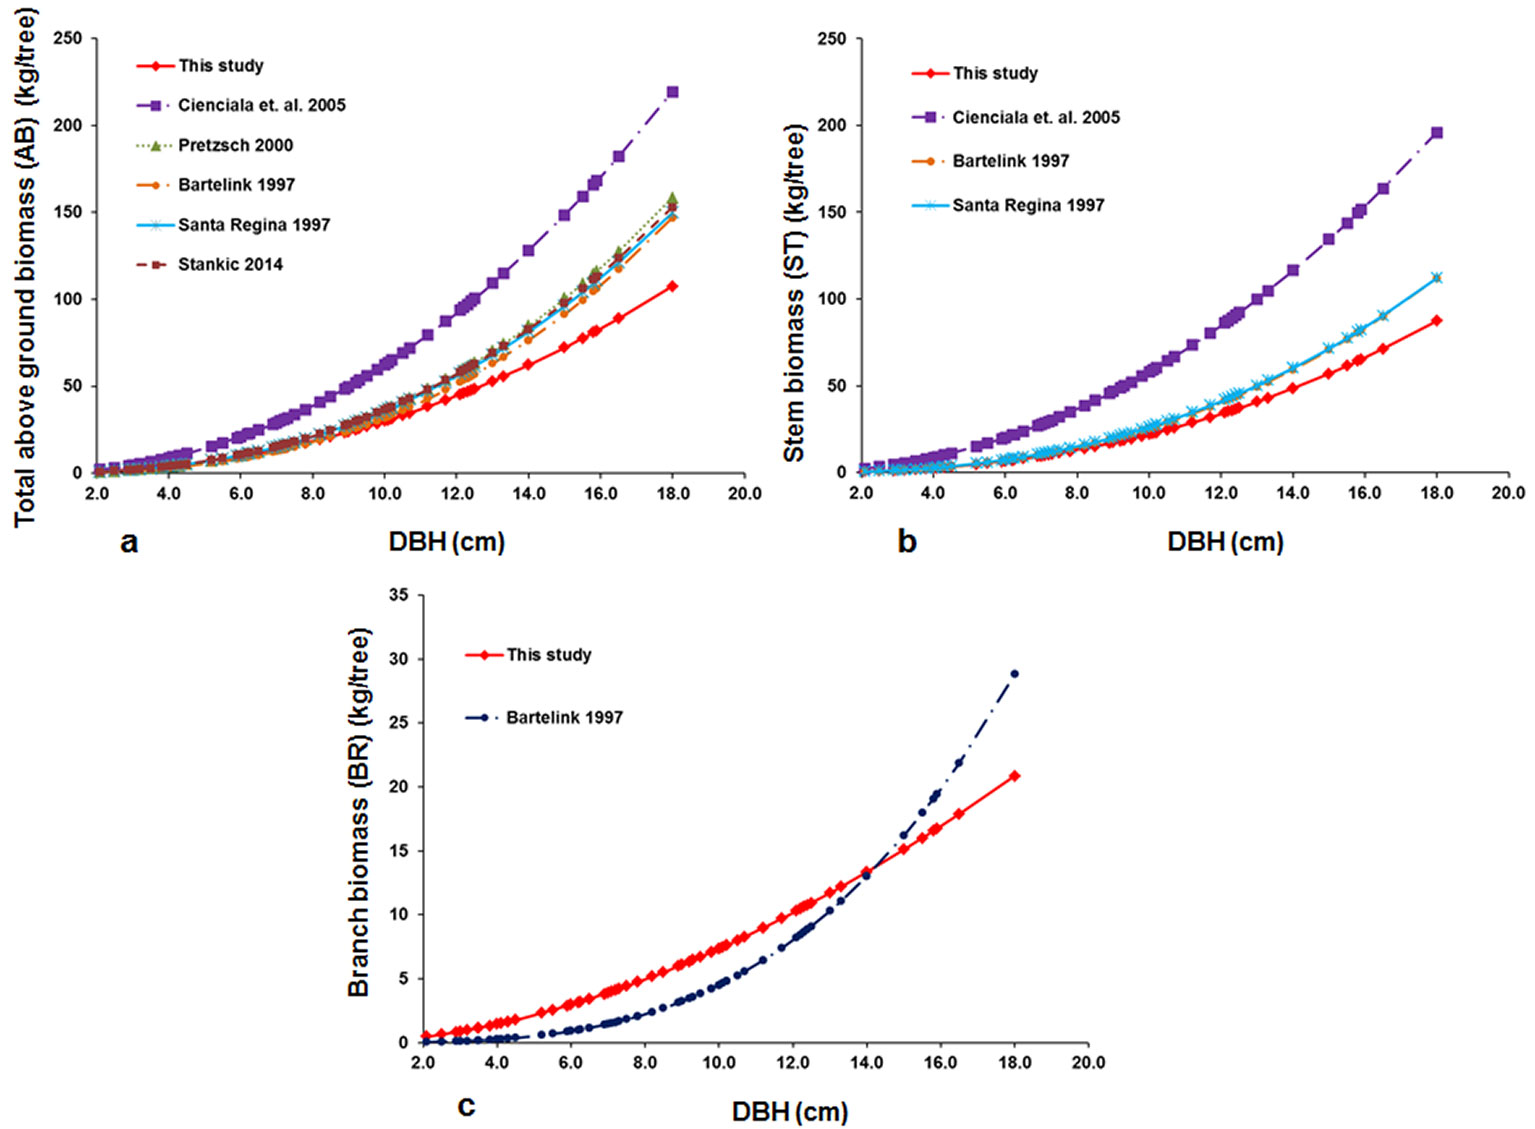
Fig. 3 - Differences between modelled values, observed values and biomass calculated from past studies for dry above-ground biomass (a), dry stem biomass (b), and biomass of dry branches and foliage (c). Line bars indicate the standard error of medians with a 95% confidence interval. Stars indicate significant differences (p < 0.05) after Wilcoxon signed-rank test.
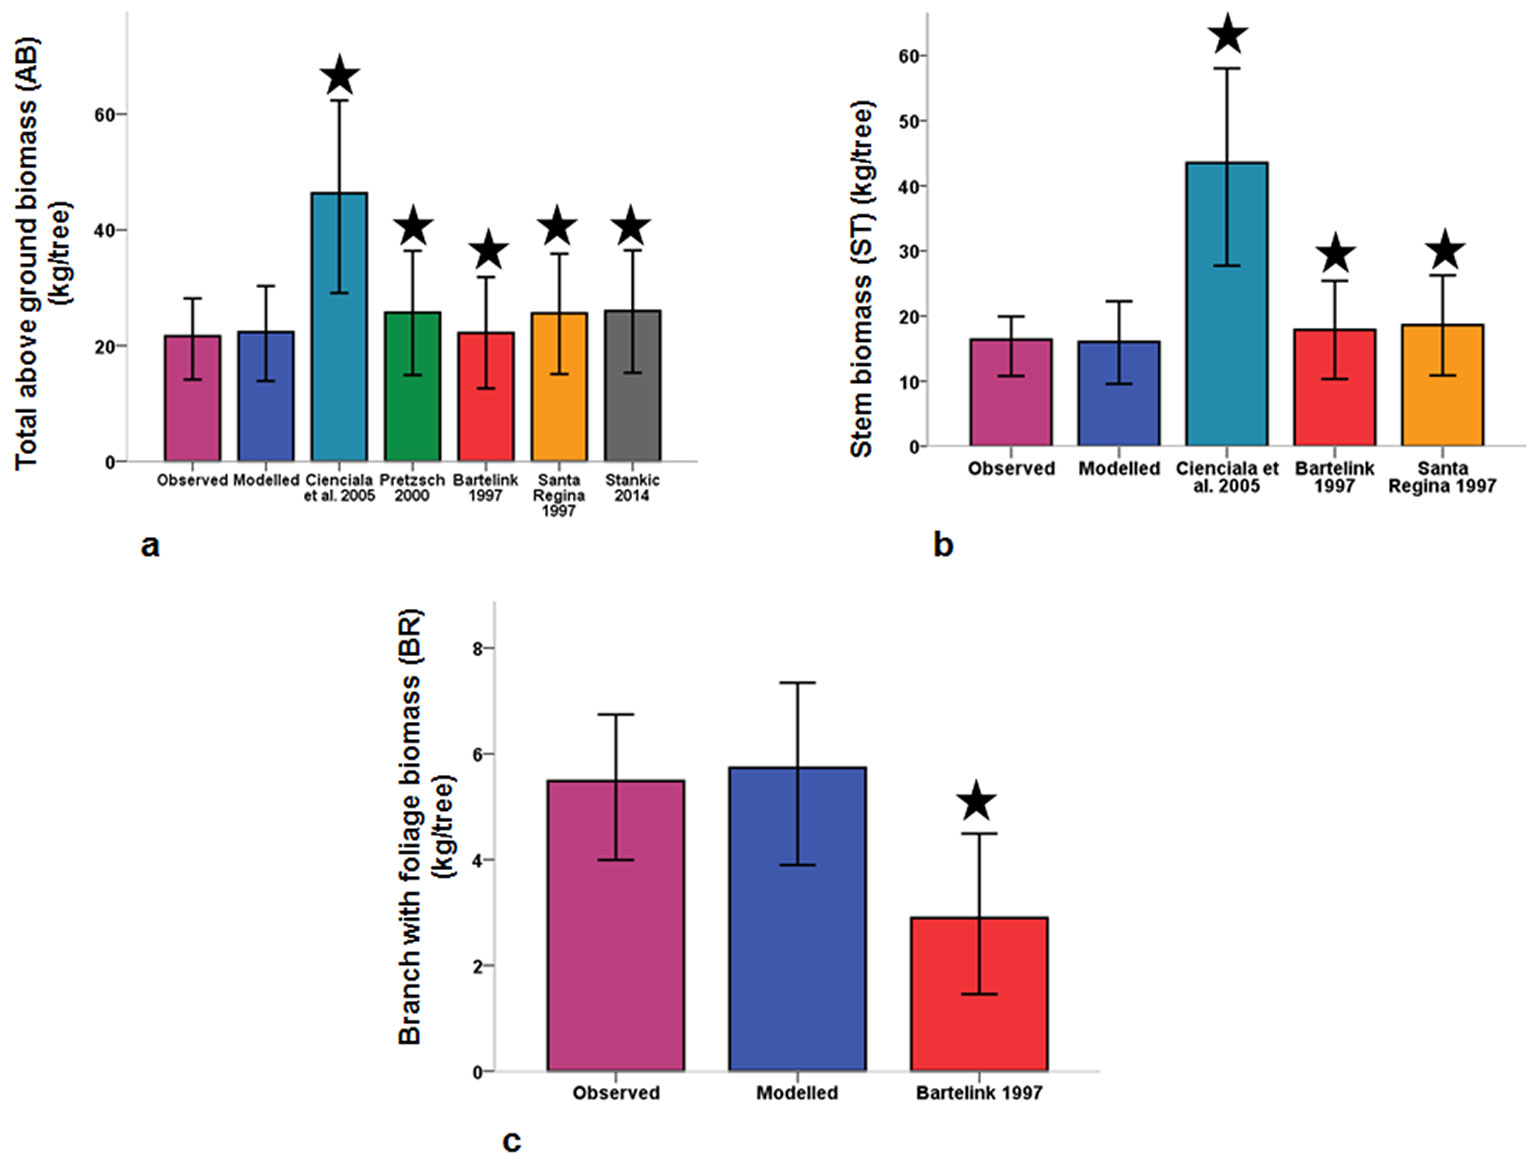
For the stem biomass, the equations from past studies ([1], [6], [21]) also overestimated the biomass. Similar to AB, as DBH increased, this overestimation in stem biomass became significantly higher (Fig. 3, Tab. S8 in Supplementary material). In the dry branch biomass model, the only published equation by Bartelink ([1]) underestimated the biomass until a certain diameter, and then overestimated the biomass of larger trees (Fig. 3, Tab. S8 in Supplementary material).
Discussion
We showed that the predicted beech biomass from the equations developed in this study for dry sites differed significantly from the biomass calculated from the existing published equations. Two different trunk compartment-related equations of “stem with bark” and “branch with foliage” differed from the existing equations in the literature. All of the published equations used for the total above-ground biomass calculation for the plants in this study significantly overestimated the biomass when applied to dry sites. The stunted growth of the beech trees growing in dry south-facing hill slopes reduced the overall volume of the trees and therefore decreased the biomass. This supports the results of a previous work ([5]) studying the growth of beech saplings and trees on a dry south-facing outcrop in the Black Forest near the city of Freiburg (Germany).
In general, the stem was the main portion contributing to the above-ground biomass. This supports the results of previous studies on beech trees ([6], [1], [21]). However, this trend changed with the size of the trees. In shorter plants, branches with green foliage contributed a significantly higher amount of biomass, with a gradual decline observed in taller plants, contrary to the results of a study by Bartelink ([1]). All five forest stands were located on dry, south-facing hill slopes where beech trees were regenerating in old coppiced oak stands near their drought limit. Taller beech trees might have shed their branches and leaves to adjust the proportion of above- and below-ground biomass as a survival strategy under drought stress in dry sites, as well as to foster vertical growth to compete for light in the canopy layer. The high height-to-diameter ratio of 112 in taller plants also supports this phenomenon. Conversely, shorter beech saplings had stunted growth (i.e., low height-to-diameter ratio of 89) and might have preferred more radial stem growth and lateral branch growth to capture light than shoot elongation. For shorter plants, it was profitable to maintain a shorter height for longer periods to optimize the water supply to the top and to reduce the vulnerability of xylem to cavitation due to hydraulic failure in dry sites. Chakraborty et al. ([5]) reported that the beech saplings growing under the canopy of oak trees in dry sites can prolong their sapling stage for decades to avoid drought-induced mortality. Maintenance of such stunted growth in beech trees was possible because their high tolerance to shade allowed the plants to endure drought stress ([28], [17], [8]).
Site-specific adaptation as described above usually occurs in tree species to optimize the use of water and light resources ([23]) that eventually influence tree morphological traits (e.g., trees become stunted). Such adaptations at the level of the autecology of species influence the synecology of environmentally stressed forest ecosystems ([11]) and alter individual trees, as well as the stand biomass. Previous biomass equations developed for beech trees from high forests are not suited to capture this morphological adaptation of trees at similar age growing on dry rendzina soil.
In the first section of our model building, we used a power function. Use of a power function to scale the diameter to the biomass relationship supports the West, Brown and Enquist model (WBE model) of general plant allometry ([10], [9], [3], [29], [30], [31]). The WBE model showed that the diameter and biomass allometry of 73 temperate tree species had an average power component (i.e., parameter b in Tab. 2 and Tab. 3) of 2.611 and hence follow the 8/3 rule. In this study, the value of this component was 2.408 and 2.173 for the DRC and DBH categories, respectively (Tab. 2 and Tab. 3). This shows that in shorter and stunted beech plants (the DRC category), the allometry of biomass and size tends to be closer to the overall value of 2.611, as a slower shoot elongation was compensated by lateral growth of the branches. However, in taller plants, the value of this component was 17% lower than the overall value, possibly the result of a low proportion of branch and foliage biomass. Thus, our results support the evidence that European beech trees growing in drier sites deviate from the temperate allometric relationship of tree size and biomass and may not always follow the above-mentioned 8/3 rule.
The inclusion of height in log transformed linear models did not influence the predictions for overall above-ground biomass and branch biomass. However, it did improve the estimation of stem biomass. This outcome is reasonable for stem biomass because tree height and stem taper are correlated and might be influenced by stand density, species composition, tree social class and site quality.
Conclusions
Within the context of central European forests, the biomass equations developed for beech trees growing in dry sites in this study may be very useful to researchers and foresters for the accurate quantification of the biomass of beech trees. Particularly, these equations can be used for beech trees growing under oak forests in dry sites where the size of trees is relatively smaller due to stunted growth, rather than trees growing in fertile and well-drained sites. Such forest stands can be found on the hilly slopes with calcareous rendzina soils in southern Germany, in the plateau regions of Switzerland and in the Jura and Vosges mountains of France where beech is one of the important tree species establishing in abandoned oak forests. These forest stands are not commercially managed today due to lower financial profitability; hence, they are often left for protection to fulfill biodiversity conservation and climate change mitigation goals. Biomass equations from productive and high forests are being used for stunted beech trees growing on dry sites due to the unavailability of proper site-specific equations. Therefore, our equations for beech trees will ensure proper accounting of the carbon stocks in forest stands from similar sites. Tree diameter can be used as the main independent variable for calculating the total above-ground biomass and the biomass of branches and foliage, although the tree height should be considered in the case of stem biomass. In addition to DBH-based equations, we developed novel DRC-based biomass equation for understory beech plants. Previous studies on beech biomass ignored the young beech plants of the forest regeneration layer but several European countries, such as Germany, France, Italy, Switzerland and Sweden, emphasized the recording of size and frequency data for trees growing in the regeneration layer during the National Forest Inventory, necessitating the development of species-specific DRC-based biomass equations ([27]). The DRC-based equations developed in this study would also allow for exact estimations of biomass for beech plants with stunted growth, a common phenomenon in dry forest sites. In conclusion, the fundamental allometric relationship between tree size and biomass could be influenced by the site level factors (e.g., poor available soil water storage capacity), warranting future research on other tree species with wide habitat ranges similar to that of European beech.
Acknowledgments
We gratefully acknowledge the Heinrich Böll Foundation for awarding a PhD scholarship to TC (grant number: P040244). We are also thankful to: the Environment, Society and Global Change Graduate School of the University of Freiburg; to the Müller Fahnnenberg Foundation of the University of Freiburg, Wissenschaftlische Gesellschaft Freiburg; to the GFH Foundation Freiburg, to the Georg Ludwig Hartig Foundation, and to BLNN Freiburg for providing financial support to TC to undertake field and laboratory works. We are thankful to Georgios Skiadaresis, Nicolas Schoof and Jan Heckmann for assisting in field data collection, tree harvesting, transportation of samples and laboratory analysis. We sincerely thank the forest and municipal administrations of Müllheim, Öschingen-Mössingen, Klettgau in Baden-Württemberg, Germany and Wilchingen in Canton Schaffhausen, Switzerland for providing permission for the tree felling to conduct this research. We are thankful to two anonymous reviewers for providing valuable suggestions to improve the previous version of the manuscript.
TC and AR jointly developed the research concept and study designs. TC collected field data, performed all laboratory and statistical analyses and wrote the manuscript. SS helped in field data collection and provided useful suggestions in this research. SS and AR commented on a preliminary version of this manuscript.
References
Gscholar
Gscholar
Gscholar
Gscholar
Gscholar
Gscholar
Gscholar
Gscholar
Gscholar
Gscholar
Gscholar
Gscholar
Gscholar
Gscholar
Gscholar
Authors’ Info
Authors’ Affiliation
Albert Reif
Chair of Vegetation Science, Faculty of Environment and Natural Resources, University of Freiburg, Tennenbacherstr. 4, D-79085 Freiburg (Germany)
Chair of Silviculture, Faculty of Environment and Natural Resources, University of Freiburg, Tennenbacherstr. 4, D-79085 Freiburg (Germany)
Corresponding author
Paper Info
Citation
Chakraborty T, Saha S, Reif A (2016). Biomass equations for European beech growing on dry sites. iForest 9: 751-757. - doi: 10.3832/ifor1881-009
Academic Editor
Giorgio Alberti
Paper history
Received: Sep 21, 2015
Accepted: Mar 30, 2016
First online: Jun 17, 2016
Publication Date: Oct 13, 2016
Publication Time: 2.63 months
Copyright Information
© SISEF - The Italian Society of Silviculture and Forest Ecology 2016
Open Access
This article is distributed under the terms of the Creative Commons Attribution-Non Commercial 4.0 International (https://creativecommons.org/licenses/by-nc/4.0/), which permits unrestricted use, distribution, and reproduction in any medium, provided you give appropriate credit to the original author(s) and the source, provide a link to the Creative Commons license, and indicate if changes were made.

Web Metrics
Breakdown by View Type
Article Usage
Total Article Views: 52855
(from publication date up to now)
Breakdown by View Type
HTML Page Views: 44001
Abstract Page Views: 3143
PDF Downloads: 4427
Citation/Reference Downloads: 42
XML Downloads: 1242
Web Metrics
Days since publication: 3319
Overall contacts: 52855
Avg. contacts per week: 111.47
Article Citations
Article citations are based on data periodically collected from the Clarivate Web of Science web site
(last update: Mar 2025)
Total number of cites (since 2016): 10
Average cites per year: 1.00
Publication Metrics
by Dimensions ©
Articles citing this article
List of the papers citing this article based on CrossRef Cited-by.
Related Contents
iForest Similar Articles
Research Articles
Estimation of above-ground biomass and sequestered carbon of Taurus Cedar (Cedrus libani L.) in Antalya, Turkey
vol. 6, pp. 278-284 (online: 01 July 2013)
Research Articles
Effects of planting density on the distribution of biomass in a douglas-fir plantation in southern Italy
vol. 8, pp. 368-376 (online: 09 September 2014)
Research Articles
Allometric relationships for predicting the stem volume in a Dalbergia sissoo Roxb. plantation in Bangladesh
vol. 3, pp. 153-158 (online: 15 November 2010)
Research Articles
Aboveground tree biomass of Araucaria araucana in southern Chile: measurements and multi-objective optimization of biomass models
vol. 14, pp. 61-70 (online: 09 February 2021)
Research Articles
On the geometry and allometry of big-buttressed trees - a challenge for forest monitoring: new insights from 3D-modeling with terrestrial laser scanning
vol. 8, pp. 574-581 (online: 02 March 2015)
Research Articles
Estimation of aboveground forest biomass in Galicia (NW Spain) by the combined use of LiDAR, LANDSAT ETM+ and National Forest Inventory data
vol. 10, pp. 590-596 (online: 15 May 2017)
Research Articles
High resolution biomass mapping in tropical forests with LiDAR-derived Digital Models: Poás Volcano National Park (Costa Rica)
vol. 10, pp. 259-266 (online: 23 February 2017)
Short Communications
Biomass production of young lodgepole pine (Pinus contorta var. latifolia) stands in Latvia
vol. 6, pp. 10-14 (online: 14 January 2013)
Research Articles
Estimation of forest biomass components using airborne LiDAR and multispectral sensors
vol. 12, pp. 207-213 (online: 25 April 2019)
Research Articles
Allometric equations to estimate above-ground biomass of small-diameter mixed tree species in secondary tropical forests
vol. 13, pp. 165-174 (online: 02 May 2020)
iForest Database Search
Search By Author
Search By Keyword
Google Scholar Search
Citing Articles
Search By Author
Search By Keywords
PubMed Search
Search By Author
Search By Keyword


