Aboveground tree biomass of Araucaria araucana in southern Chile: measurements and multi-objective optimization of biomass models
iForest - Biogeosciences and Forestry, Volume 14, Issue 1, Pages 61-70 (2021)
doi: https://doi.org/10.3832/ifor3492-013
Published: Feb 09, 2021 - Copyright © 2021 SISEF
Research Articles
Abstract
Estimating carbon stocks in wooded systems is crucial to quantify national greenhouse gas balance estimates. However, inaccurate estimates are likely due to the divergent architecture of many species. The monkey puzzle tree Araucaria araucana, with its umbrella-like architecture is a vivid example. This species, often found in monodominant stands at high elevations, is the greatest carbon reservoir in the landscape, hence estimating its carbon storage is crucial. To provide the necessary basis for these estimations, we documented the variation in basic density and moisture content along the stem profile, identified the most suitable biomass estimation models, and quantified biomass allocation for three age ranges. We measured, felled, weighed, and separated trees into three categories: stem wood, stem bark, and foliage (branches + scaly leaves). The log-linear form of the simple allometric equation Y = aXb, based on diameter at breast height as the explanatory variable, covered a large part of the variation and showed good cross-validation performance (>0.96). Models using more covariates achieved lower absolute errors, but the estimation of the additional model parameters was associated with greater uncertainty. A multi-objective model comparison revealed that the best additional covariate to further improve biomass estimation was total tree height. The mean absolute percentage error was 9.8% for the total aboveground biomass, 8% for stem wood, 12% for stem bark and 24% for foliage. Changes in biomass distribution among tree components were related to age. For older trees, there was a relative increase in stem wood, a decreased proportion of foliage, but no change in stem bark. The proportion of stem bark biomass is similar to that of Araucaria angustifolia, but higher than in other conifers and most trees in general. Our results provide key properties for A. araucana and general guidance for the selection of easily-measurable variables allowing for excellent predictive power for local biomass estimation.
Keywords
Monkey Puzzle Tree, Carbon Stocks, Forest Modelling, Multicriteria Optimization, Allometry
Introduction
Accurate estimates of aboveground biomass are essential for a wide range of studies including carbon and nutrient cycling and global climate change. Aboveground biomass is often inferred via allometric equations or biomass estimation models (BEM) which relate biomass to more readily measurable attributes such as diameter at breast height, total height or crown dimensions ([10]). Many species have relatively similar habits, thus there is some justification for applying BEMs developed for one species to similar ones ([15]). However, trees with uncommon habits can be significant contributors to landscape carbon storage, and the lack of appropriate BEMs stands in the way of generating trustworthy estimates for these species. With its umbrella-like appearance (Fig. S1 in Supplementary material), the monkey puzzle tree (Araucaria araucana [Mol.] K. Koch.) is a vivid example. This species is mainly found in large areas of highland woodland along a large latitudinal gradient spanning Chile and Argentina. With its abundance and often massive size, A. araucana is a major or in most cases the main contributor of forest biomass. The monkey puzzle tree can reach a height of 50 m and a DBH of 250 cm ([2]) and cover more than 400,000 ha between Chile and Argentina ([14]). Although it is considered a sacred tree by the Pewenche people ([2]), the species is intensively used economically for its large edible seeds, which affects its regeneration ([1]). The monkey puzzle tree has been listed in CITES Appendix I since 2011. It is also listed as an endangered species in the IUCN Red Data list ([34]). Araucaria araucana forests are constantly beset by intentional forest fires, high pressure by livestock, and the introduction of exotic species. Accurate estimation of the monkey puzzle tree’s biomass is imperative considering its important landscape carbon sequestration and the threats it faces. The inclusion of A. araucana in the list of species that can be assessed with tools for accurate biomass estimation conforms to the UNFCCC stipulation to quantify and report the carbon sequestration in all forest ecosystems at country level ([7]).
Identifying accurate and easily applicable BEMs for the monkey puzzle tree is relevant for various reasons. In addition to quantification of carbon stocks for national greenhouse gas balance estimates, BEMs provide access to important information such as rigorous documentation of forest structure and the measurements of indicators of site productivity ([6]). BEMs are mostly implemented in the form of local and general models. Local equations are based on covariates such as DBH (diameter breast height), HT (total height), plus a response variable (e.g., volume or biomass), and apply to local site conditions. General equations are based on two or more covariates at the stand level ([32]) and involve wider geographical zones. The inclusion of a second predictor including HT as an explanatory variable has been shown to improve the precision of biomass estimates ([37]). Likewise, the inclusion of additional variables (e.g., crown length) in such models could provide more accurate predictions, mainly for branches and leaves ([19]).
The determination of dry biomass and carbon storage depends on accurate measurement of basic density and moisture content. Wet biomass, which includes a variable amount of moisture, can only be determined by field measurements. Some studies found variation in basic density and moisture content from the stump to the top in conifers ([4]). Such information is crucial to accurately calculate dry weight biomass and carbon stocks. These data are especially important when these values are not constant for different tree components.
With these considerations in mind, we developed BEMs for A. araucana. Our procedures included basic density and moisture content along the stem, while assessing the predictive ability of models with different sets of predictor variables. We also sought to assess whether the inclusion of additional variables such as tree height and crown dimensions can substantially improve biomass estimation models ([19]).
The aims of this study were: (i) to document the variation in basic density and moisture content along the whole tree, including differences between tree components in A. Araucana; (ii) to select a set of suitable site- and species- specific biomass models to estimate dry weight of aboveground biomass and models for tree components, such as stem wood, stem bark, and foliage (branches + leaves); (iii) to analyse how biomass is distributed among the components of A. araucana trees of different ages.
Material and methods
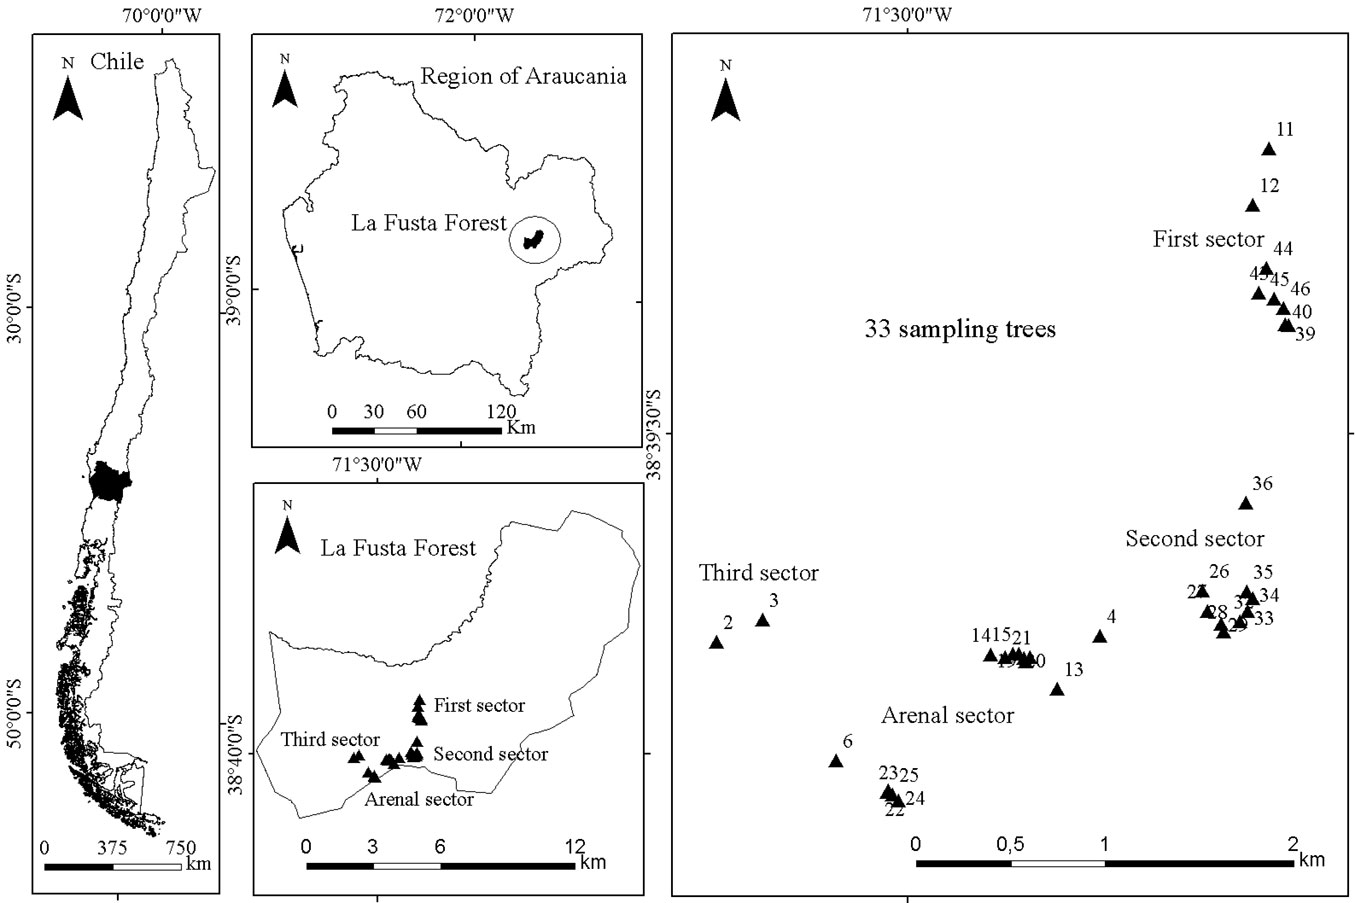
The study was conducted at La Fusta Forest on the lower slopes of the Andes mountain range in southern Chile (38° 34′ 28″ S, 71° 26′ 22″ W) about 15 km south of the town of Lonquimay in La Araucania Region (Fig. 1). The topography of the study area is relatively uniform, ranging from 1288 to 1376 m a.s.l. The climate is cool and moist, with a mean annual precipitation of 1457 mm, a mean minimum temperature of -1.6 °C (July) and a mean maximum temperature of 25.0 °C (February - [3]). The soils are derived from volcanic rock and are characterised by moderate to deep soil depth (15-180 cm), medium to fine soil texture with rapid to moderate drainage, acid pH (5.5) and low nutrient levels ([13]).
Fig. 1 - Study area: La Fusta forest in the Araucania Region, southern Chile.
Species description
Araucaria araucana is an endemic gymnosperm tree of the temperate forests of southern Chile and Argentina, growing in the Andes and Coastal Ranges. The trunk is cylindrical, the bark is thick and fissured and can reach 20 cm in thickness, and trees can reach an age of 1300 years ([2]). The coriaceous, scale-like leaves are triangular and 3-4 cm long ([13]). Araucaria araucana grows in association with Nothofagus species, such as Nothofagus antarctica (Forst.) Oerst., Nothofagus pumilio (Poepp. et Endl.) Krasser, Nothofagus obliqua (Mirb.) Bl., Nothofagus dombeyi (Mirb.) Bl., and Nothofagus alpina (Poepp. et Endl.) Oerst. ([39]). With regard to the habit, trees are pyramidal when young, growing into large trees with most of the branches clustered near the trunk tip, with a wide, flattened, umbrella-like crown. This habit is mostly found in a few other species of Araucaria, but essentially nonexistent in other forest trees, underscoring the need for species-specific biomass estimation models.
Fieldwork
We carried out fieldwork in the spring of 2012 ([17]). The selected trees covered the full range of sizes at the study site, including a DBH range from 10.0-126.4 cm. Thirty-three trees were selected for destructive sampling. Trees were felled at 0.3 m height, cut into sections at 1 m intervals and weighed in the field using a digital scale with a two-ton capacity. Before harvesting the following data were recorded: diameter at stump height (DSH), diameter at breast height (DBH) and crown diameter (CD), while crown length (CL) and total height (HT) were measured on the ground after felling (Tab. 1).
Tab. 1 - Attributes of the 33 Araucaria araucana trees sampled. (SD): standard deviation; (CV): coefficient of variation; (DBH): diameter at breast height; (HT): total height; (CL): crown length; (CD): crown diameter; (W): wood; (B): bark; (F): foliage; (TAGB): total aboveground biomass.
| Attribute | Unit | Mean | SD | CV (%) | Minimum | Maximum |
|---|---|---|---|---|---|---|
| DBH | cm | 51.8 | 33.5 | 64.8 | 10.0 | 126.4 |
| AGE | - | 244.5 | 168.4 | 68.9 | 39.0 | 662.0 |
| HT | m | 13.6 | 7.5 | 54.8 | 3.2 | 29.5 |
| CL | m | 5.7 | 2.7 | 48.2 | 1.7 | 12.5 |
| CD | m | 6.1 | 3.4 | 55.4 | 1.8 | 14.4 |
| W | kg | 1205.8 | 1674.9 | 138.8 | 6.9 | 6296.1 |
| B | kg | 320.8 | 467.5 | 145.7 | 2.7 | 1863.1 |
| F | kg | 785.5 | 1020.0 | 129.8 | 12.5 | 4212.2 |
| TAGB | kg | 2312.3 | 3113.1 | 134.6 | 22.5 | 12371.5 |
Perpendicular crown diameter projected to the ground were measured with a tape-measure while trees were still standing. Samples to determine basic density and moisture content were taken at DSH (0.3 m), 1.3 m (DBH), half of the total height and at the crown insertion (Fig. S1 in Supplementary material). In total 528 samples were gathered to trace the variation in basic density and moisture content along the stem profiles. In addition, three samples of foliage were taken from each tree, with the samples selected being less than 5 cm in diameter and gathered randomly from the crown (Fig. S2 in Supplementary material).
The allocation of biomass in the stem between wood and bark was documented by measuring stem diameter and bark thickness at 1-m intervals along the stem with millimetre callipers. The volumes were calculated using the Smalian cubing approach (eqn. 1), modelling trunk shape as a truncated cone ([20]). The volume with and without bark was also calculated. The volume of bark and wood was multiplied by the specific basic density (Mg m-3) of each tree to obtain dry biomass distributed between both components ([28] - eqn. 1):
where V is the volume of the log (m3), d1 is the basal diameter (m), d2 is the apical diameter (m), and l is the length of each log (m).
The basic density was determined following ISO-13061-2 ([26]) by immersion of saturated samples and measurement of water displacement. The samples for wood and bark components were arranged in different stem positions. Because of the large size of wood disks and wedges, cookies from different radial stem positions (pith, heartwood, sapwood) were employed as samples for wood basic density for each vertical stem position. The wood and bark samples were later dried at 105 ± 2 °C and foliage samples at 70 ± 2 °C until constant mass, which took about 48 hours. Once constant mass was reached, the dry mass was divided by the wet volume, and the wood density of each tree stem section assessed by averaging the density calculated from the respective cookies. The total basic density (BD) of a tree stem (wood or bark) was calculated as a weighted average, which included the volume of each tree stem section as a weighting factor (eqn. 2). The density of foliage was estimated using the same method of saturation and water displacement and was repeated three times.
where i is the stem position (i = STUMP, DBH, HALF, CROWN), Wi is the weighing by volume wood or bark fraction, and Xi is the basic density or the moisture content.
Moisture content was determined using ISO-13061-1 ([25]). In this method, the water content (difference between wet weight determined by a balance in situ and dry weight using a ventilated oven at 105 ± 2 °C) is computed as a percentage of the dry weight. At the same time, we determined the dry/wet ratio. The total moisture content per tree was calculated with eqn. 2 and was again repeated three times to estimate moisture content in foliage.
We chose to weigh branches with leaves on them, rather than separating the leaves from the branches. This is because the leaves are extremely long-lived in this species, and because they are scale-like with broad bases clothing the twigs, removing the fresh leaves also removes the cortical area and often the secondary phloem. As a result, weighing the twigs with leaves intact provides a better picture of their carbon content as well as providing greater accuracy (Fig. S2 in Supplementary material).
The age of all felled trees was conventionally determined by counting growth rings at breast height (1.3 m), where the samples did not have rotten tissues into the pith. A stereoscopic lens 5× was used for the larger diameter samples and a binocular Zeiss 10× for the smaller ones.
Statistical tests
To compare mean values in basic density and moisture content among tree components, a one factorial analysis of variance (one-way ANOVA) was used along with the post-hoc Tukey HSD test for multiple comparisons.
Biomass calculation of tree components
With regard to stem wood and stem bark, the volume to dry mass was transformed using the specific basic density for wood and bark. With regard to foliage, the dry mass was computed by multiplying fresh biomass by a dry/wet weight ratio. Subsequently, the dry biomass was calculated in kilograms for each component, including stem wood, stem bark, and foliage. Finally, the total aboveground biomass was determined as the sum of the components. Fig. S3 (Supplementary material) shows the relationship across individuals between the dry biomass of each component and DBH.
Biomass estimation models and multi-objective optimization
The data gathered were used to assess how total aboveground biomass and the biomass of stem wood, stem bark, and foliage of A. araucana can be predicted by biomass models representing typical allometric equations (simple bivariate power-law functions) and local models with multiple predictors. We tested a total of 300 models, including 75 different covariate functions for each response variable (TAGB: total aboveground biomass; W: wood; B: bark; F: foliage). These included simple and multiple linear regression and functions with and without logarithmic transformation of the response and quadratic or logarithmic terms as well as interactions between covariates, all fitted by ordinary least squares. While homoscedasticity of residuals can be achieved by log-transformation and has been verified for all resulting best models, some of the other models performed poorly due to problems with variance inflation that occur if neither such a linearization nor an estimation with weighted least-squares regression is applied. DBH, HT, CL and CD were used as predictors. Other explanatory variables such as DSH, basal area, age, and wood density were omitted because their inclusion either did not improve the accuracy of biomass estimation in preliminary analysis or they were difficult to measure in the field or by remote sensing. Linear regression models were employed because they are well known and provide readily interpretable predictions regarding the ways that the response variable (biomass) is affected by covariates (explanatory variables). They can be used for prediction and can sometimes outperform more complicated nonlinear models in situations with a small number of observations ([22]).
To assess the performance of local models, calculations for three different types of objectives were done. Firstly, general goodness-of-fit characteristics such as the coefficient of determination (R2 - eqn. 3), the root mean square error (RMSE - eqn. 4), the percentage relative standard error (PRSE - eqn. 5), the mean absolute error (MAE - eqn. 6), and the mean absolute percentage error (MAPE - eqn. 7) were calculated. Secondly, K-fold cross-validation using the “train” function from the R package “caret” was repeated ([29]) to see how well the models predicted new data, which here refers to a part of the data to which the models had not been fitted. For this procedure, all 33 observations were randomly divided into K = 7 roughly equal-sized groups. The models were fitted to the data including six out of seven groups, which equated to around 28 observations, and evaluated how well they predicted the data of the remaining group (the “test data”). The test data represented around 5 observations or 15% of the data. This procedure was repeated 20 times for each model, resulting in estimates of goodness-of-fit such as R2, RMSE, and MAE, and their respective mean estimation errors. Although these measures of cross-validation performance and general goodness-of-fit can be used to select models that minimise the prediction error in various means, the fitted parameter values of the models might not be reliable estimates. The third objective is the identifiability of model parameters, which is indicated by the PRSE (%) of the model parameters (eqn. 5), an important but sometimes neglected measure of model reliability or uncertainty ([41]).
where yi is the observed value, hat{y}i is the predicted value, bar{y}i is the mean value, n is the number of observations, P is the parameter estimates and SE(P) is the parameter standard error.
Finally, multi-objective optimization was used to identify the 75 equations (covariate functions) that best predicted biomass estimates, e.g., total aboveground biomass and the biomass of stem wood, stem bark, and foliage simultaneously. For this, MAPE was used to evaluate objective one, i.e., the general goodness-of-fit. The R2 of the repeated K-fold cross-validation was used to evaluate objective two, i.e., the ability to predict new data. Because models differed in their number of model parameters, the maximum of a model’s PRSE of model parameters was used for objective three, i.e., calculating the robustness of model parameters. While MAPE and PRSE should be minimised, R2 should be maximised for all response variables simultaneously. Since these estimates can only be directly compared between models predicting the same response variable, their values have been standardized for each response. For R2 this was done using the inverted values, such that the optimisation referred to the minimum for all quality criteria. The performance of each of the 75 equations was ultimately evaluated using the sum of the standardised performance measures that each of them showed for each response variable (TAGB, W, B, F). In this way, we ranked the performance of all equations. The following list shows the top five (eqn. 8 to eqn. 12), which are proposed as the most appropriate biomass estimation models for A. araucana:
where y is the response variable, β0, β1, β2 and β3 are model parameters estimated by ordinary least squares, DBH is the diameter breast height, HT is the total height, CL is the crown length, and CD is the crown diameter.
Analysis of changes in biomass distribution
The structure of Araucaria araucana trees changes with age, from a conical shape when young to an umbrella form when trees are older. Therefore, biomass distribution was divided into three age categories. The range of the categories was <120 years for group one, 120-240 years for group two and >240 years for group three. These age classes were used to split the data into three nearly equal sized groups, with 9 trees in group one and 12 each in group two and three.
Software and source code
Analyses were carried out in R ([36]). This included descriptive statistics using the R package “pastecs” ([21]), one-way analysis of variance (ANOVA) using “multcomp” ([24]), K-fold cross-validation using “caret” ([29]), and visualizations with “ggplot2” ([43]). The R script used for multi-objective optimisation of biomass estimation models is available in Appendix 1 (Supplementary material).
Results
Tree characteristics
The estimation of basic density and moisture content at 0.3 m (diameter at stump height - DSH), 1.3 m (diameter at breast height - DBH), half of the total height and at the crown insertion revealed their variability along the stem profiles.
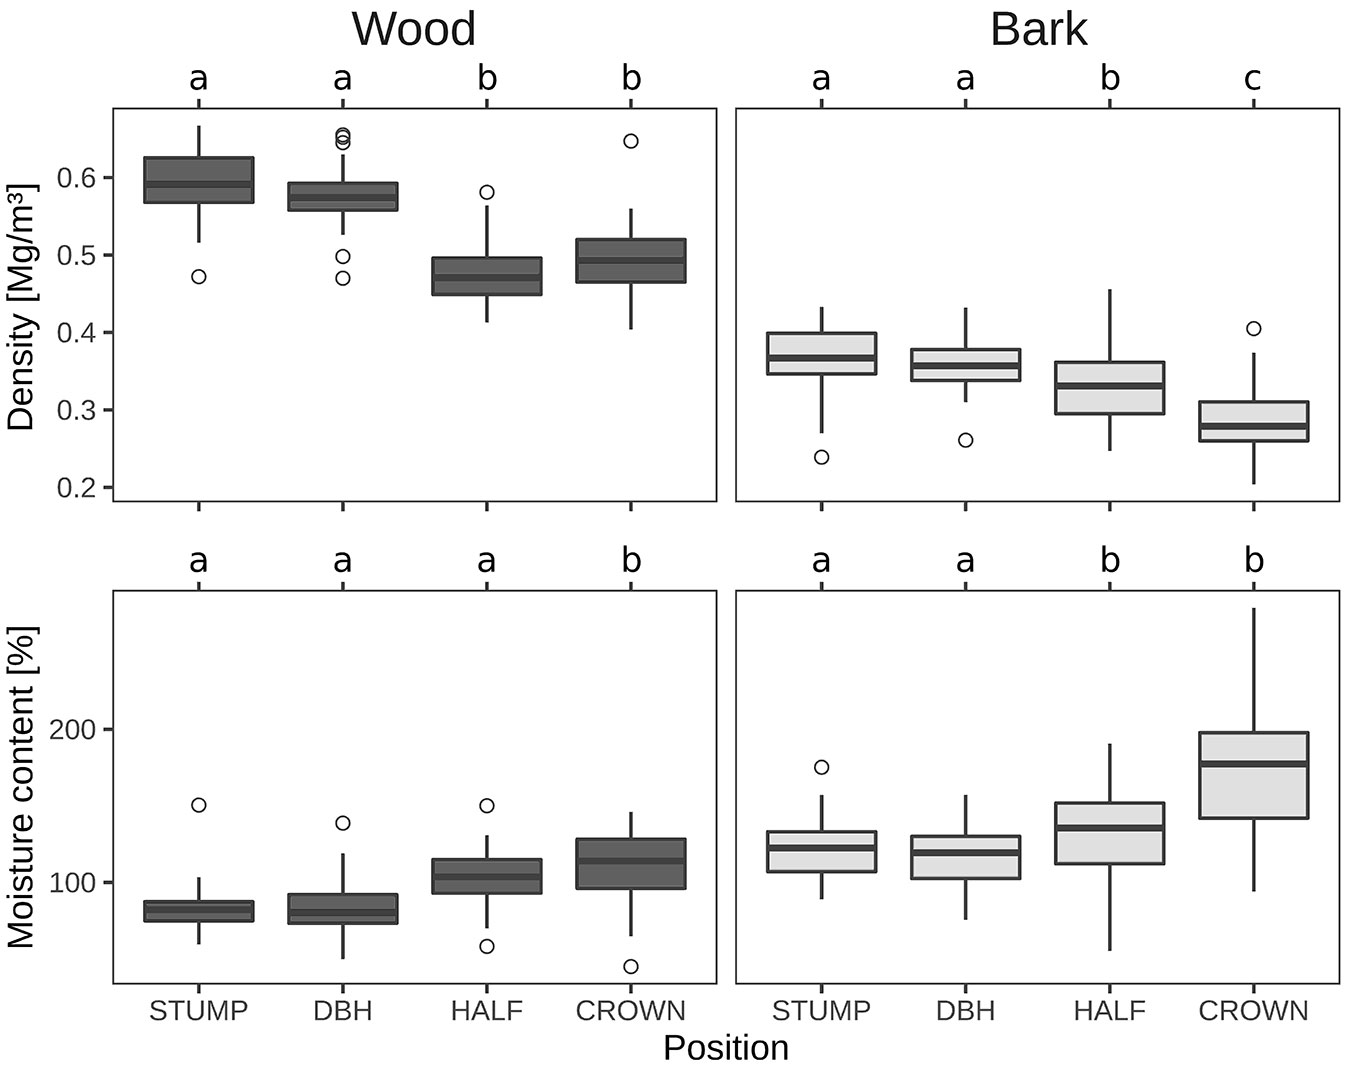
Basic density decreased from the base to the top and was higher in stem wood than in stem bark (Tab. 2). The variation detected at different positions in the stem profile was found to decrease from the stump to the top. In total, the weighted mean value of variation in basic density was up to 16.4% in stem wood and 21.4% in stem bark.
Tab. 2 - Weighted mean and standard deviation (SD) values in basic density and moisture content at different stem positions. (SE): standard error.
| Variable | Component | Stats | Stump | DBH | Half | Crown | Total tree |
|---|---|---|---|---|---|---|---|
| Basic density (Mg m-3) |
Wood | Mean ± SE | 0.595 ± 0.0075 | 0.579 ± 0.0064 | 0.484 ± 0.0071 | 0.497 ± 0.0080 | 0.539 ± 0.0048 |
| Range | 0.667 - 0.472 | 0.655 - 0.470 | 0.581 - 0.413 | 0.647 - 0.404 | 0.602 - 0.461 | ||
| SD | 0.043 | 0.037 | 0.041 | 0.046 | 0.028 | ||
| Bark | Mean ± SE | 0.363 ± 0.0075 | 0.358 ± 0.0062 | 0.328 ± 0.0083 | 0.285 ± 0.0081 | 0.334 ± 0.0050 | |
| Range | 0.430 - 0.239 | 0.432 - 0.261 | 0.456 - 0.247 | 0.405 - 0.204 | 0.384 - 0.276 | ||
| SD | 0.043 | 0.036 | 0.047 | 0.047 | 0.029 | ||
| Moisture content (%) |
Wood | Mean ± SE | 83.6 ± 2.7 | 83.0 ± 3.2 | 103.2 ± 3.2 | 110.8 ± 4.1 | 95.1 ± 1.7 |
| Range | 150.5 - 59.5 | 138.7 - 49.9 | 150.1 - 58.2 | 146.0 - 45.1 | 113.4 - 76.6 | ||
| SD | 15.4 | 18.1 | 18.6 | 23.4 | 9.9 | ||
| Bark | Mean ± SE | 123.0 ± 3.3 | 118.9 ± 3.2 | 135.7 ± 5.2 | 174.3 ± 7.4 | 138.0 ± 3.4 | |
| Range | 175.2 - 89.0 | 157.2 - 78.3 | 190.6 - 55.3 | 279.3 - 94.1 | 179.8 - 101.2 | ||
| SD | 18.7 | 18.5 | 29.8 | 42.4 | 19.6 |
Moisture content along the stem profile, was found to increase from the stump to the top (Tab. 2), which is an opposite trend in comparison to basic density. The maximum variation in moisture content was 24.5% for stem wood and 29.4% for stem bark, both at the top of the tree (Tab. 2, Fig. 2). These increases in variation may also result from the fact that the values that are pooled to the relative stem profile positions originate from trees that represent strongly varying absolute tree heights, which may therefore create more pronounced variations at the top than at the stump.
Fig. 2 - Basic density and moisture content in wood and bark (Mg m-3) at different positions through the stem profile. “a”, “b” and “c” indicate significant (P < 0.05) differences between groups according to the Tukey test.
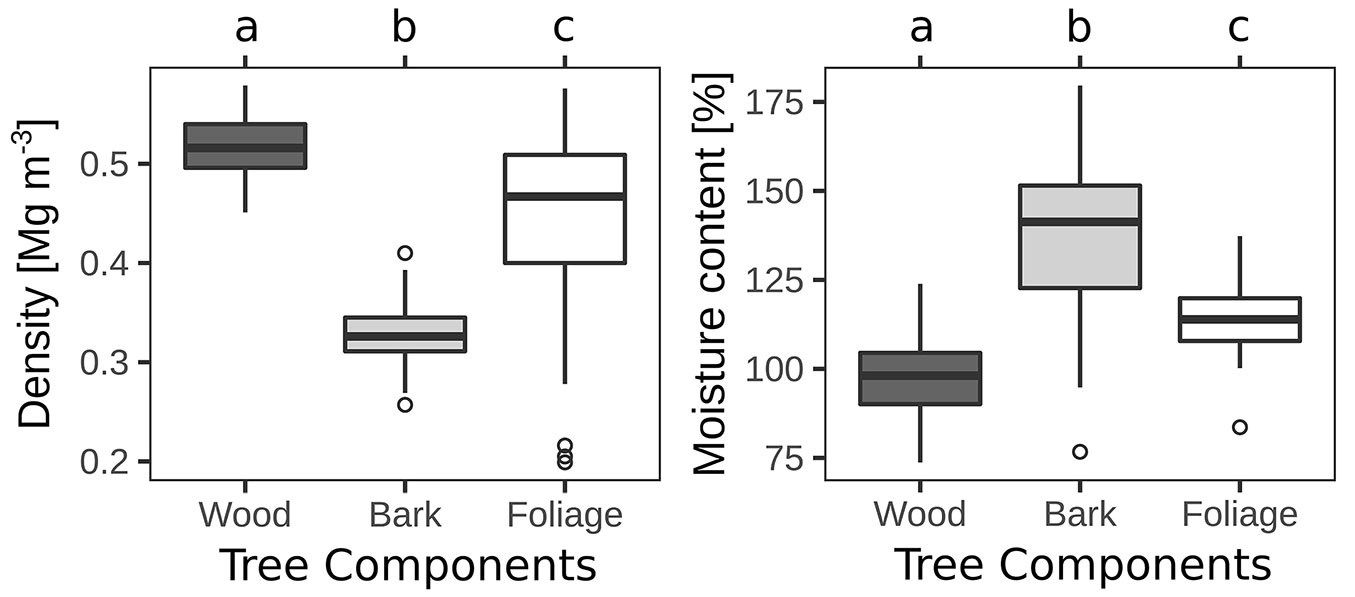
Strong differences in basic density and moisture content were also found between tree components (Tab. 3). They showed a tendency of wood > foliage > bark for mean estimates of basic density, with an opposite trend for moisture content (Fig. 3). The variability in basic density was much higher in foliage (24%) than in wood (6%) or bark (10%), while the variability in moisture content was more similar (foliage: 9%; bark: 16; wood: 11%).
Tab. 3 - Weighted mean ± SD values of basic density and moisture content for the three tree components. (SE): standard error; (SD): standard deviation.
| Tree component |
Stats | Basic density (Mg m-3) |
Moisture content (%) |
|---|---|---|---|
| Wood | Mean ± SE | 0.518 ± 0.0054 | 98.3 ± 1.9 |
| Range | 0.451 - 0.579 | 73.7 - 123.9 | |
| SD | 0.031 | 10.9 | |
| Bark | Mean ± SE | 0.328 ± 0.0059 | 137.8 ± 3.9 |
| Range | 0.257 - 0.410 | 179.6 - 76.7 | |
| SD | 0.034 | 22.4 | |
| Foliage | Mean ± SE | 0.431 ± 0.0184 | 114.3 ± 1.8 |
| Range | 0.199 - 0.576 | 83.6 - 137.3 | |
| SD | 0.106 | 10.2 |
Fig. 3 - Basic density (BD) and moisture content (MC) by tree components. “a’, “b” and “c” indicate significant (P < 0.05) differences between groups according to the Tukey test.
Biomass estimation models
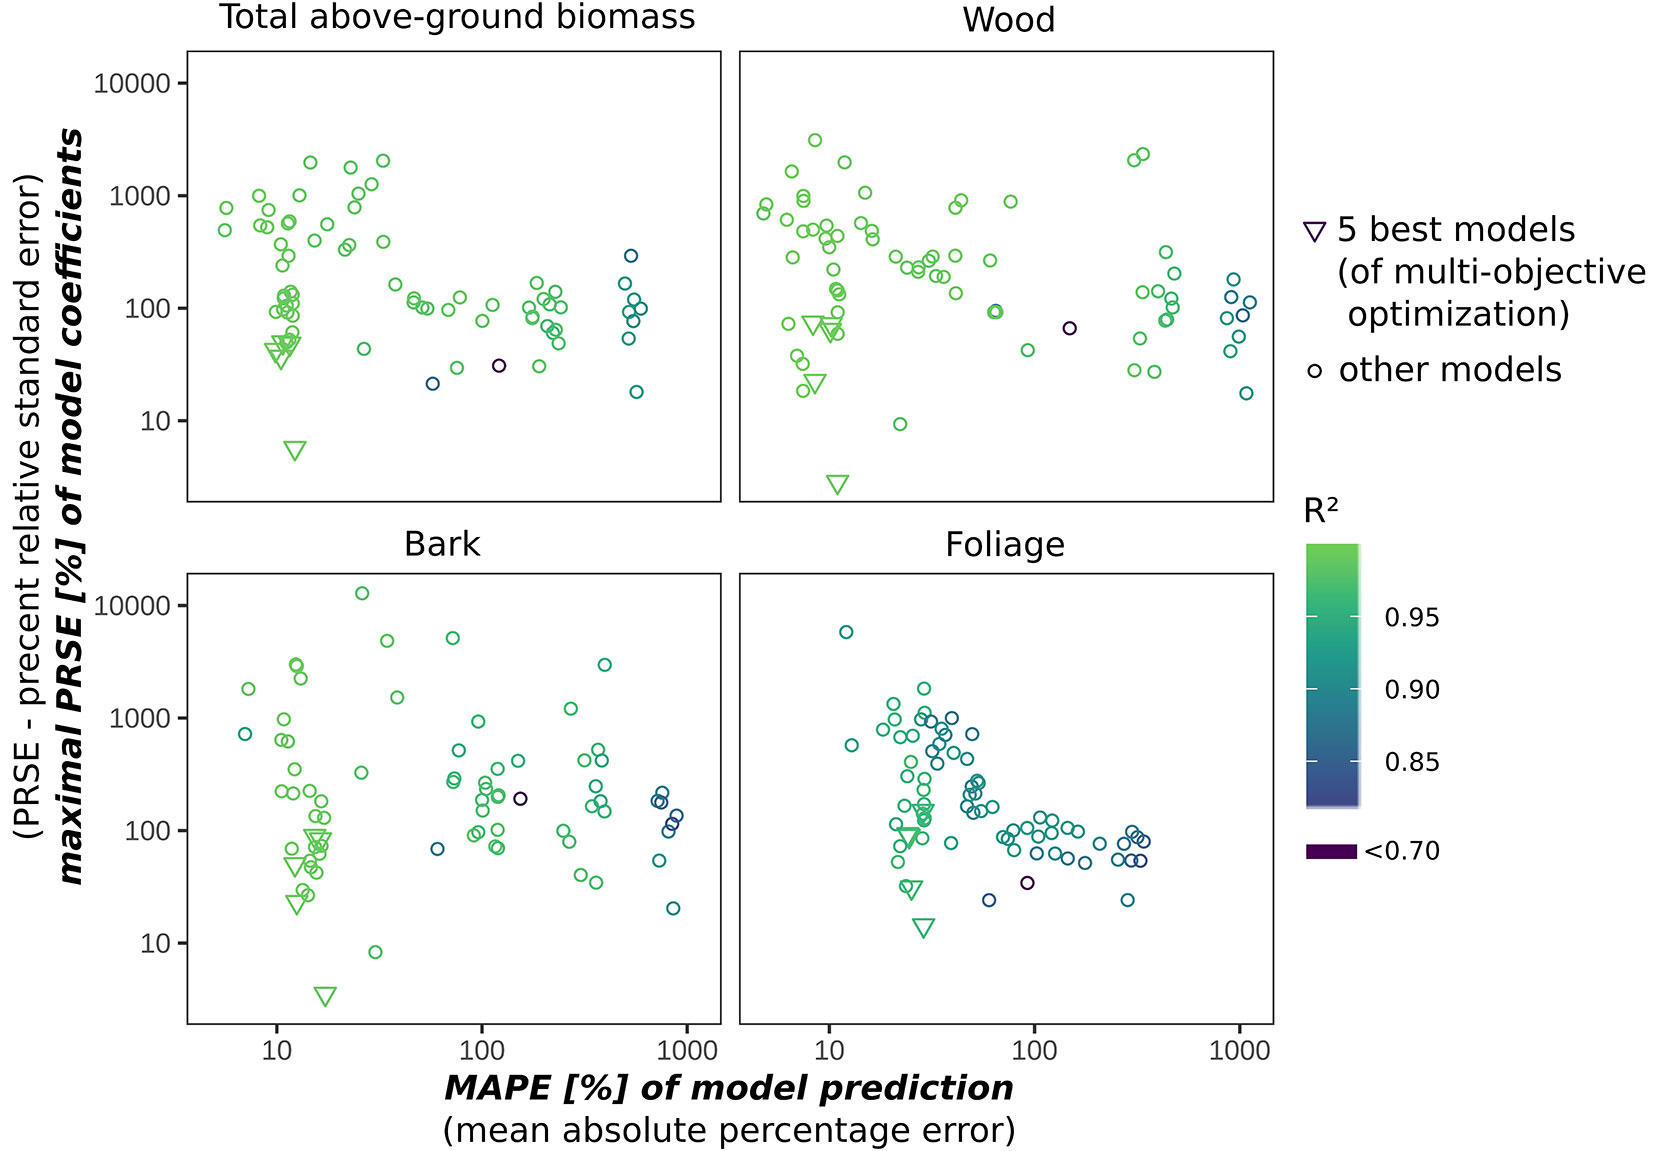
We used multi-objective optimisation based on goodness-of-fit, cross-validation performance, and uncertainty of model parameters to identify the equations that best predicted total aboveground biomass as well as the biomass of stem wood, stem bark, and foliage. Models that did not take DBH into account and were only based on crown diameter (CD), crown length (CL), or tree height (HT) did not fit the data very well. Here, the five best equations found are described (Tab. 4). These equations differed from the other models in combining high quality of fit with relatively low uncertainty of estimated model parameters (Fig. 4). Individual models that best predicted the biomass of individual tree components were identified. However, they were not suitable for other tree components. Thus, the Pareto optimal solutions presented here are the covariate functions that apply very well to all tree components. The comparison of measures such as R2, RMSE, MAPE, and MAE showed that the goodness-of-fit performance of the best models differs only slightly among them. Prediction errors of 12.2% of the model based on DBH-only as an exploratory variable can be reduced to 9.8% when more covariates are used, but this improvement was associated with a large increase in the percent relative standard error (PRSE) of estimated model coefficients. Whereas the DBH-only model has uncertainties in its estimation of model coefficients < 15%, the PRSE is > 20% for tree height (HT), > 30% for crown length (CL), and > 40% for crown diameter (CD). The model based on DBH and HT may be the best compromise for a modest error reduction with only a small increase in the maximum PRSE of the model coefficients. The strong relationship between observed and predicted values of model 9 is shown in Fig. S5 (Supplementary material). The R2 resulting from the K-fold cross validation was higher than 0.994 in all except the foliage component, where it ranged between 0.968 and 0.955.
Tab. 4 - Best biomass estimation models found with multi-objective optimization. (TAGB): total aboveground biomass; (W): wood; (B): bark; (F): foliage; (β0, β1, β2, β3): model parameters estimated by ordinary least squares ± their percent relative standard error, PRSE (%); (R2 ): Coefficient of determination; (RMSE): Root mean squared error; (MAPE): Mean absolute percentage error.
| Model | Y | β 0 | β 1 | β 2 | β 3 | R2 | RMSE (kg) |
MAPE (%) |
MAE ± σ |
|---|---|---|---|---|---|---|---|---|---|
| 8 | TAGB | -2.466 ± 5.7 | 2.437 ± 1.5 | - | - | 0.99 | 452.6 | 12.2 | 0.12 ± 0.04 |
| W | -4.320 ± 2.8 | 2.709 ± 1.2 | - | - | 0.99 | 238.4 | 10.9 | 0.11 ± 0.03 | |
| B | -5.153 ± 3.5 | 2.585 ± 1.8 | - | - | 0.99 | 114.9 | 17.2 | 0.18 ± 0.05 | |
| F | -2.162 ± 14.3 | 2.118 ± 3.8 | - | - | 0.96 | 339.1 | 28.7 | 0.26 ± 0.10 | |
| 9 | TAGB | -1.995 ± 13.2 | 2.228 ± 4.7 | 0.022 ± 48.2 | - | 0.99 | 386.4 | 11.5 | 0.12 ± 0.04 |
| W | -3.586 ± 5.3 | 2.385 ± 3.2 | 0.034 ± 22.5 | - | 0.99 | 152.3 | 8.5 | 0.09 ± 0.03 | |
| B | -4.088 ± 6.9 | 2.114 ± 5.4 | 0.049 ± 23.1 | - | 0.99 | 77.1 | 12.5 | 0.13 ± 0.04 | |
| F | -2.519 ± 24.4 | 2.276 ± 10.9 | -0.016 ± 149.1 | - | 0.96 | 335.8 | 28.6 | 0.27 ± 0.11 | |
| 10 | TAGB | -2.350 ± 5.7 | 2.354 ± 1.9 | 0.033 ± 36.9 | - | 0.99 | 337.4 | 10.4 | 0.11 ± 0.04 |
| W | -4.264 ± 3.0 | 2.669 ± 1.6 | 0.016 ± 71.9 | - | 0.99 | 217.6 | 10.2 | 0.11 ± 0.03 | |
| B | -5.225 ± 3.6 | 2.637 ± 2.4 | -0.020 ± 83.4 | - | 0.99 | 129.1 | 16.3 | 0.17 ± 0.05 | |
| F | -1.872 ± 15.3 | 1.909 ± 5.0 | 0.083 ± 31.1 | - | 0.97 | 345.5 | 25.1 | 0.26 ± 0.08 | |
| 11 | TAGB | -1.938 ± 12.4 | 2.173 ± 4.5 | 0.019 ± 49.6 | 0.031 ± 37.8 | 0.99 | 357.8 | 10.6 | 0.12 ± 0.04 |
| W | -3.563 ± 5.3 | 2.363 ± 3.3 | 0.033 ± 22.9 | 0.012 ± 74.3 | 0.99 | 172.4 | 8.3 | 0.09 ± 0.02 | |
| B | -4.136 ± 6.6 | 2.161 ± 5.2 | 0.051 ± 21.2 | -0.026 ± 50.1 | 0.99 | 91.2 | 12.2 | 0.14 ± 0.04 | |
| F | -2.361 ± 22.7 | 2.123 ± 10.4 | -0.023 ± 92.8 | 0.086 ± 30.2 | 0.96 | 312.5 | 24.1 | 0.26 ± 0.08 | |
| 12 | TAGB | -2.062 ± 8.5 | 2.218 ± 3.2 | 0.035 ± 32.6 | 0.032 ± 42.4 | 0.99 | 303.4 | 9.8 | 0.11 ± 0.04 |
| W | -4.045 ± 4.2 | 2.566 ± 2.7 | 0.017 ± 63.9 | 0.025 ± 54.5 | 0.99 | 254.0 | 10.1 | 0.11 ± 0.03 | |
| B | -4.948 ± 5.2 | 2.506 ± 4.2 | -0.018 ± 89.4 | 0.031 ± 65.1 | 0.99 | 122.1 | 15.3 | 0.17 ± 0.05 | |
| F | -1.562 ± 25.4 | 1.763 ± 9.2 | 0.085 ± 30.3 | 0.035 ± 89.4 | 0.97 | 313.8 | 24.5 | 0.26 ± 0.09 |
Fig. 4 - Pareto front showing the relationship between maximum percentage relative standard error of local model parameters and mean absolute percentage error of all local models tested. It confirms that the best five local models found by the applied multi-objective optimization approach are those that minimize these two critical estimates simultaneously for all four response variables.
Changes in biomass distribution
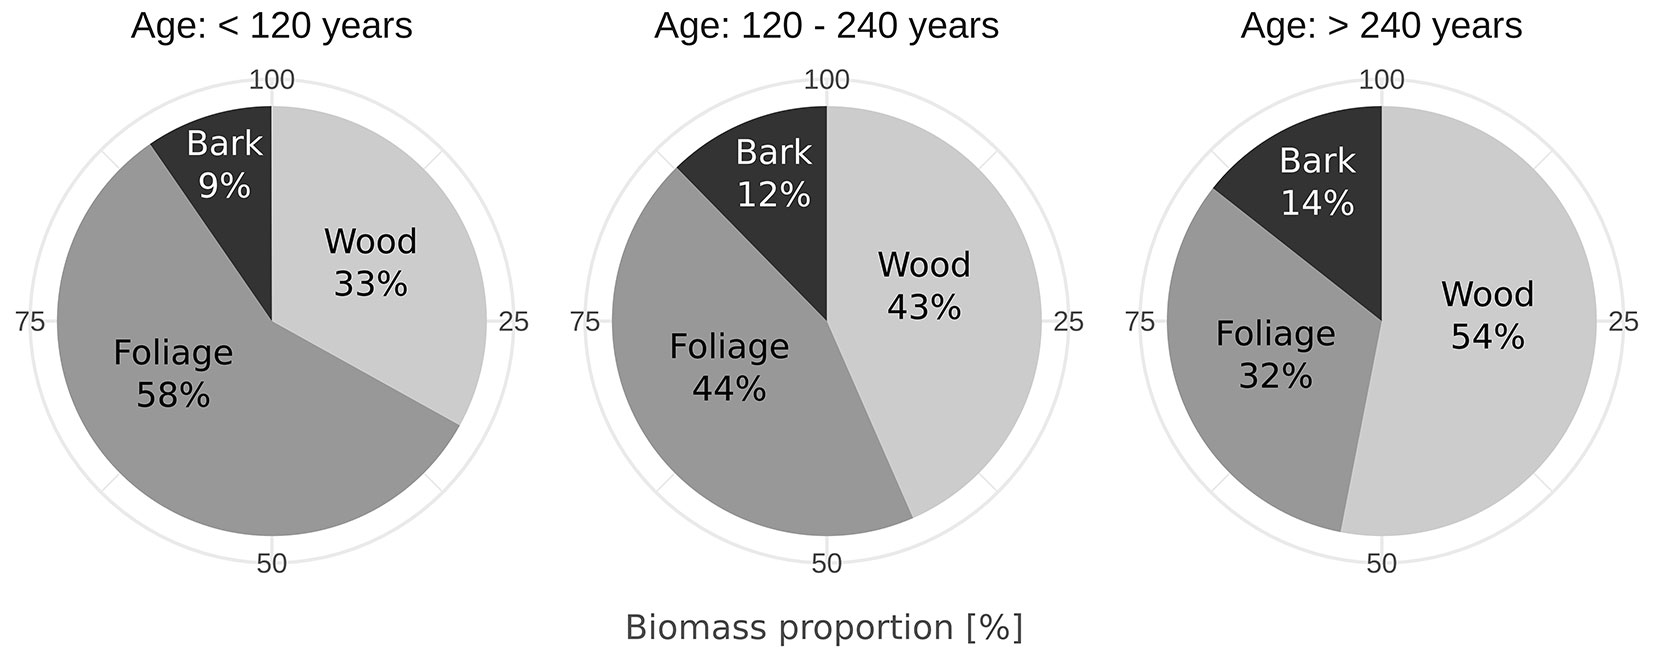
The biomass proportion (%) of stem wood and foliage changes with age in A. araucana (Fig. 5). The proportion of stem wood increases from relatively young trees to older trees. Conversely, the amount of foliage decreases as decreasing trees age. The proportion of stem bark was relatively stable and did not display marked differences among groups. In the three groups the distribution according to DBH was 10.0-29.1 cm (< 120 years), 14.0-70.0 cm (120-240 years) and 48.8-126.4 cm (> 240 years).
Fig. 5 - Biomass proportion for tree components in three groups of age (years).
Discussion
Cost-effective biomass equations are a crucial component of effective forest management. As a result, an essential first step is to identify equations that provide the greatest accuracy for a minimum of field investment. The study shows, despite its extremely distinctive habit, biomass in A. araucana scales predictably with size and age, meaning that it is entirely feasible to estimate biomass based on readily-measured variables. Our model selection process allows informed exclusion of some variables from field sampling protocols, including some that are time-consuming to measure. Part of this process involved identifying variables that do add predictive power but because the increase in prediction is relatively small, we recommend their exclusion from field surveys. In what follows, we explore these considerations for variable selection, as well as trends in biomass distribution that we identified in A. araucana.
Identifying variables to measure in the field to estimate biomass
Our multi-objective optimisation approach proved to be very informative regarding which variables to include and which not to include in field measurements for estimating A. araucana biomass. Our approach identified five models (sets of covariates) that minimised the errors and uncertainties in the prediction of total aboveground biomass and its components, which were stem wood, stem bark, and foliage (Tab. 4). We identified DBH and tree height (HT), both very readily measured in the field, to be among the most important variables to be included in biomass estimation in our proposed local models. That the inclusion of HT can improve model quality has been previously reported in other species ([37]). Inclusion of height, though, does by no means always improve biomass estimations, as in tropical forests, where the poor performance of HT could be a consequence of the high variation in the relationship between tree height, crown area, and stem diameter, as well as an inconsistent relationship between age and tree size ([5]). This variation underscores the need to explore models fits empirically on a case-by-case basis with procedures such as the one used here, which also identifies variables that can be excluded.
Our results suggest that including variables such as crown length, crown diameter, wood density, age, and basal area are not necessary for acceptable biomass predictions. Contrary to our expectations and to those of some previous authors ([44]), the inclusion of crown length and crown diameter did not improve the accuracy of prediction of the foliage component (Tab. 4). It can therefore be concluded that crown measurements would incur unnecessary additional costs and that models based on DBH and HT, which have similar predictive capacities but more robust parameter estimates, are better suitable to predict total aboveground biomass as well as stem wood, stem bark and, foliage components of A. araucana. In some taxa, factors such as wood density have been found to be important ([8], [5]), whereas age was found to be important in others ([44]). Here we found that wood density, age and, basal area did not improve biomass estimation, with the errors not substantially decreasing compared to the best models found, while the uncertainties increased, especially the percent relative standard error values of the estimated model parameters. Based on these results, these variables can be avoided in field sampling. Because wood density and especially age are quite time-consuming to measure, this finding substantially economizes field time. With regard to general models, it remains to be explored whether wood density, basal area, and age could improve general models that estimate forest biomass across wider geographical zones. With regard to local models of relevance to landowners, however, our results provide concrete guidance that biomass estimations can be quite confidently made including DBH and HT, while age and basic density are not practical measurements in natural conditions for A. araucana. Our results also identified patterns of biomass distribution in A. araucana, which because of its distinctive habit we explore in detail now.
Variation along the trunk and with tree size
Our results show that wood density decreases and moisture content increases as a function of the stem height from stump to crown and were remarkably similar to other species (Fig. 2), even ones with habits very different from A. araucana. In A. angustifolia, one of the few other trees to share the umbrella-like habit of A. araucana, wood density also decreases acropetally ([9]). At 16.4%, the vertical variation (stem wood) in A. araucana is higher compared to Pinus spp. (12%) ([42], [27]), but lower compared to Pinus massoniana Lamb. (37.9%) ([11]), Picea sitchensis (Bong.) Carr. (20%) ([12]), and A. angustifolia (28.3%) ([9]). Moisture content increased vertically from the stump to the crown (Tab. 2), which can be explained by change in the proportion of sapwood ([30]) in A. araucana. In contrast, there are species of Abies and Pinus that do not have a clear pattern ([18]). Other conifers, such as Picea sitchensis, have shown increases in moisture content of 42% along the stem ([12]), which is much more pronounced comparing to A. araucana (24.5%). These differences across species, even in the same genus, mean that variation in the distribution of basic density and moisture content base-to-top cannot simply be assumed and must be determined empirically, underscoring the need for data such as those presented here.
Biomass distribution for tree components in Araucaria araucana
As with changes in density and moisture content with height, the distribution of biomass among trunk, branches, and foliage was also broadly like that found in other species, including those of similar and different habits. As in A. araucana, the proportion of wood increases over time (Fig. 5), while bark and foliage decreases in Pinus pinaster Aiton. ([35]). Along these lines, one study found that the proportion of wood increased from 66 to 83% in stands of 15-100-year-old Pinus sylvestris L. trees, mirroring the trends found for A. araucana ([23]). Similarly, foliage in Pinus strobus L. decreased from 52% to 33% in stands of 15-30-year-old trees ([33]). Moreover, our finding for the distribution of biomass in the youngest age class (< 120 years) is similar to data of 29-33-year-old A. angustifolia trees, in the same genus ([38]). Sanguetta et al. ([38]) reported an allocation of 54.2% of the biomass to wood, 17.4% to bark and 27.9% to foliage, whereby that proportion was obtained from the sum of the subcomponents leaves (8.7%), live branches (17.6%) and dead branches (1.6%). These values have also been confirmed by Schumacher et al. ([40]), who reported on the distribution of wood (51.5%), bark (14.7%) and foliage (18.9%) in a 27-year-old stand of A. angustifolia, where the proportion of roots (13.0%) was also determined. These results confirm the high proportion of the bark component in both Araucaria spp. (Fig. 5), compared to the 5.8% found in a plantation of 55-year-old Picea abies (L.) H. Karst. ([31]). According to Gayoso et al. ([16]), these values are also higher compared to Pseudotsuga menziesii (Mirbel) Franco (8.3%), Pinus ponderosa Douglas ex C. Lawson (6.6%), and Pinus radiata D. Don (9.6%). Understanding the distribution of biomass in Araucaria forest could explain some of the reasons for its survival in the face of so many natural disasters, such as forest fires and volcanic eruptions. It seems possible that these conditions of natural selection favor very thick bark in A. araucana as compared with other types of trees.
Conclusions
Our multi-objective optimisation identified local models that were characterised by low prediction errors and low uncertainties of model coefficients. The most important covariates for estimating total tree and components biomass were DBH and HT, both readily measured in the field. Only the prediction of the foliage component was associated with higher errors, which could not be substantially reduced by including crown length and crown diameter. In A. araucana, basic wood and bark density decreased from the trunk base to the tip, whereas moisture increased. The observed values are in the middle and upper range of other conifers. The proportion of bark with respect to total biomass was found to be higher compared to most other conifers, although similar to A. angustifolia. Bark proportion also increases with age, as does the proportion of the tree stem biomass, while the proportion of foliage biomass decreases.
Our results have made an important contribution to the characterization of A. araucana, which is a remarkable species due to its unique architecture and its dominance across a wide range of high elevation woodlands. We believe that the approach presented here for the evaluation of biomass estimation models and its results guides future work in remote sensing, site productivity assessment and carbon stock quantification.
List of abbreviations
The following abbreviations have been used throughout the paper:
- CITES: Convention on International Trade in Endangered Species of Wild Fauna and Flora
- IUCN: International Union for Conservation of Nature
- UNFCCC: United Nation Framework Convention on Climate Change
- ISO: International Organization for Standardization
- AGRIMED: Centro de Agricultura y Medioambiente
Acknowledgements
EK, JG, MO, and MZ wrote the paper; MZ and EK performed the statistical analysis; AB and JG carried out the field measurements; JG obtained the grant and designed the experiment; EK, MZ, PC, KD, JH and FP analysed data. All authors helped to improve the final version of the manuscript.
Our thanks to the Chilean National Forestry Corporation for the opportunity to conduct this study and for providing the authorisation of the felled trees. A special thank should also be given to the landowners who kindly donated the trees for this study. Our gratitude to Universidad Austral de Chile for supports for this research. We thank Christopher Marrs, who greatly improved the English version of this manuscript. Our gratitude to Dr. Victor Gerding, for his constant revisions, criticisms and suggestions to our manuscript, as well as to the anonymous reviewers who substantially improved the quality of our work. The corresponding author is supported by CONICYT Doctoral scholarship.
References
Gscholar
Gscholar
Online | Gscholar
Gscholar
Gscholar
Online | Gscholar
Gscholar
Gscholar
Gscholar
CrossRef | Gscholar
CrossRef | Gscholar
CrossRef | Gscholar
Gscholar
Authors’ Info
Authors’ Affiliation
Francesco Pirotti 0000-0002-4796-6406
Department of Land, Environment, Agriculture and Forestry (TESAF), University of Padova, v. dell’Università 16, I-35020 Legnaro, PD (Italy)
Álvaro Bucarey
Instituto de Bosques y Sociedad (IBOS), Universidad Austral de Chile, Campus Isla Teja, Valdivia (Chile)
Campo Digital GIS and Remote Sensing, Sarmiento 1767, Osorno (Chile)
Patricio Corvalán 0000-0002-9642-0629
Departamento de Gestión Forestal y su Medio Ambiente, Universidad de Chile, Santa Rosa, 11315 La Pintana, Santiago (Chile)
Department of Forest Management and Applied Geoinformatics (FFWT), Mendel University in Brno, Zemedelská 3, 61300 Brno (Czech Republic)
Instituto de Biología, Universidad Nacional Autónoma de México, Tercer Circuito s/n de Ciudad Universitaria, Ciudad de México 04510 (México)
Department of Forest Sciences, Institute of Forest Growth and Forest Computer Sciences, Technische Universität Dresden, Pienner Str. 8, D-01737 Tharandt (Germany)
Corresponding author
Paper Info
Citation
Kutchartt E, Gayoso J, Pirotti F, Bucarey Á, Guerra J, Hernández J, Corvalán P, Drápela K, Olson M, Zwanzig M (2021). Aboveground tree biomass of Araucaria araucana in southern Chile: measurements and multi-objective optimization of biomass models. iForest 14: 61-70. - doi: 10.3832/ifor3492-013
Academic Editor
Alessio Collalti
Paper history
Received: May 05, 2020
Accepted: Dec 10, 2020
First online: Feb 09, 2021
Publication Date: Feb 28, 2021
Publication Time: 2.03 months
Copyright Information
© SISEF - The Italian Society of Silviculture and Forest Ecology 2021
Open Access
This article is distributed under the terms of the Creative Commons Attribution-Non Commercial 4.0 International (https://creativecommons.org/licenses/by-nc/4.0/), which permits unrestricted use, distribution, and reproduction in any medium, provided you give appropriate credit to the original author(s) and the source, provide a link to the Creative Commons license, and indicate if changes were made.

Web Metrics
Breakdown by View Type
Article Usage
Total Article Views: 41068
(from publication date up to now)
Breakdown by View Type
HTML Page Views: 32543
Abstract Page Views: 4274
PDF Downloads: 3490
Citation/Reference Downloads: 6
XML Downloads: 755
Web Metrics
Days since publication: 1957
Overall contacts: 41068
Avg. contacts per week: 146.90
Article Citations
Article citations are based on data periodically collected from the Clarivate Web of Science web site
(last update: Mar 2025)
Total number of cites (since 2021): 6
Average cites per year: 1.20
Publication Metrics
by Dimensions ©
Articles citing this article
List of the papers citing this article based on CrossRef Cited-by.
Related Contents
iForest Similar Articles
Research Articles
Integration of tree allometry rules to treetops detection and tree crowns delineation using airborne lidar data
vol. 10, pp. 459-467 (online: 04 April 2017)
Research Articles
Heuristic forest planning model for optimizing timber production and carbon sequestration in teak plantations
vol. 10, pp. 430-439 (online: 24 March 2017)
Research Articles
Allometric equations to assess biomass, carbon and nitrogen content of black pine and red pine trees in southern Korea
vol. 10, pp. 483-490 (online: 12 April 2017)
Research Articles
An approach to estimate carbon stocks change in forest carbon pools under the UNFCCC: the Italian case
vol. 1, pp. 86-95 (online: 20 May 2008)
Research Articles
High resolution biomass mapping in tropical forests with LiDAR-derived Digital Models: Poás Volcano National Park (Costa Rica)
vol. 10, pp. 259-266 (online: 23 February 2017)
Research Articles
On the geometry and allometry of big-buttressed trees - a challenge for forest monitoring: new insights from 3D-modeling with terrestrial laser scanning
vol. 8, pp. 574-581 (online: 02 March 2015)
Research Articles
Estimation of fuel loads and carbon stocks of forest floor in endemic Dalmatian black pine forests
vol. 13, pp. 382-388 (online: 01 September 2020)
Research Articles
Allometric relationships for volume and biomass for stone pine (Pinus pinea L.) in Italian coastal stands
vol. 6, pp. 331-335 (online: 29 August 2013)
Research Articles
Modelling the carbon budget of intensive forest monitoring sites in Germany using the simulation model BIOME-BGC
vol. 2, pp. 7-10 (online: 21 January 2009)
Research Articles
Allometric equations to estimate above-ground biomass of small-diameter mixed tree species in secondary tropical forests
vol. 13, pp. 165-174 (online: 02 May 2020)
iForest Database Search
Search By Author
- E Kutchartt
- J Gayoso
- F Pirotti
- Á Bucarey
- J Guerra
- J Hernández
- P Corvalán
- K Drápela
- M Olson
- M Zwanzig
Search By Keyword
Google Scholar Search
Citing Articles
Search By Author
- E Kutchartt
- J Gayoso
- F Pirotti
- Á Bucarey
- J Guerra
- J Hernández
- P Corvalán
- K Drápela
- M Olson
- M Zwanzig
Search By Keywords
PubMed Search
Search By Author
- E Kutchartt
- J Gayoso
- F Pirotti
- Á Bucarey
- J Guerra
- J Hernández
- P Corvalán
- K Drápela
- M Olson
- M Zwanzig
Search By Keyword


