Integration between TLS and UAV photogrammetry techniques for forestry applications
iForest - Biogeosciences and Forestry, Volume 10, Issue 1, Pages 41-47 (2016)
doi: https://doi.org/10.3832/ifor1780-009
Published: Jun 23, 2016 - Copyright © 2016 SISEF
Technical Reports
Abstract
Forests are significant resources from an ecological, economic and social point of view. Their protection and management could greatly benefit from a complete knowledge of the shape and distribution of trees in forest stands. To this purpose, aerial surveys, especially through Airborne Laser Scanning (ALS), were carried out in the last years to acquire point clouds to be used in 3D models aimed at achieving an accurate description of tree crowns and terrain. However, airborne data acquisition is expensive and may provide poor results in case of dense foliage. Further, point cloud resolution is not very high, as models with a grid of 2-3 m are usually obtained. In order to implement more accurate 3D forest models, a feasible solution is the integration of point clouds obtained by aerial acquisition (ALS or photogrammetry) for the treetops and the terrain description, with information from terrestrial surveys. In this paper, we investigated the possible integration of point clouds obtained by Terrestrial Laser Scanner (TLS) with those collected by photogrammetric 3D models based on images captured by Unmanned Aerial Vehicle (UAV) in a test site located in northern Italy, with the aim of creating an accurate dataset of the forest site with high resolution and precision. The limits of ALS and TLS were bridged by aerial photogrammetry at low altitude (and vice versa). A 3D model of the study area was obtained with a resolution of 5 cm and a precision of 3 cm. Such model may be used in a wide range of applications in forestry studies, e.g., the reconstruction of 3D shapes of trees or the analysis of tree growth throught time. The implications of the use of such integrate approach as a support tool for decision-making in forest management are discussed.
Keywords
Data Integration, Forestry, Laser Scanner, Photogrammetry, Unmanned Aerial Vehicle, GNSS
Introduction
A key issue in sustainable forest management is to improve access to mountain forest ([30]) to increase the efficiency of wood harvesting and transport ([29], [28]), as well as collect forest inventory data for biomass analysis and soil model ([12], [31]). In this scenario, the EU Gothenburg priorities (⇒ http://www.interreg4c.eu/projects/environment-risk-prevention/) focus on the effective management of forest ecosystems and risk prevention, as well as the protection and preservation of forest ecosystems. The aim of various National and European projects ([8], [13], [23]) is to contribute to the future sustainable development of the environment and land use. To this end, the development of practical tools for managing forest resources is needed ([2]). In particular, comprehensive knowledge of the territory is required, for example by adopting geomatics techniques and yielding innovative cartographic products.
In the last years, LiDAR (Light Detection And Ranging) techniques have gained scientific and operational attention in forest management. The utility of forestry laser scanner has been established over time both from terrestrial and aerial perspectives ([25], [20]). The main feature of this method is the acquisition of data both from above and under the trees, thanks to the signal used and the waveform analysis. From the aerial perspective, Airborne Laser Scanning (ALS) provided interesting results in terms of biomass prediction ([24]) and estimation ([15]). Moreover, many advantages of the use of ALS have been highlighted in the inventory process aimed at the sustainable forest management, both from aerial ([33], [18]) and terrestrial perspectives ([4]).
Recent progress in LiDAR technology, combined with aerial photogrammetry ([17]), enabled forest volume and other stand characteristics to be mapped in the field. However, several problems still exist with the use of this technology. Indeed, the main problem is that LiDAR data have a low (metrical) resolution, thereby many trees characteristics are sometimes missing due to foliage coverage ([3]). Additionally, ALS acquisition is very expensive, thus it cannot be frequently repeated. As for the aerial perspective, photogrammetry can be a solution for volume and tree height estimation ([32]), especially to generate terrain models and orthophotos in monitoring scenarios ([22]).
During the last years, photogrammetry from UAVs (Unmanned Aerial Vehicles) has received increasing attention ([16]) due to the use of SFM (Structure From Motion) approaches for tree 3D modeling. This approach permits to work on images acquired by UAV with different lightness, scale factors and a very large overlapping. This kind of data could be exploited to reconstruct the surface model of the study area and produce highly detailed orthophotos. However, with aerial photogrammetry there is a lack of ground data which is very important for tree trunk analyses, thus requiring time consuming surveys carried out by forestry experts. For this reason, an integrated approach between terrestrial laser scanner and aerial photogrammetry from UAV would be highly desirable, with the aim of evaluating data quality in terms of acquisition, processing and final results, and therefore achieving a complete description of the area of interest.
This study investigates the combined use of Terrestrial Laser Scanner (TLS) for tree trunks modeling and UAV for surface reconstruction. This method allows a complete description of the study area without the need to perform specific ground survey to analyze tree characteristics. In this way, monitoring analysis can be performed starting from the complete description of the forest with a high level of detail and precision. The final results is a complete point clouds, the orthophoto of the area and a Digital Surface Model (DSM). We believe that the georeferenced point clouds should help to support decision making.
The work presented here is part of the NEWFOR research project (NEW technologies for a better mountain FORest timber mobilization - ⇒ http://www.newfor.net/, [1]) bringing together 14 institutions from six Alpine countries. Its aim is to encourage the use of new technologies to support the planning of forest exploitation, focusing on the entire wood chain, through the use of remote sensing and geographic information systems (GISs).
Material and methods
Case study
The study was carried out in Beaulard, Piedmont (northwest Italy - 45° 46′ 22.05″ N, 7° 29′ 49.05″ E, elevation: 1745 m a.s.l), in a riverside area characterized by trees both standing alone and arranged in rows. We used both TLS and photogrammetric acquisitions with UAV. TLS was used in an area where trees form a “natural” tunnel, while UAV acquisition covered the entire area.
Measurement campaign
Geodetic network and survey
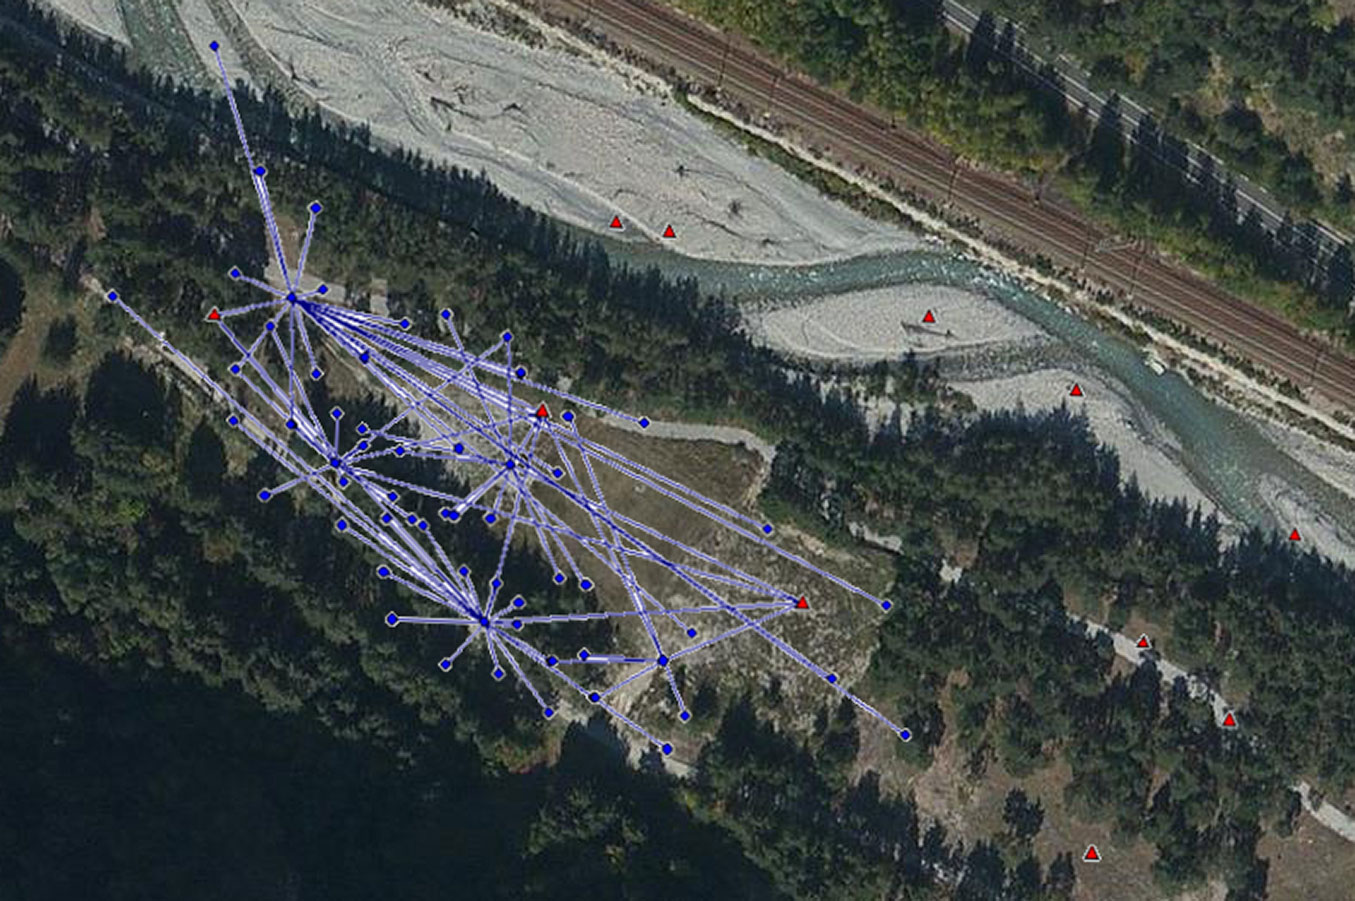
In order to identify the coordinates of Ground Control Points (GCPs) which were used to georeference the orthophoto and DSM, a geodetic network (Fig. 1) was built and measured using both GNSS and traditional topographic (total station) surveys.
Fig. 1 - Position of the network (red triangle) and detail points (blue circles) used in the geodetic survey of the study area (Beaulard, Piedmont, northern Italy).
The GNSS campaign was conducted using double frequency and multi-constellation receivers and considering a post-processing approach ([10]), due to the lack of internet connection.
A master station was located for a session length of more than 4 hours on one of the vertices, whose coordinates were determined in post-processing by considering a single-base solution (Leica Geo Office v.8.3, Leica Geosystems®) with the permanent station of the Regione Piemonte CORSs (Continuous Operating Reference Stations) network as reference. A network adjustment was then carried out to estimate the other markers, which were valued with a sub-millimeter level of accuracy (σM = 3 mm) and the phase ambiguity was fixed for all points, which guaranteed a high precision for the georeferencing process. All other markers were measured, wherever possible, by GNSS instruments using Real Time Kinematic (RTK) approach. The coordinates were estimated using a commercial software in post-processing, considering a session length of about 10 sec for each point. In some cases, where vegetation cover was extremely high, target points were measured by traditional topographic instruments. The remaining markers were measured using a reflector. All measurements (Fig. 1) were subsequently adjusted (following the minimum constraint approach) with MicroSurvey StarNet v.7.0, to obtain the final coordinates. The root mean square (RMS) of the estimated coordinates was less than 1 cm.
The ellipsoidal heights measured with the GNSS instruments were converted into orthometric data using a local geoid height model (ITALGEO2005) provided by the Italian Military Geographic Institute.
Marker points were then used to georeference the 3D model, which was obtained by combining the laser scanner and the photogrammetric data.
Aerial image acquisition for photogrammetry
In order to perform the aerial acquisition using UAV, two issues must be considered ([11]): (i) choice of the system; (ii) acquisition and data processing strategy. As for the first point, two main categories can be chosen: fixed wings and multi-rotors. These systems have different performances in terms of payload, flight time and stability in data acquisition. For photogrammetric purposes, fixed wings are preferable in wide areas (at least 1.5 km radius), while multi-rotors are best for smaller areas (e.g., 400 × 400 m) or where vertical flight or hovering are required.
The acquisition and data processing strategy can be divided into the following steps:
- Mission planning: definition of the parameters that the UAV must know in order to perform the flight. These concern the study area and the geometry of the acquisition to define the path to follow and the relative flight altitude. These parameters rely on the expected final Ground Sample Distance (GSD) of the 3D model and the specific camera used. In the case of the used UAV, the mission planning software is unable to automatically estimate the flight parameters as a function of the expected final results, thus their estimation has to be done in advance.
- UAV flight and data acquisition: the flight is the operative step in the data acquisition. The UAV is able to perform an autonomous flight and record digital images following the waypoints previously defined in the flight plan. During the flight, some data, such as position and attitude of the system, were also recorded through the internal navigation sensors. However, this data is not accurate enough to perform a correct georeferencing of the model which is why GCPs are needed;
- Reference network: to use a global coordinate system, some vertices can be measured through a topographic or GNSS survey. These points are the local references for the subsequent GCP measurements.
- Ground control points: used to georeference the 3D model from the image block. These points must be located on the ground in positions that are clearly visible from the UAV in order to be included in the images.
- Model generation: consists on the image alignment to generate the 3D point clouds ([26]). Currently, it is possible to perform the triangulation through a photogrammetric or a SFM approach. From the 3D dense point clouds it is then possible to reconstruct the textured mesh.
- Final product extraction: typically, Dense Digital Surface Models (DDSMs) and orthophotos can be generated ([27]). They can be very useful for a complete geometrically correct description of the area in 3D, combined also with the radiometric information.
- Data integration ([21]): DDSMs and orthophotos can be finally integrated to generate the Solid Orthophoto, which gives a complete description of the study area.
To perform the aerial acquisition steps, a low-cost Hexakopter® (Mikrokopter, Moormerland, Germany) was used (Fig. 2), with specific modifications. This system is highly suitable for these applications because it enables detailed area and integrate satellite mapping to be acquired for forestry study and management ([7]). The system performs the flight autonomously, though its take-off and landing require the remote control by an expert pilot.
Fig. 2 - UAV used for aerial photogrammetry (Hexakopter®, Mikrokopter, Moormerland, Germany).
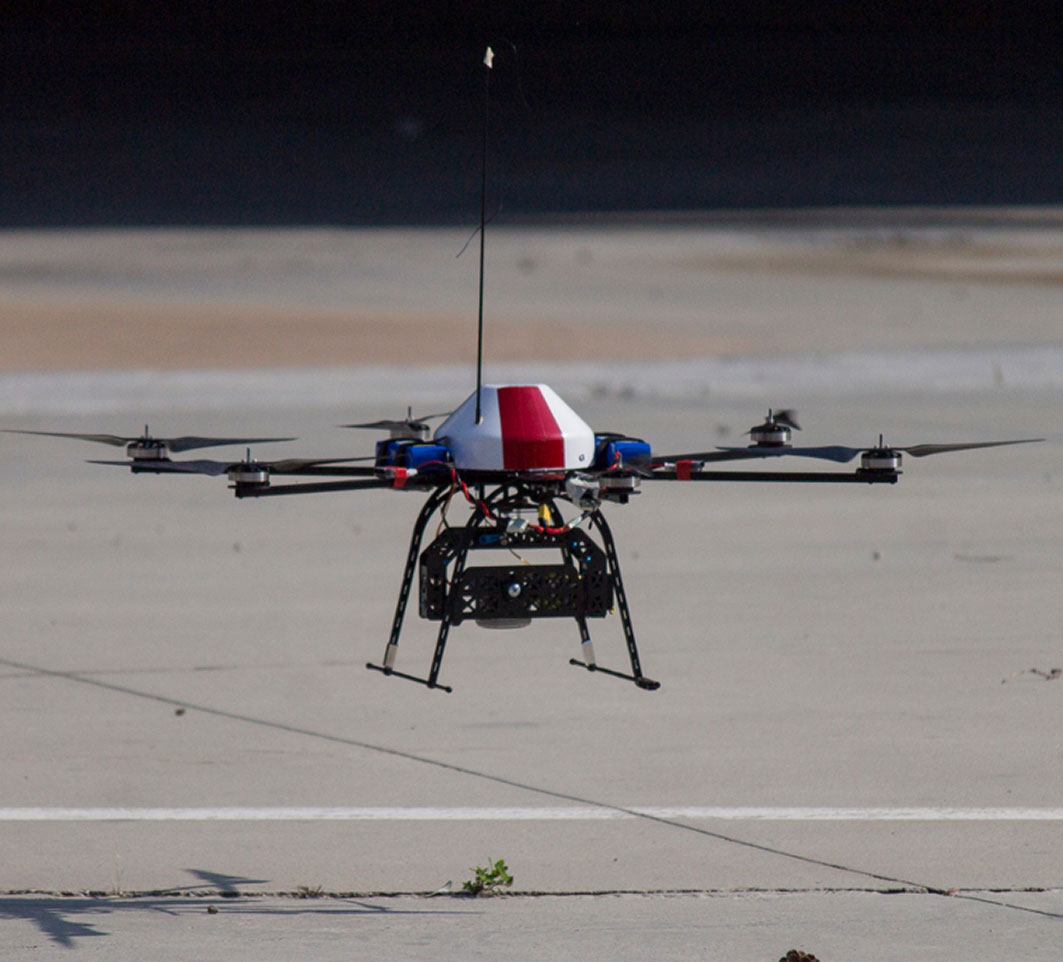
Several types of sensors can be installed on the UAV, depending on the specific application and the maximum payload of the system. The Hexakopter used in this test has a payload of up to 1.2 kg and a 10-15 minutes of flight autonomy. It was equipped with a Nex5® digital camera (Sony Ltd, Tokyo, Japan), with a CCD sensor of 16 Mpixel (4000 x 3000), a focal length of 16 mm and a sensor size of 23.0 × 15.6 mm. The camera automatically acquires the images with a fixed number of frames per second using a shutter cable. In order to preserve the initial position of the camera, it is mounted on a special servo-support that controls the rotations in two directions.
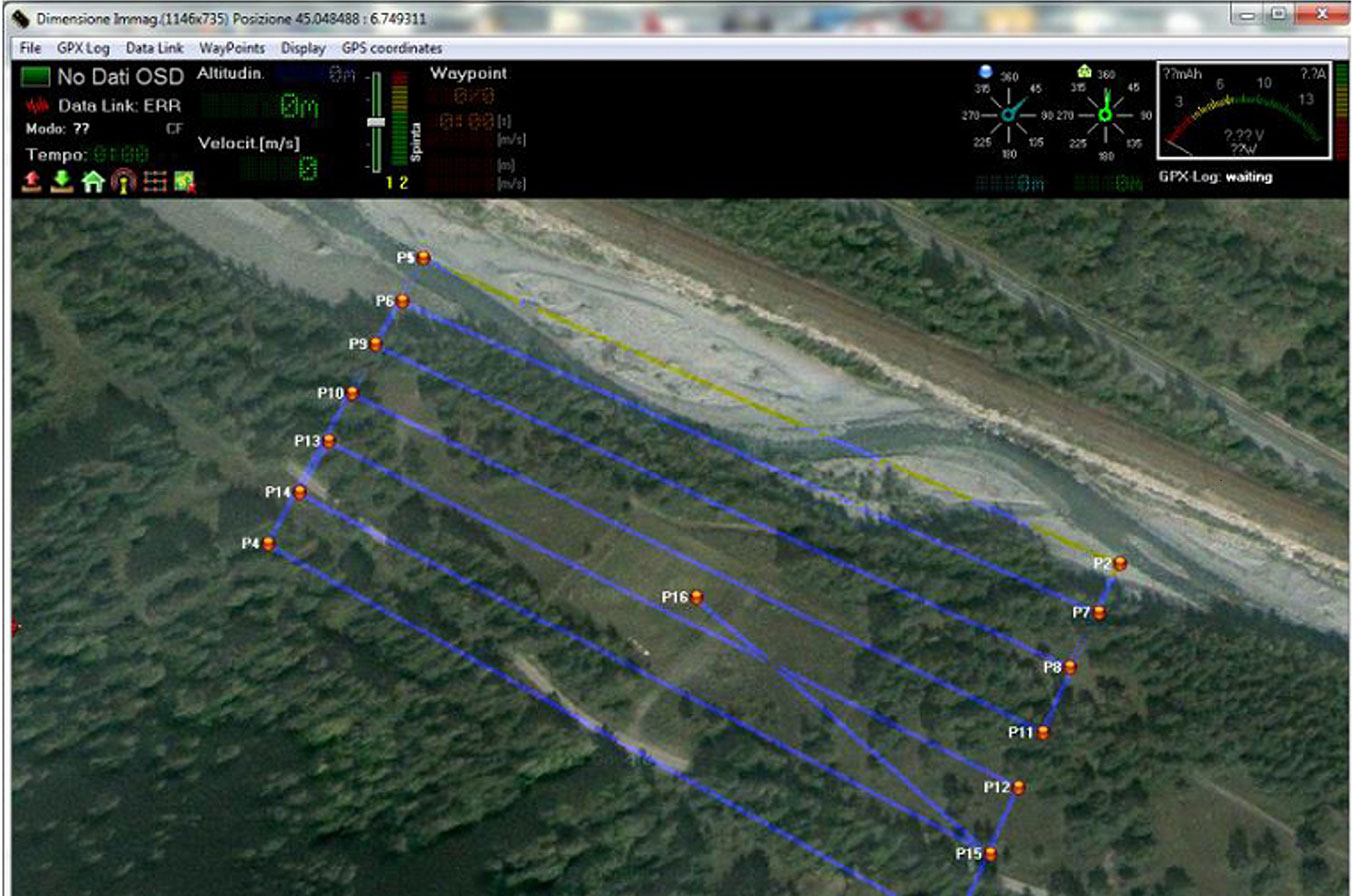
For the flight planning, several components are critical: (i) the geographic area where the flight is performed, the magnetic field of the site must be estimated and a suitable azimuth correction in the flight planning must be set (in our case it was calculated through the website ⇒ http://www.ngdc.noaa.gov/geomag-web); (ii) the flight height; (iii) the digital camera sensor specifications; (iv) the time of flight, which is a function of the speed and the number of lines required. Mikrokopter Tools can be used to organize the mission. The following options can be set: the 2D position of the waypoints in geographical coordinates; the flight height; the speed along each path; and the compass direction required during the flight. In the specific case of our study area, the flight was performed at a relative altitude of 50 m over seven parallel strips running in East-West direction and two boarding strips (Fig. 3). Flight data were uploaded onto the UAV using a wireless connection by a XBee module, which enables information on the position, orientation, height and speed during the flight to be received and sent.
Fig. 3 - Flight planning of the study area, with indication of the flight strips followed by the UAV.
The last step before acquisition involved the deployment of 31 wooden markers on the ground for the point clouds georeferencing, whose position can be acquired through a GNSS and/or topographic technique. Most points were surveyed through a GNSS receiver using a Real Time Kinematic (RTK) approach ([9]).
Terrestrial Laser Scanner
In forestry applications, the acquisition of information on tree trunks through aerial photogrammetry is not always possible due to foliage coverage. This problem can be overcome by using a terrestrial laser scanner. In this study, a Faro Focus 3D® laser scanner (CAM2, Lake Mary, FL, USA) was used, which has an acquisition range from 0.6 m to 130 m, and which is also able to acquire images through an integrated camera to color the point clouds.
Eight scans were performed to cover a test array of trees using the following settings: resolution 1/5 (i.e., 1 point every 7 mm at 5 m), acquisition speed of 244.000 points per second (each scan had about 17.500.000 points). Each acquisition required about four minutes for the acquisition of clouds and one minute for the collection of images.
The final 3D model can be obtained by integrating the aerial and terrestrial point clouds, but only if the clouds are defined in a unique reference system. Thus, 61 checkerboard markers were placed on the trees, which are automatically recognized by SCENE (software for data processing produced by FARO). The coordinates of each marker were determined using a total station.
Data processing
The laser scanner acquisition process
The laser data were processed using FARO’s Scene version 5.2. The process involved the following steps:
- scan integration and visualization (Fig. 4), the scans can be visualized in the project space;
- scan georeferencing: the software has an internal database that automatically detects the checkerboards in the cloud, although the targets can be selected manually. Given that the markers were topographically acquired, their coordinates were inserted into the software in the chosen reference system. The whole model was then automatically referenced and all the scans were related to each other;
- data filtering and coloring: sometimes unnecessary data (like remote objects or people) can be accidentally recorded; however they can be manually selected and deleted to reduce the point cloud and to facilitate data processing. Our point cloud was manually filtered to take only the points in the chosen area of interest. Finally, the images can be applied to the points to get a colored point cloud.
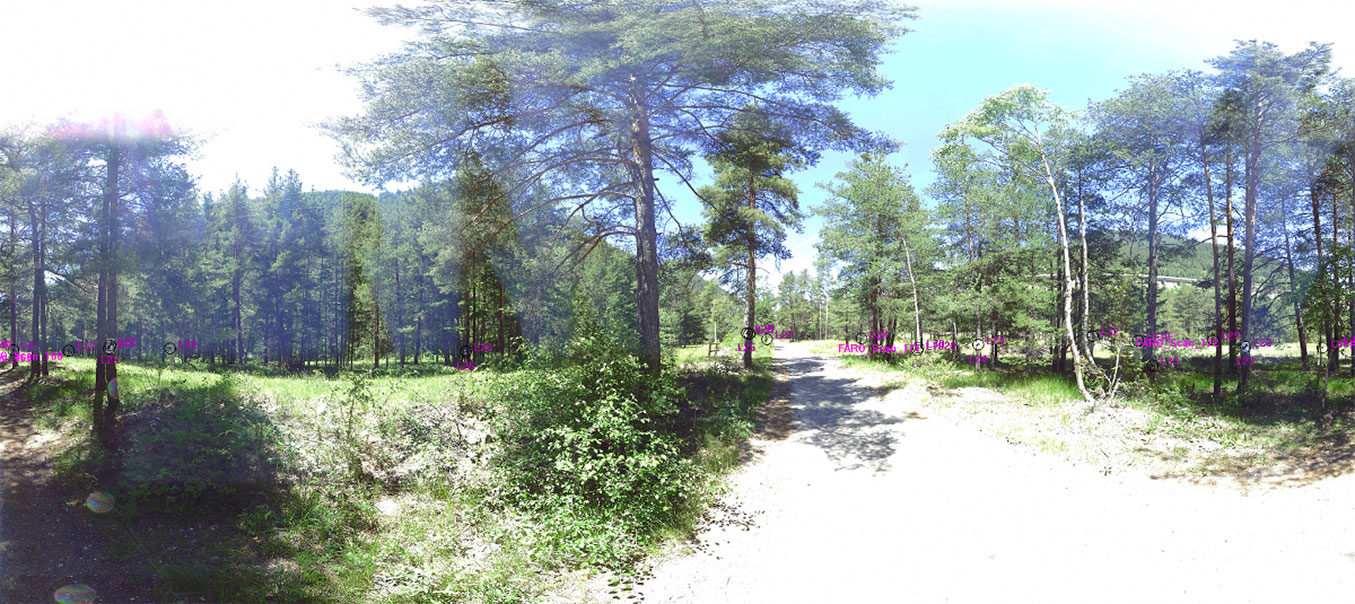
Fig. 4 - Example of a laser scanner colored point clouds.
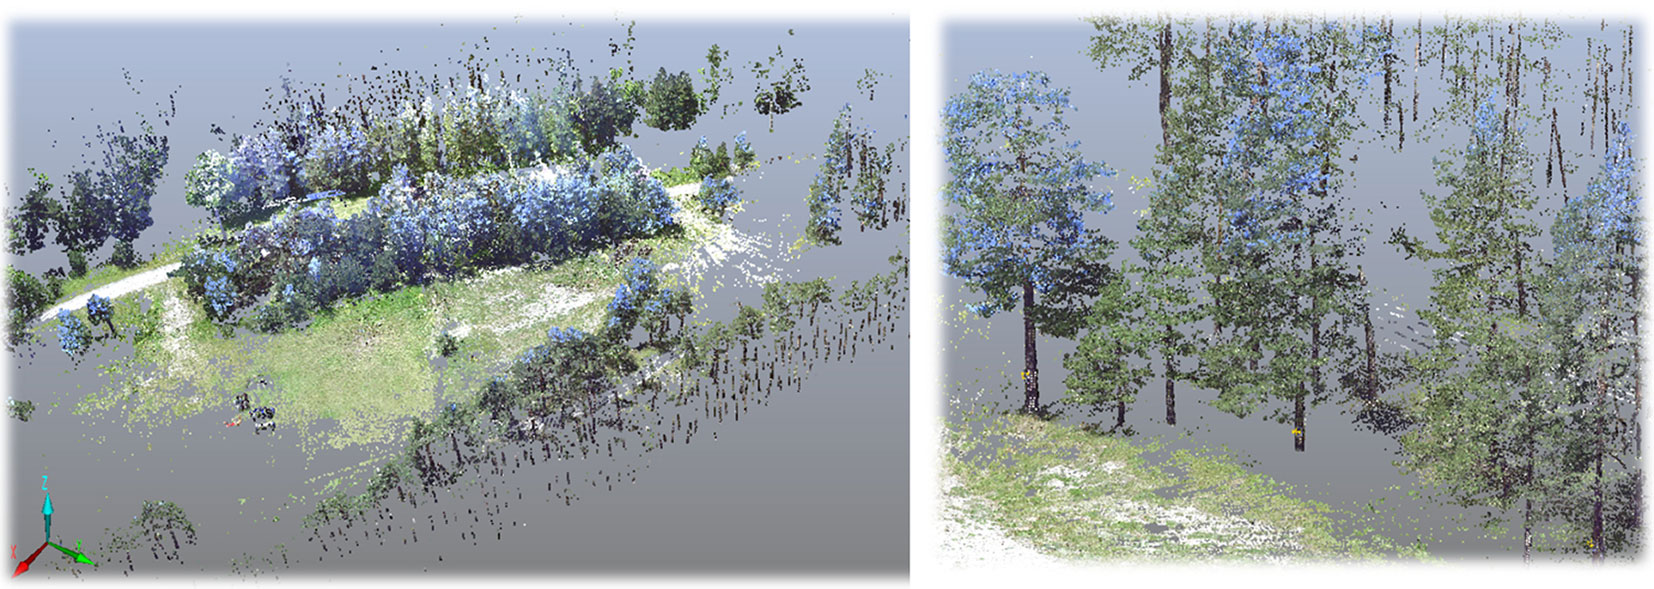
The results obtained by merging the colored point clouds are shown in Fig. 5. The whole process (PC: Windows 8, Intel Core i7, 8 GB RAM) took about 2-3 hours, and the outcome is a colored 3D point cloud composed of 77 million points.
Fig. 5 - Result of the registration of the 8-point clouds.
Processing the aerial photogrammetric data
Regarding the photogrammetric data analysis, software programs use dissimilar approaches, with both commercial and open source solutions ([26]). As for commercial solutions, users can only set a limited number of processing parameters, whereas open source softwares allow the users to control the whole process, and analyze both the results obtained and the algorithms used. In this study, photogrammetric data were processed using the software PhotoScan® (Agisoft LLC, St. Petersburg, Russia) for image triangulation to obtain a georeferenced 3D point cloud of the area. Data processing involved the following steps:
- Image alignment: the algorithm searches for common points on the images and matches them by finding the position of the camera for each picture and estimating the camera calibration parameters. The software then computes the camera positions and generates the first sparse point cloud.
- Dense cloud: this is based on the estimated camera positions and the sparse cloud built by PhotoScan. In the case of presence of many trees (as in this study), the best solution was to perform a low accuracy alignment and then improve the quality through high resolution dense point cloud generation.
- Mesh: the software can reconstruct a 3D polygonal mesh representing the object surface based on the dense point cloud. Generally there are two algorithmic methods that can be applied to 3D mesh generation: height field (for planar surfaces) and arbitrary (for any kind of object). In this study the height field method was used.
- Texture: the reconstructed mesh was textured and used to generate the orthophoto.
The coordinates of GCPs were used to adjust the alignment and to georeference the model into the correct reference system.
The dense point cloud was made up of 17.2 million points and the model was made up of 3.4 million faces and 1.7 million vertices. The whole processing took about 5-6 hours.
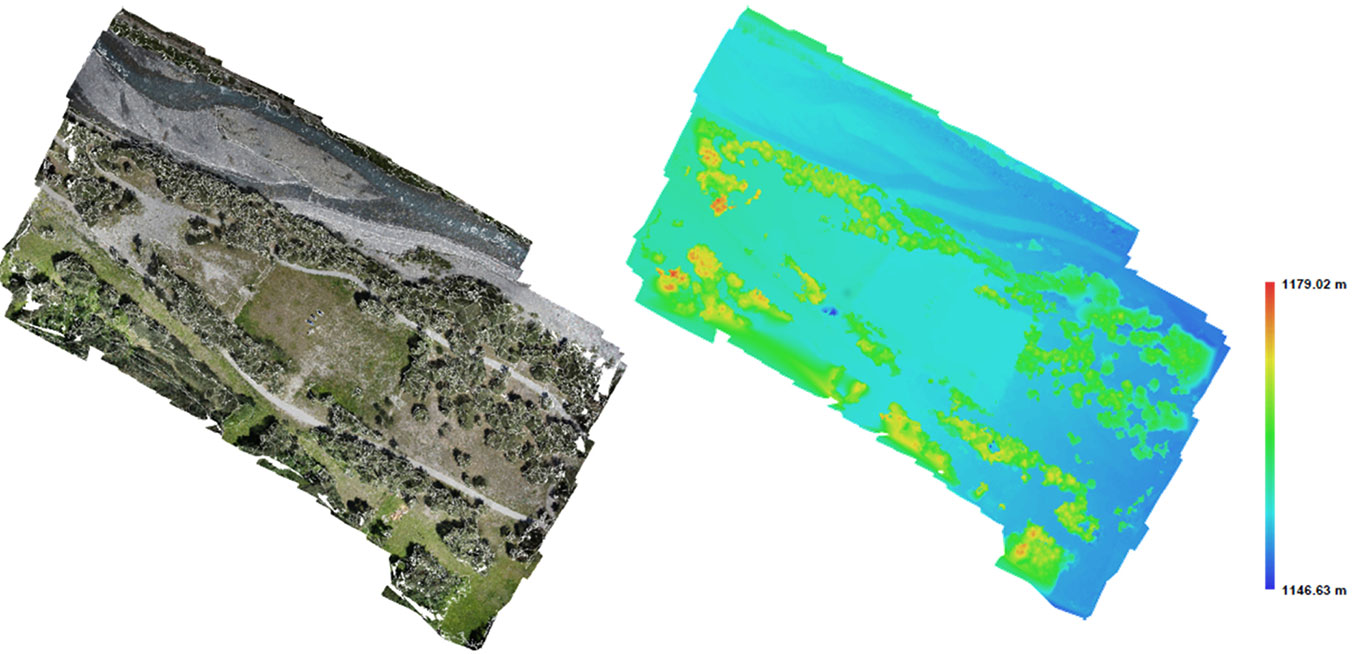
Photogrammetric triangulation can be used to generate an orthophoto and a DSM. These products were generated with a 5 cm resolution, as shown in Fig. 6.
Fig. 6 - Orthophoto and DSM generated by the photogrammetric technique.
Results and discussion
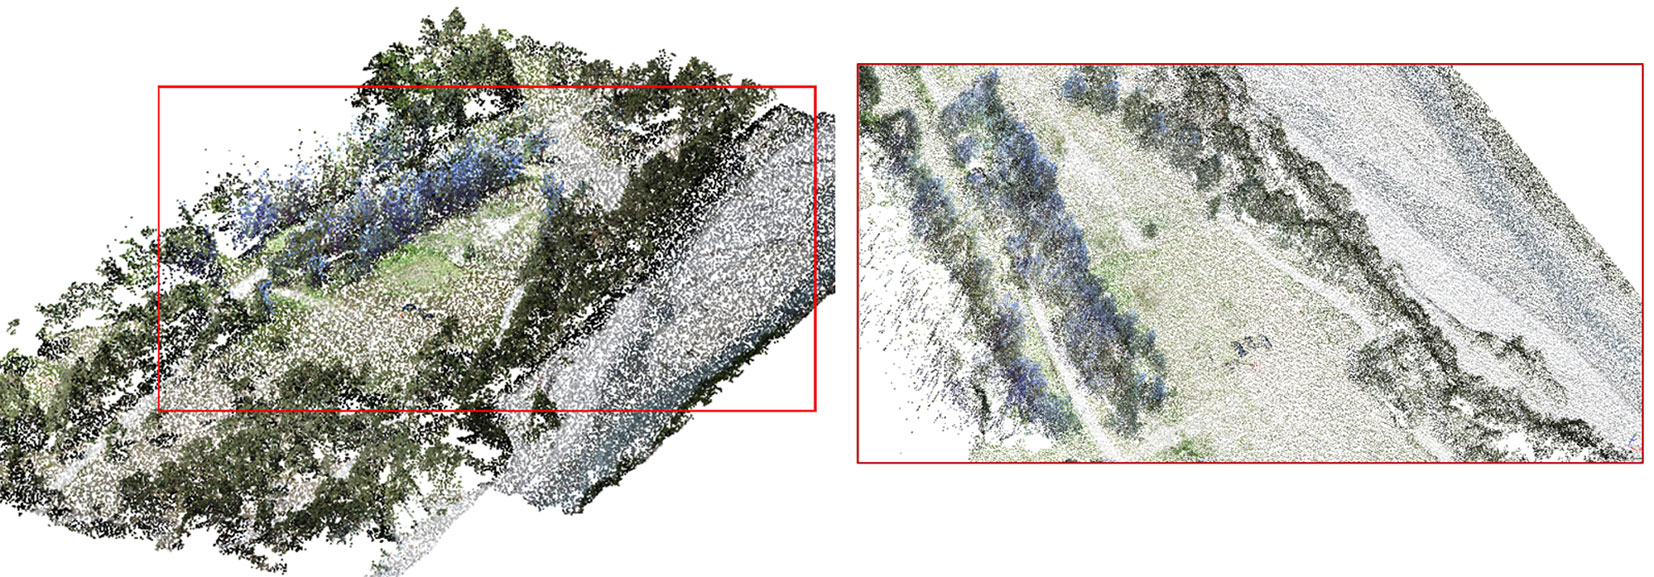
At the end of the process two dense point clouds were generated: the first was obtained by the laser scanner and the second by using the images. The two datasets were integrated by creating a unique point cloud, orthophoto and DDSM ([19]). Data merging was facilitated by the fact that the two clouds were in the same reference system, obtaining fully consistent results in terms of accuracy. The integration was performed by importing the 3D colored point clouds in .las format into the software 3DReshaper® (Technodigit, Genay, France), which merges the data and analyzes the results. The laser point cloud resulted to have a greater density compared to the photogrammetric point cloud; however, this did not hamper the integration of the two datasets (Fig. 7, Fig. 8).
Fig. 7 - Point clouds generated by the photogrammetric approach (left) and by TLS techniques (right).
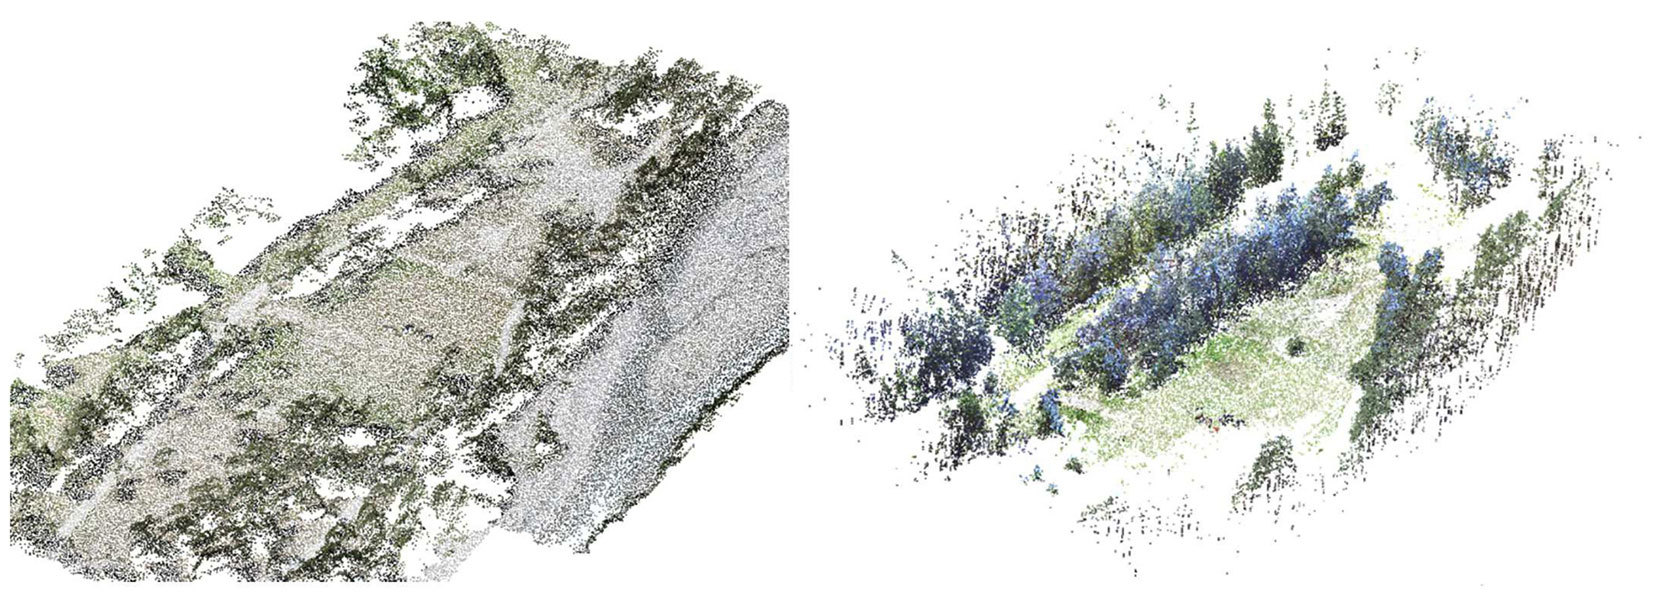
Fig. 8 - Results of the point cloud integration process.
A single 3D model of the study area was obtained with a resolution of 5 cm and a precision equal to 3 cm. The precision was estimated in comparison with the coordinates of the points topographically measured. Such model may be used in a wide range of application in forestry studies, from the reconstruction of 3D shapes of trees, to the study of tree growth, to other environmental analysis.
A critical aspect in the process of integration of TLS and UAV data could be the different accuracy of the points in the clouds, which depends on the methodology used. While photogrammetric analysis allows to estimate the accuracy of points (2 cm in our case), the accuracy of TLS data is more difficult to be obtained. In this study, the redundancy of the data, the limited distance between TLS and objects, and a network of markers with a high accuracy allowed to estimate a final precision of 3 cm.
Conclusions
Forest resource management can greatly benefit from the application of geomatic techniques through both terrestrial and aerial surveys and adequate resource mapping. Such techniques can be considered a useful tool for decision support and mountain forest management.
In this study, TLS and UAV photogrammetry techniques were investigated and integrated by combining the use of terrestrial laser scanner for tree modeling with UAV data for surface reconstruction. This integrated approach can easily and quickly provide all the necessary information on single trees and the shape of the forest, with no needs of time-consuming and expensive ground surveys. Indeed, the accuracy of the 3D model obtained in this study allows to obtain precise measurements of the main tree parameters (e.g., tree diameter and height). Further, the digital model of the forest obtained in this study will allow to monitor the investigated stands through time in a cost-effective way. In fact, the dense point cloud obtained allowed to generate also orthophotos and a DDSM from the photogrammetric triangulation (5 cm of resolution).
However, it is worth to stress that the acquisition step is the most crucial in the 3D model generation, since the SFM approach has proven to be reliable under strictly specific constraints. In fact, the application of the above methodology to forestry requires to correctly plan the flight (for example, by avoiding evaporation that can affect the accuracy of point data) and to adopt specific strategies in data processing to find common tie points between different images.
Laser scanner and photogrammetry data may be analyzed using semi-automated procedure. However, model georeferencing still requires the interactive selection of points, which the most time-consuming step and subjected to gross errors by the operator. To overcome possible sources of human error in data processing, direct georeferencing of images can be tested in the future, by applying external sensors during the flight recording the image position with high accuracy.
The availability of a digital model of the forest allows the development of automatic techniques for the estimation of the main stand parameters such as the standing volume, trees dimensions and characteristics, tree growth, etc.
Future developments of the approach presented here involve the inclusion of the third spatial information in the models with the aim of generating solid orthophotos of the stands analyzed ([5], [6]). This can be achieved by adding to the DDSM (Dense Digital Surface Model) another matrix with the same dimension and resolution to an image matrix (RGB) including the elevation data. Such orthophotos might allow various measurements (such as, 3D position of points, distances, angles and also volumes) to be obtained through a dedicated software called STOP (Solid True OrthoPhoto - [14]).
List of abbreviations
The following abbreviations were used throughout the paper:
- CCD: Charge-Coupled Device
- CORS: Continuous Operating Reference Station
- DDSM: Dense Digital Surface Model
- DSM: Digital Surface Model
- GNSS: Global Navigation Satellite System
- IGM: Istituto Geografico Militare
- ITALGEO95: Name of an Italian model of geoid
- LiDAR: Light Detection and Ranging
- NEWFOR: NEW technologies for a better mountain FORest timber mobilization
- RMS: root mean square
- SFM: Structure From Motion
- TLS: Terrestrial Laser Scanner
- UAV: Unmanned Aerial Vehicle
- OSP: orthophoto solid precision
Acknowledgements
The authors would like to thank Emanuele Lingua for the opportunity to participate in the NEWFOR Project, and Paolo Maschio for his valuable help in piloting the UAV.
All the authors carried out the field measurements. IA carried out TLS measurements and the post-processing of these data and those obtained from instruments installed on UAV. IA drafted the manuscript with PD, who also carried out GNSS measurements in the field and their post-processing. AL conceived the study and helped to draft the manuscript. MP carried out UAV measurements and coordinated the acquisition procedures and the processing phase.
References
Gscholar
Gscholar
Online | Gscholar
Gscholar
CrossRef | Gscholar
CrossRef | Gscholar
Gscholar
Online | Gscholar
Authors’ Info
Authors’ Affiliation
Paolo Dabove
Andrea Maria Lingua
Marco Piras
Environment, Land, and Infrastructure Department (DIATI), Politecnico di Torino, c.so Duca degli Abruzzi 24, I-10129 Turin (Italy)
Corresponding author
Paper Info
Citation
Aicardi I, Dabove P, Lingua AM, Piras M (2016). Integration between TLS and UAV photogrammetry techniques for forestry applications. iForest 10: 41-47. - doi: 10.3832/ifor1780-009
Academic Editor
Davide Travaglini
Paper history
Received: Jul 27, 2015
Accepted: Mar 04, 2016
First online: Jun 23, 2016
Publication Date: Feb 28, 2017
Publication Time: 3.70 months
Copyright Information
© SISEF - The Italian Society of Silviculture and Forest Ecology 2016
Open Access
This article is distributed under the terms of the Creative Commons Attribution-Non Commercial 4.0 International (https://creativecommons.org/licenses/by-nc/4.0/), which permits unrestricted use, distribution, and reproduction in any medium, provided you give appropriate credit to the original author(s) and the source, provide a link to the Creative Commons license, and indicate if changes were made.

Web Metrics
Breakdown by View Type
Article Usage
Total Article Views: 61163
(from publication date up to now)
Breakdown by View Type
HTML Page Views: 45703
Abstract Page Views: 4164
PDF Downloads: 9730
Citation/Reference Downloads: 80
XML Downloads: 1486
Web Metrics
Days since publication: 3656
Overall contacts: 61163
Avg. contacts per week: 117.11
Article Citations
Article citations are based on data periodically collected from the Clarivate Web of Science web site
(last update: Mar 2025)
Total number of cites (since 2017): 34
Average cites per year: 3.78
Publication Metrics
by Dimensions ©
Articles citing this article
List of the papers citing this article based on CrossRef Cited-by.
Related Contents
iForest Similar Articles
Review Papers
Accuracy of determining specific parameters of the urban forest using remote sensing
vol. 12, pp. 498-510 (online: 02 December 2019)
Research Articles
Accuracy assessment of different photogrammetric software for processing data from low-cost UAV platforms in forest conditions
vol. 12, pp. 435-441 (online: 01 September 2019)
Review Papers
Remote sensing-supported vegetation parameters for regional climate models: a brief review
vol. 3, pp. 98-101 (online: 15 July 2010)
Research Articles
Integrating area-based and individual tree detection approaches for estimating tree volume in plantation inventory using aerial image and airborne laser scanning data
vol. 10, pp. 296-302 (online: 15 December 2016)
Review Papers
Remote sensing of selective logging in tropical forests: current state and future directions
vol. 13, pp. 286-300 (online: 10 July 2020)
Research Articles
Identification and characterization of gaps and roads in the Amazon rainforest with LiDAR data
vol. 17, pp. 229-235 (online: 03 August 2024)
Review Papers
Remote sensing support for post fire forest management
vol. 1, pp. 6-12 (online: 28 February 2008)
Research Articles
Use of unmanned aerial vehicles for the diagnosis of parasitic plant infestation at the crown level in Pinus hartwegii
vol. 16, pp. 282-289 (online: 28 October 2023)
Technical Reports
Detecting tree water deficit by very low altitude remote sensing
vol. 10, pp. 215-219 (online: 11 February 2017)
Research Articles
Three-dimensional forest stand height map production utilizing airborne laser scanning dense point clouds and precise quality evaluation
vol. 10, pp. 491-497 (online: 12 April 2017)
iForest Database Search
Search By Author
Search By Keyword
Google Scholar Search
Citing Articles
Search By Author
Search By Keywords
PubMed Search
Search By Author
Search By Keyword


