Distribution of juveniles of tree species along a canopy closure gradient in a tropical cloud forest of the Venezuelan Andes
iForest - Biogeosciences and Forestry, Volume 9, Issue 3, Pages 363-369 (2015)
doi: https://doi.org/10.3832/ifor1568-008
Published: Dec 08, 2015 - Copyright © 2015 SISEF
Research Articles
Abstract
Cloud forests represent a minor portion of the world forests, though outstanding in terms of biodiversity, endemisms, and environmental services provided. Understanding the factors that drive the regeneration and species composition of these forests, and in particular how light availability affects the patterns of juvenile tree distribution in the understory, is critical for conservation and restoration programs. In this study, we determined the range-size and overlap of the abundance distribution of juveniles for 20 tree species in an Andean tropical cloud forest in Venezuela along a gradient of percentage canopy openness (%CO) used as a surrogate of light availability. The observed distribution of %CO was then compared with a bounded null model of community structure in order to test light partitioning as a driver of tree species’ coexistence. We measured %CO using hemispherical photography and the abundance and size of juvenile trees in 280 plots of 1-m radius spread over a 32 ha forest area. The distribution of sites was skewed towards the lower end of the %CO gradient (0.5 to 12.8%), while species abundance sharply diminished at both ends of the gradient. Nevertheless, 15 out of 20 species had a non-random distribution in relation to %CO, with many species concentrated near the lower side of the gradient. The observed pattern of species’ overlap was within the 95% confidence limits for the average overlap expected under the bounded null model. These patterns indicate that low canopy openness is the rule in this forest, in spite of the scattered tree-fall gaps, and suggest that light partitioning does not determine the tree community structure at the juvenile stage. High redundancy in light requirements among juveniles of tree species may have a positive effect on species coexistence in cloud forests, thus maintaining a high species diversity. However, other factors such as recruitment limitation and differential growth/carbon-gain among species at the juvenile stage along the light gradient could contribute to the high diversity of these ecosystems.
Keywords
Natural Regeneration, Light Availability, Understory, Shade Tolerance, Hemispherical Photography, Null Models
Introduction
Andean tropical cloud forests are among the most diverse and fragile forest ecosystems in the world ([45], [6]). However, they are subject to high rates of deforestation and anthropogenic intervention ([23]). Conservation of cloud forests is of great importance due to their high biodiversity and endemism, and their role in maintaining water balance and preventing erosive processes in high mountain watersheds ([3]).
A persistent cloudiness for a large part of the year characterizes the tropical cloud forests ([3]). Like other tropical forests, the environment in cloud forest understory is very heterogeneous at spatial and temporal scales. The frequent cloudiness together with high topographic variation accentuates this heterogeneity, which imposes energetic limitations and affects other factors such as evapotranspiration, temperature and humidity ([24], [42]).
In the understory of tropical forests, light is the main limiting resource for germination, growth, and survival ([39], [38]). In these forests there is a wide light gradient from low irradiance levels (1-2%) under closed canopies up to 25-30% in large gaps ([9], [17]). Hence, tree species have developed strategies to cope with the limitations imposed by this resource. Several researchers suggested that overlap of juveniles of tree species could explain the coexistence of a high number of species in tropical forests in terms of partitioning of the light environment. This partitioning has been associated with the formation of varying size gaps in the forest ([15]). Accordingly, the aim of several studies was to identify functional groups associated with the species’ light requirements. For example, Bazzaz & Pickett ([4]) proposed the dichotomy between shade intolerant species requiring large amounts of light to survive and grow, and shade tolerant species. Swaine & Whitmore ([44]) proposed a simple division of tree species into two groups: pioneer or not pioneer (or climax) based on seed germination and seedling establishment. Other studies based on these functional groups focused on comparing the abundance and performance of juvenile trees between gap and non-gap sites or among gaps of different size classes ([15], [16], [35], [5], [39], [47]). However, several of these studies found no evidence that niche partitioning explains the coexistence of many species in gaps ([5], [39], [47], [14]). It has been pointed out that these studies have not considered either the continuous nature of the light gradient or the fact that in a dense forest the proportion of sites with medium to large gaps is very small ([5], [1], [2], [39], [30]). Furthermore, the light gradient in the forest understory does not necessarily correlate with the spatial location of the gap (i.e., light can reach a point in the forest floor as direct or diffuse light), and depending on geographical and topographical factors, light beam angle and intensity can vary widely ([8]). Other authors have suggested that a considerable overlap could occur among the distribution ranges of juveniles of tree species ([30]). So far, few studies have analyzed to what extent co-occurring species overlap along the light gradient ([29], [30]).
To address these problems, Lusk et al. ([30]) proposed a method based on the “range-size” model ([22], [12]) in which the forest understory light gradient is defined as a bounded domain with a “hard” lower boundary represented by absence of light and a “diffuse” upper boundary determined by the size of the largest canopy opening. According to these authors, the gradient boundaries impose constraints that influence the overlap of the range of species distributions along the gradient, despite other factors such as competition may have a large influence on community structure ([30]). The average range size of the cumulative distribution of the abundance of juveniles of each species is plotted along the light gradient represented by the percentage of canopy openness (%CO), and the average pairwise overlap of these ranges is estimated. Further, the empirical average overlap distribution is compared against a bounded null model of community structure using a resampling technique. The bounded null model assumes that: (i) domain boundaries depresses species abundance through their influence on range size. This is known as the “mid-domain effect” which is the increasing overlap of species ranges towards the center of a shared domain bounded by geometric constraints in relation to the distribution of species’ range sizes. Towards the center of the domain occurs a peak or plateau of species richness ([12]); (ii) species with optima close to domain boundaries are limited to a narrow range; and (iii) narrow ranges (in any part of the gradient) may predispose species to local extinction in dynamic understory light environments ([30]). This model predicts that both density of species optima and species overlap should be highest in the domain center (intermediate light environments) and lowest close to the domain boundaries. Understanding the causes of the high tree diversity of these forests is crucial for conservation and restoration purposes. Unfortunately, there is little comprehension of the mechanisms allowing the coexistence of this high number of species, even in the most conspicuous forest component, the tree community. It is likely that, a set of processes operating at the juvenile stage largely contributes to determine tree community composition and diversity. Since light is a limiting factor in these ecosystems and juveniles are constrained to develop in their understory or to take advantage of canopy openings, we hypothesize that light gradient partitioning plays a major role in determining the tree community structure. To test this hypothesis we analyzed the range size distributions and the degree of overlap of juvenile tree species along a gradient of canopy openness for 20 tree species in an Andean cloud forest.
Materials and methods
Study site
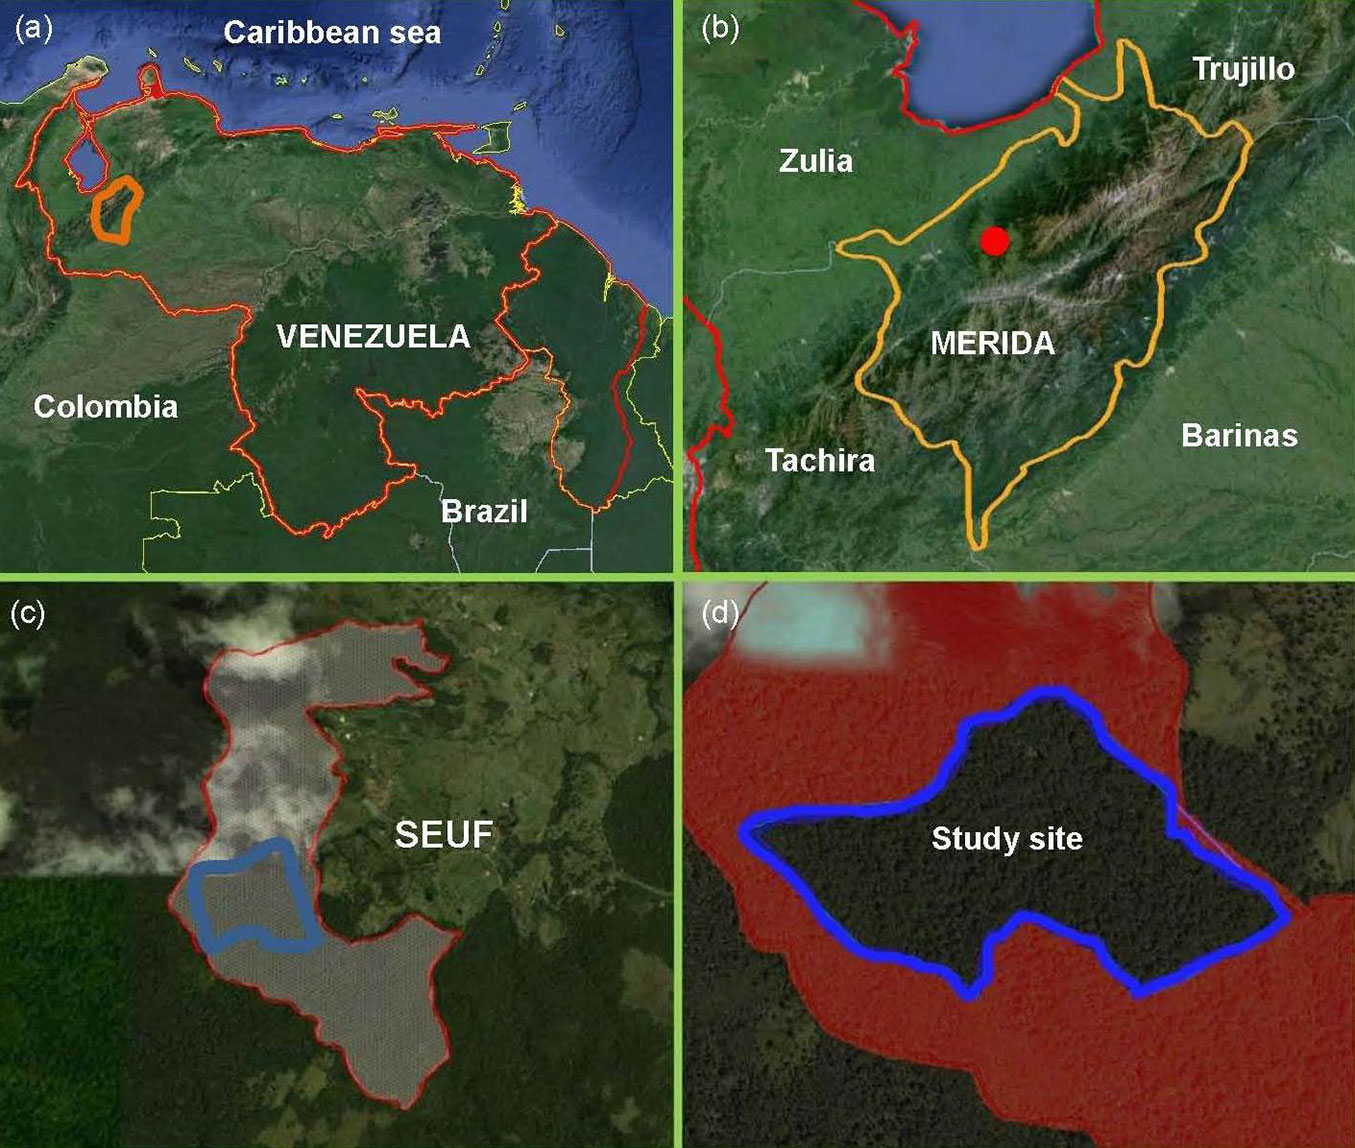
The study was undertaken in a tract of tropical cloud forest at the San Eusebio University Forest (SEUF) in the Venezuelan Andes (8° 37′ N; 71° 21′ W) in Mérida state (Fig. 1a-d). Elevation ranges from 2200 to 2500 m a.s.l.; precipitation varies between 1400 and 1560 mm annually with a short dry season (December-February) and a wet season (March-November). Annual average temperature is 14.9°C and average photosynthetic photon flux in open sky is 1561 ± 77.2 μmolm-2 s-1 ([21]). The forest grows on soils derived from the Colón cretacean formation characterized by stratified, massive, black, non-calcareous lutites with conchoidal fracture. The landscape consists of rounded hills, with shallow to steep slopes ([31]). The SEUF is part of the only sizable evergreen mixed (conifers and broad-leaved) forests in Venezuela ([28]). The forest is thick and rich in evergreen tree species densely covered by epiphytes, mosses, and lichens. The main tree families are Lauraceae, Melastomataceae, Guttiferae, Euphorbiaceae, Myrtaceae, and Podocarpaceae. The forest comprises various plant communities ranging from dense high forest (DHF) with complex stratification and a canopy 25-30 m high to sparse low stature forests with canopies less than 15 m. The DHF has three layers: the upper layer approximately 25-30 m in height with emergent trees up to 40 m tall (mainly the coniferous species Retrophyllum rospigliosii), an intermediate layer 20-24 m in height, and a lower layer 10-19 m. The understory comprises tree seedlings and saplings, shrubs, vines, palms, and herbaceous plants. Tree ferns (Cyathea spp.) and bamboos (Chusquea spp.) are common, the latter forming dense scrubs ([43], [40]).
Fig. 1 - Study site location. Satellite images including the boundaries of (a) Venezuela; (b) Mérida State; (c) San Eusebio University Forest (SEUF); and (d) study site ca. 32 ha (Images from Google Earth v5.0 July, 2013).
In the DHF, a 32 ha area was sampled to measure juvenile tree species abundance along a gradient of canopy openness. The sampling procedure consisted of a systematic virtual grid drawn from a random point selected on a vegetation map within the tract boundaries ([41]). The grid consisted of parallel transects 100 to 1000 m in length depending on the tract boundaries, and 100 m apart. Sample points were marked at 30 m intervals with the first point in each transect randomly chosen. We uploaded the vegetation map and the virtual grid in a Garmin GPSmap 60 CSX® using MapSetToolkit® v. 1.40 (Garmin International Inc., Olathe, KS, USA). In this way, the selected points could be reached using the shortest path, avoiding obstacles such as steep slopes, and minimizing the impact caused by the opening of access trails. A total of 30 points (15 in “non-disturbed” areas and 15 in “gaps”) was selected randomly after discarding points in inaccessible sites (steep slopes, riverbeds). The selected points were from sites with no apparent perturbation (closed canopy, absence of fallen trees) to sites with gaps of various sizes (50-500 m2). Juveniles of tree species, 30-150 cm in height were recorded in circular plots (radius = 1 m). For most species, individuals below 30 cm were very susceptible to death from events such as drought, flood, and pathogens. Individuals taller than 150 cm were discarded because light availability was measured at that height. Juveniles were measured only in the rainy season (1975 individuals). For each individual we recorded species name and total height. Around points placed in non-disturbed areas, eight plots were established in a circular 200 m2 area (120 plots). The gaps were delimited following the method proposed by Brokaw & Busing ([5]) and the plots were distributed from border to gap center (160 total plots). In each plot, a hemispherical photograph was taken in both dry (February) and rainy (October) seasons of 2010.
Hemispherical hotographs
Hemispherical photography is one among several techniques used for estimating light availability and canopy structure. The principle of this method is that a fish eye lens captures an image that spans a 180° arc, and when pointed vertically can capture all possible angles of incoming light ([7]). Other popular methods include the LAI-2000® (plant canopy analyzer - Li-cor, Lincoln, NE, USA), spherical densitometers, AccuPAR® ceptometer (Decagon Devices, Pullman, WA, USA), LIDAR, TRAC (Tracing radiation and architecture of canopies), and photosensitive diazo paper ([27], [10], [7]). There are several methods to determine light and canopy properties under a set of environmental conditions and ecosystems. Each method has advantages and disadvantages for estimating the various components of light availability and canopy structure. Some of them are very costly (e.g., LIDAR, LAI2000), others although cheap (e.g., densitometers, photosensitive diazo paper) are strongly subjective ([7]). Hemispherical photography is an option of intermediate cost that has several advantages such as a spatial discrimination, acquisition of foliage angular distribution, and gap fractions at different zenith and azimuthal angles. Digital hemispherical photography is becoming less expensive, and images can be acquired easily. Also, they can be stored as permanent records, making it possible to get repeated records over time of the variation in light and canopy properties of the same point ([11], [10]). However, hemispherical photographs have several disadvantages such as the need for certain environmental conditions to enable photographs to be taken (overcast sky), correct exposure, including diaphragm aperture, time of exposure, correction of lens distortion, and tedious work in processing the images ([48], [26]). Nonetheless, the continuous progress in digital camera technology, software for processing raw data and efforts to standardize protocols of image acquisition and processing make this one of the most promising methods for analyzing light availability and canopy properties.
We took hemispherical photographs to estimate the percentage of canopy openness at the center of each plot using a 10 Mp digital camera Nikon COOLPIX® P5000 with a “Fisheye Converter” Nikon FC-E8 with a 183° optical field. The camera was mounted on a tripod and leveled with the top of the lens standing 150 cm above the ground. We took photographs only in overcast conditions using an appropriate degree of exposure following the protocol proposed by Zhang et al. ([48]). For image processing, we used Gap Light Analyzer (GLA) v. 2.0 ([19]). We corrected the lens distortion (from 183° to 180°) with a third degree polynomial equation ([20] - eqn. 1):
where Y is the radial position of a projected point measured in pixels from the optical center of a full resolution digital image (1600 × 1200 pixels) and X is the angular distance (0° ≤ X ≤ 90°). For differentiating sky from vegetation pixels, we used the software SIDELOOK ([36]). We selected the blue channel to maximize pixel differentiation. The software automatically transforms the images (n = 560) to black and white and generates the optimal threshold for differentiating between sky and vegetation pixels. For each optimized image, GLA computes a set of variables related to light environment and canopy structure. As inputs, GLA requires: latitude, longitude, altitude, growing season interval, slope, cloudiness index, solar constant, and spectral fraction of the study site. The program simulates the potential amount of light that would reach a given point on the forest floor throughout the growing season and generates several outputs such as %CO among other variables.
Juvenile tree distribution along the light gradient
The percentage of canopy openness (%CO) was used as a surrogate of the light environment ([39], [30], [46]). It is defined as the percentage of sky that can be seen from below the canopy ([19]). This variable is widely used because it is easy to measure without the need for costly devices. In many forests, there is a strong bias towards sites with %CO ≤ 5% ([34], [30]), thus almost everywhere the %CO is very low. Therefore, a large proportion of the forest is favorable for regeneration of shade tolerant species, but few places exist in which light demanding species can regenerate. Given the large areas for growth of shade tolerant species, small differences in light requirements could suffice to avoid competitive exclusion and allow the coexistence of populations of numerous species. To avoid underestimating the relative abundance of species at the upper end of the light gradient, the plots were ordered from low to high values of %CO and transformed to a percentage scale (i.e., 0% for the lowest value and 100% for the highest). Therefore, equal intervals in the transformed %CO scale represent equal areas of microsite availability. The median and interquartile range (IQR) of the distribution of each species was represented over the axis of the transformed gradient of %CO. The sum of all species’ individuals produces the accumulated distribution for the whole forest. The IQR is a robust indicator of species’ distribution since it excludes extreme values at both extremes of the gradient ([30]). A goodness of fit Kolmogorov-Smirnov test was used to detect non-randomness in the IQR of the abundance distribution of each species against the cumulative empirical distribution of the %CO for the whole forest. If the p-value for a species is ≥ 0.05, then its abundance distributes randomly along the %CO gradient, i.e., the light environment has no effect on the distribution of juveniles of that species Lusk et al. ([30]).
For comparing the average pairwise overlap of the empirical species IQR on the rank-transformed canopy openness with the proposed bounded null model, we used the Mid-domain Null Monte Carlo simulation procedure ([32]) to generate 95% confidence intervals for the predicted average pairwise overlap interquartile distribution from the null model based on the midpoints of the empirical species distributions. We ran 1000 simulations using resampling with replacement. If the empirical pattern of the predicted average pairwise overlap departs strongly from the confidence limits for the null model distribution, then the results should be consistent with the hypothesis that there is a partitioning of the light environment by the juveniles of tree species along the gradient of %CO.
Results
Percentage of canopy openness
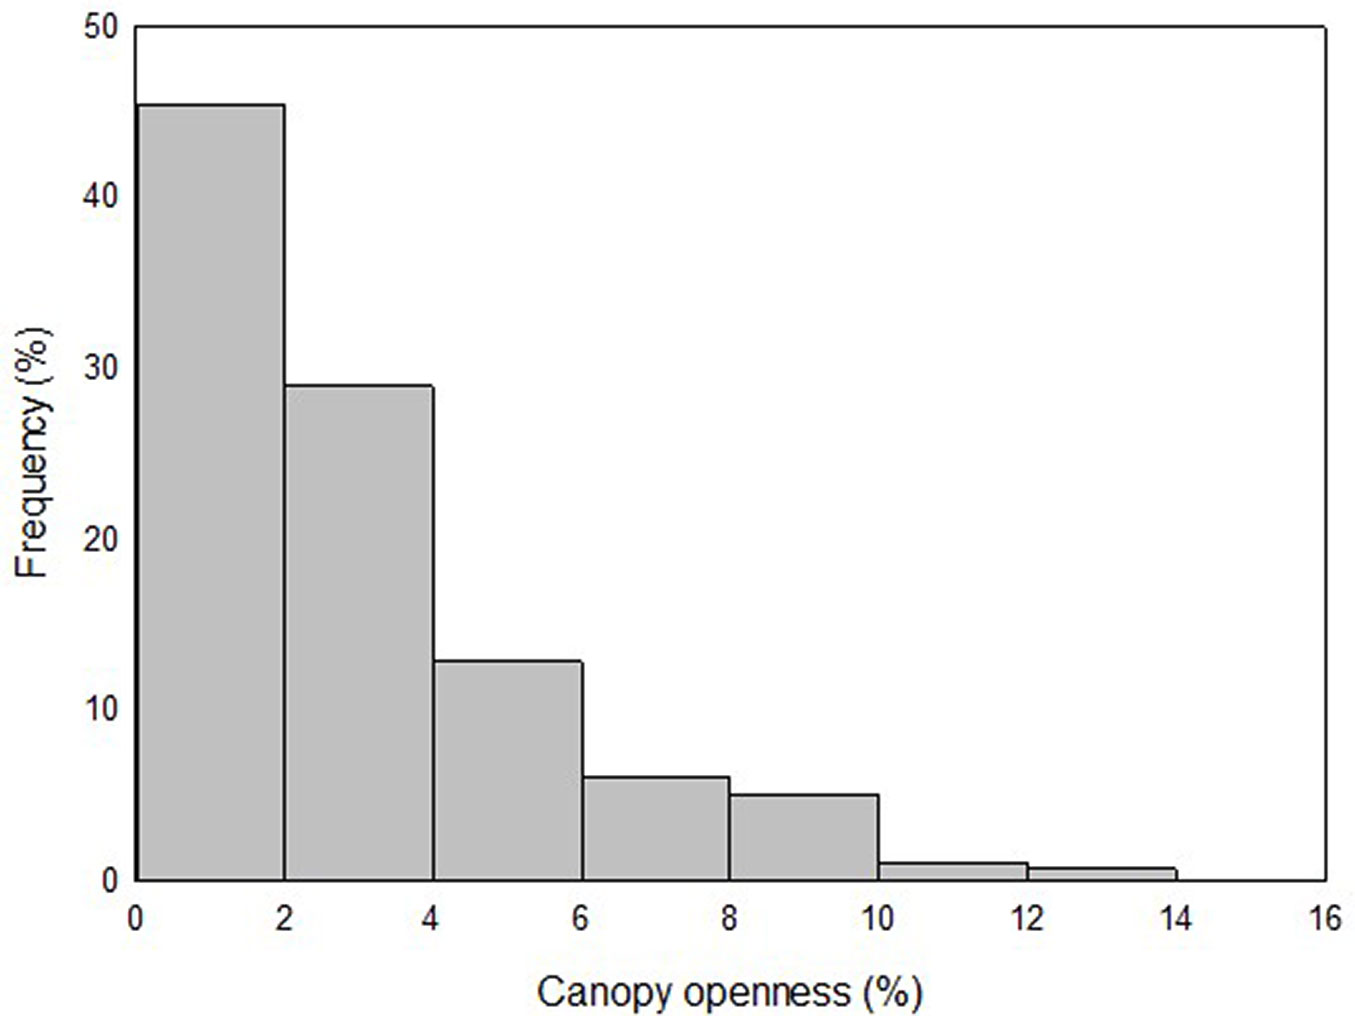
More than 75% of the plots showed a %CO ≤ 4.5% and 50% had a %CO ≤ 2.2%. Maximum %CO was 12.6 % (Fig. 2). There were no statistically significant differences in %CO between the rainy and dry seasons (p = 0.134, paired student t-test, n = 280).
Fig. 2 - Frequency distribution of plots according to percentage of canopy openness above 1.5 m in the understory of the dense high forest (DHF) at San Eusebio University Forest (SEUF), Mérida, Venezuela.
Juvenile distribution on the %CO gradient
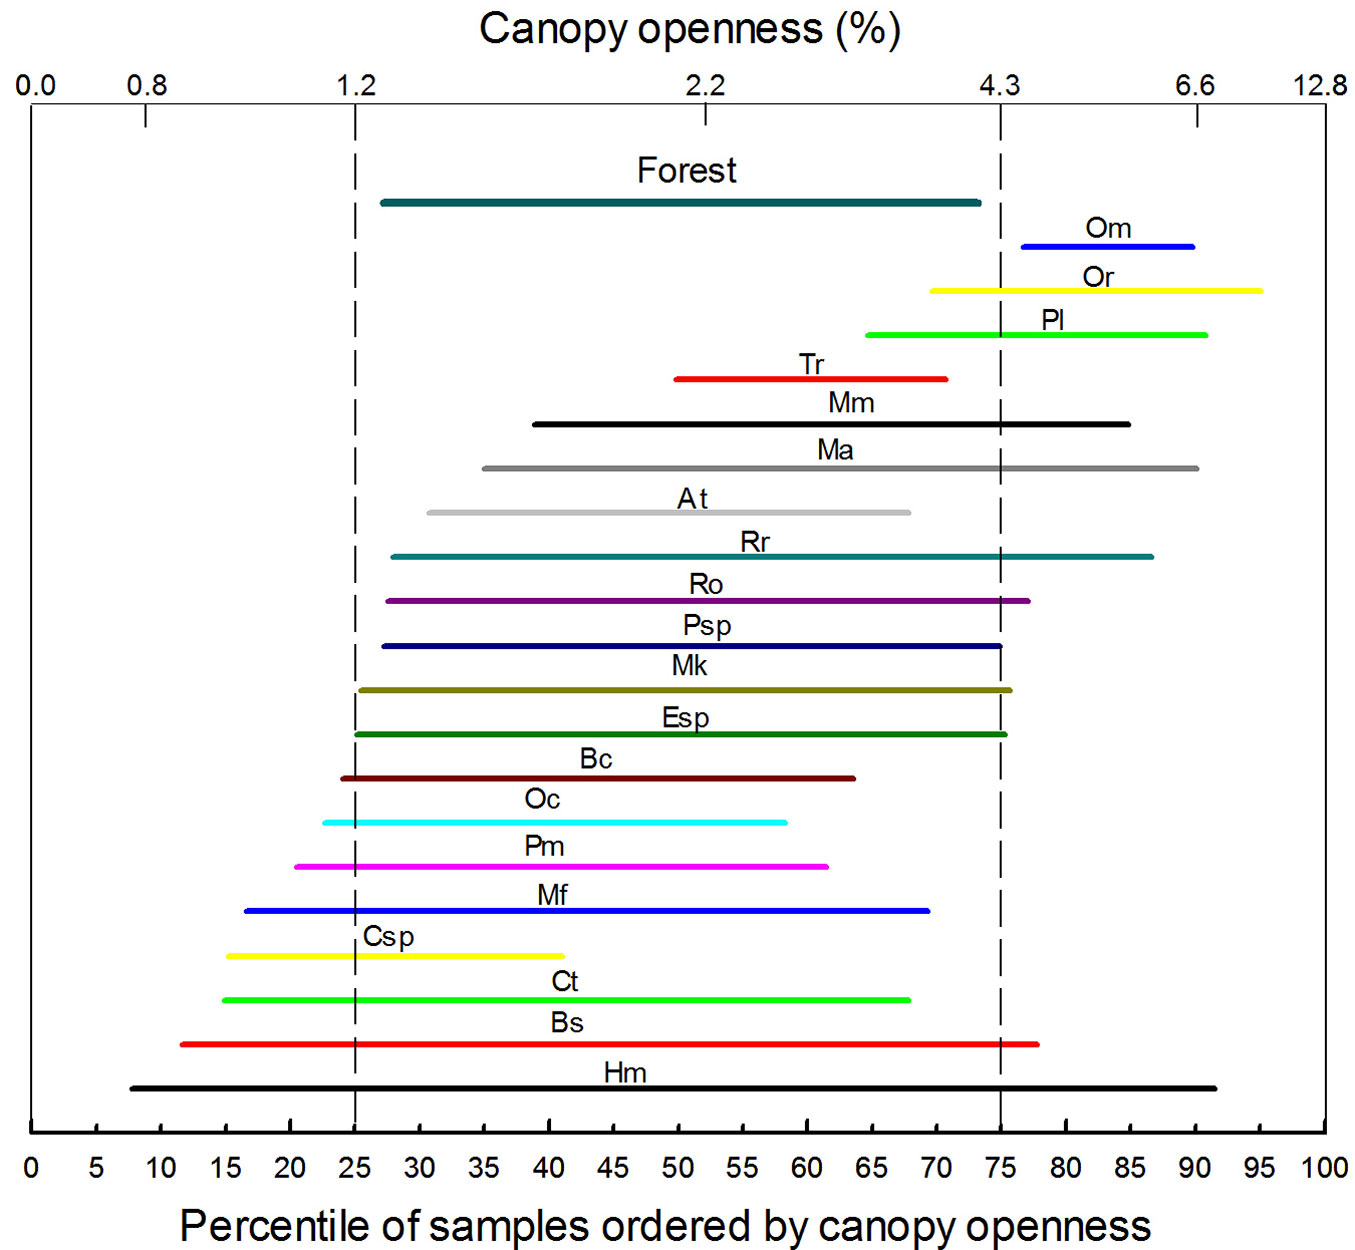
The Kolmogorov-Smirnov test showed that only five of 20 species (only those species with at least 10 individuals were included) had their juveniles randomly distributed in relation to %CO (p>0.05): Myrcianthes karsteniana, Myrcia fallax, Aegiphila terniflora, Roupala obovata and Psicotria spp. (Tab. 1). All the others had clearly non-random distributions with p-values well below 0.05. This suggests a certain degree of light partitioning by the juveniles of tree species. The abundance IQRs show that a high number of species concentrate in a %CO ≤ 6.6% (Fig. 3). The abundance IQR of all combined species (identified as “Forest” in Fig. 3) matched approximately with the IQR of the ordered samples (i.e., between 1.3 and 4.2 %CO), and the midpoint (median) of 17 species is within this range. Only three species (Ocotea macropoda, Oreopanax reticulatus, and Passiflora lindeniana) had their median outside this range. Also, four species (Aegiphila terniflora, Eugenia spp., Myrcianthes karsteniana, and Psicotria spp.) showed IQRs similar to that for the whole forest, suggesting an intermediate distribution along the %CO gradient. Beilshmiedia sulcata and Hyeronima moritziana had a wide IQR, suggesting that these species perform relatively well along the %CO gradient. Although several species’ IQR lower-ends are below the 25th percentile of %CO, only the tree fern Cyathea spp. has its midpoint close to such limit. This could indicate that below 1.2% CO there are strong limitations for the survival and growth of tree species. On the other hand, above 4.4% CO juvenile tree species seem to face growth limitations.
Tab. 1 - Non-randomness Kolmogorov-Smirnov test of juvenile tree species distribution along the percentage of canopy openness gradient in the experimental area at SEUF, Mérida, Venezuela.
| Species | Family | Abbreviation | P-value |
|---|---|---|---|
| Hyeronima moritziana | Euphorbiaceae | Hm | <0.001 |
| Ocotea macropoda | Laureaceae | Om | <0.001 |
| Beilshmiedia sulcata | Laureaceae | Bs | <0.001 |
| Tetrorchidium rubrivenium | Euphorbiaceae | Tr | <0.001 |
| Retrophyllum rospigliosii | Podocarpaceae | Rr | <0.001 |
| Myrcia acuminata | Myrtaceae | Ma | <0.001 |
| Oreopanax capitatus | Araliaceae | Oc | <0.001 |
| Billia colombiana | Hippocastanaceae | Bc | <0.001 |
| Cyathea spp | Cyatheaceae | Csp | <0.001 |
| Oreopanax reticulatus | Araliaceae | Or | <0.001 |
| Passiflora lindeniana | Passifloraceae | Pl | <0.001 |
| Miconia meridensis | Melastomataceae | Mm | 0.001 |
| Casearia tachirensis | Flacourtiaceae | Ct | 0.003 |
| Prunus moritziana | Rosaceae | Pm | 0.004 |
| Eugenia sp. | Myrtaceae | Esp | 0.006 |
| Myrcia fallax | Myrtaceae | Mf | 0.051 |
| Roupala obovata | Proteaceae | Ro | 0.093 |
| Myrcianthes karsteniana | Myrtaceae | Mk | 0.205 |
| Psicotria spp. | Rubiaceae | Psp | 0.247 |
| Aegiphila terniflora | Verbenaceae | At | 0.295 |
Fig. 3 - Interquartile ranges of juvenile tree species’ distribution on the rank transformed gradient of percentage of canopy openness (280 plots, 1975 individuals). Letters identifying ranks are species abbreviations and their position correspond to the median (midpoint) of the abundance distribution of juvenile trees. For abbreviations, see Tab. 1.
Null model of community structure
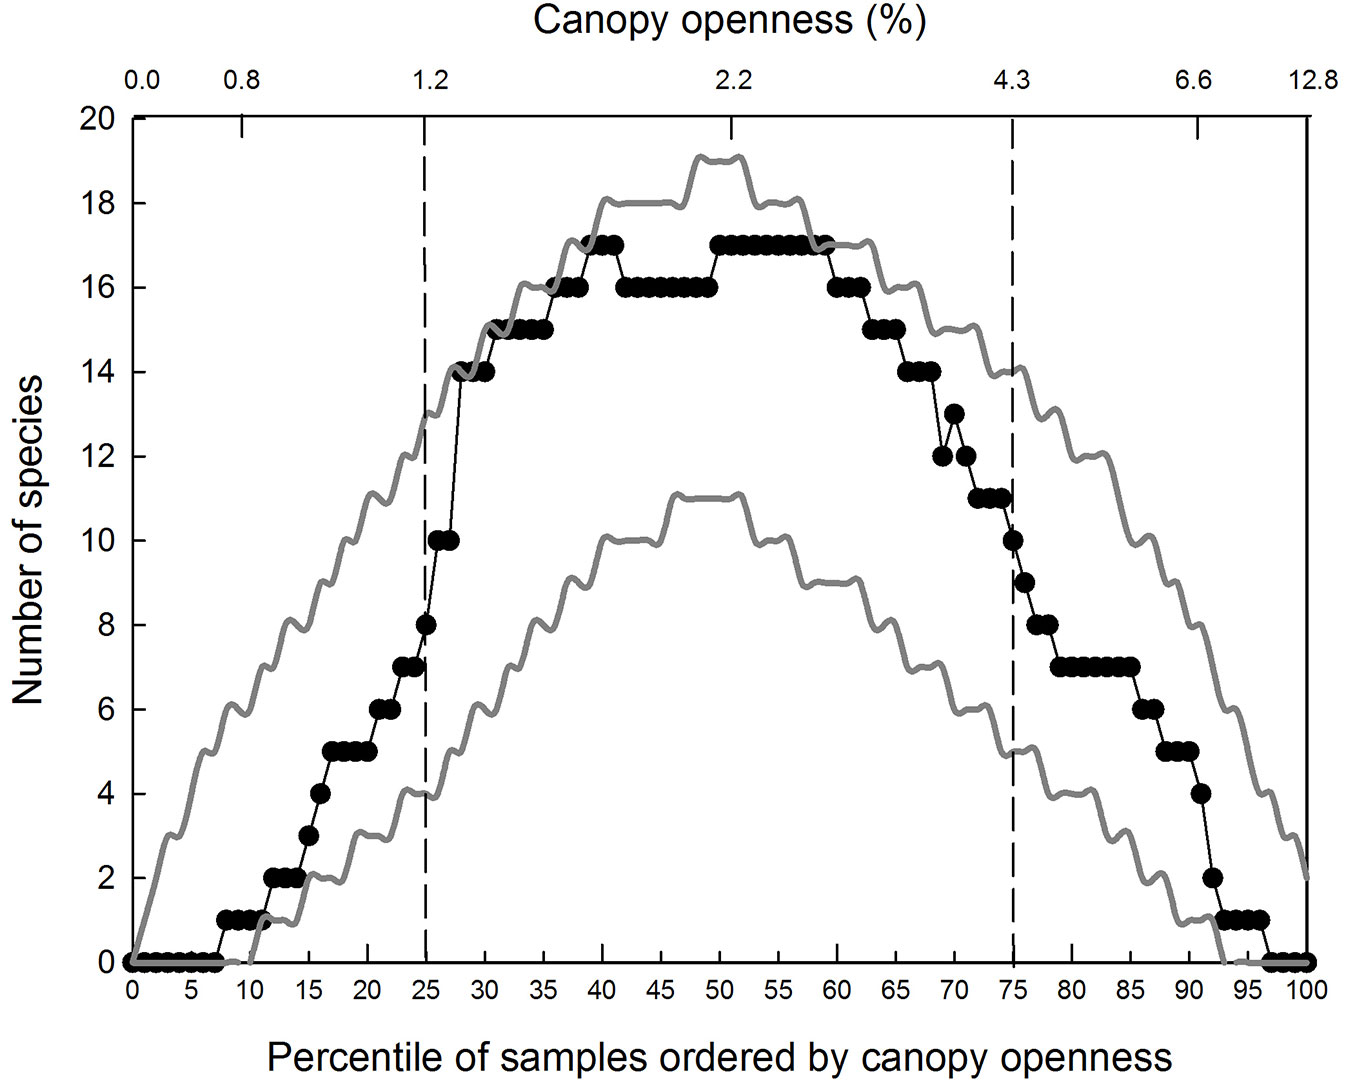
The average empirical distribution of pairwise overlap of species’ IQRs was well within the upper and lower 95% confidence limits generated by the bounded null model of community structure (Fig. 4). Species richness (represented by the overlap of IQRs) peaked at nearly 2.2 % canopy openness, close to the median %CO.
Fig. 4 - Empirical distribution of species richness along the canopy openness gradient. Empirical distribution of species richness along the canopy openness gradient (unbroken line) and 95% confidence limits for the average distribution predicted by the bounded null model (dotted lines).
Discussion
The range size for untransformed percentage of canopy openness from 0.5% to 12.8% is similar to the results found in other studies ([29], [18], [39], [30], [33]). Poorter & Arets ([39]) compared 15 studies carried out with different measurement techniques in tropical forests around the world reporting average values of %CO between 0.7 and 4.3% and maxima between 10 and 20%. In the majority of forests, either tropical or temperate, the frequency distribution of light environments is biased towards microsites with less than 5% canopy openness ([34], [30]). Ostertarg ([37]) estimated for Costa Rican lowland forest an average %CO of 7.3 in gaps and 3.9 under closed canopy. Studies for the cloud forest have shown lower than average values of %CO. For example, in an Andean cloud forest, Acevedo et al. ([2]) found a %CO ranging from 3.4% to 9.5%. In a cloud forest of Southeast Brazil, De Carvahlo & De Oliveira-Filho ([13]) found a range of %CO from 5 to 18% in 31 gaps 50-70 m2 in size. In the tropical cloud forest, low %CO is probably related to the complex vertical structure, which is composed of at least three dense layers, and abundant epiphytes intercepting a large part of the solar radiation.
In general, the pattern of abundance distribution of tree species was nonrandom in relation to the light environment, but with a high overlap within the interquartile range of %CO. Species abundance was strongly depressed towards both extremes of the IQR of %CO, whereas the highest number of species had IQRs overlapping around the median %CO. The empirical pattern of species’ IQR overlap did not depart from the confidence limits established for the average overlap expected under the assumptions of the null model of community structure. This supports the results found in other studies that the observed differences in niche expression along the %CO gradient do not necessarily imply species coexistence ([30]). Thus, the majority of species in this forest appears to be of intermediate shade tolerance. Figueroa & Lusk ([18]) found that the average light environment for 13 of 26 species occurred between 4 and 12% of %CO in a temperate Chilean forest. Wright et al. ([47]) evaluated 73 abundant species in Barro Colorado Island (Panamá) and examined the hypothesis that under closed canopies, morphology and physiology determine shade tolerance. They did not find a high number of species functionally equivalent in the extremes of the regeneration gradient, and rather a few species, either clearly shade tolerant or clearly light demanding. Most species had intermediate light requirements. The authors suggested that juveniles of light demanding tree species are relatively rare because they are ephemeral, die quickly in high shade, or they grow fast to larger sizes if light levels remain high. In contrast, shade tolerant species are relatively abundant in the juvenile phase because they are persistent, and survive and grow slowly under shade. Our results show that juveniles of tree species in this forest have low abundances in the upper boundary of the light environment in large canopy gaps. Additional evidence comes from physiological and morphological features measured during a shade house experimental study (Quevedo RA, unpublished data) showing that juveniles of several tree species growing under low shade have low growth rates, low photosynthetic rates, and high susceptibility to photoinhibition. These results are important for an understanding of limitations and the determination of strategies for preserving and restoring tree diversity in these ecosystems.
Although 15 of the 20 studied species showed a non-random distribution along the canopy openness gradient, suggesting some degree of light partitioning, the test based on the bounded null model indicated that the community fits within the confidence interval for the null model, meaning that species’ range overlap did not deviate significantly from a random pattern. Moreover, species on the lower half of the gradient tend to have wide distribution ranges along the %CO gradient, and most species have a wide distribution range and midpoint placed towards the center of the gradient (16 species between the 35th and 65th percentile, whereas only three species have ranges outside the IQR of %CO located near the upper boundary. These patterns suggest that in this forest, not only low canopy openness is the rule in spite of scattered tree fall gaps, but also, that light partitioning does not determine tree community structure at the tree juvenile stage, rather there is a strong niche overlap in relation to light availability. The three species with IQR close to the upper boundary of the light gradient cannot be considered truly pioneer species, as their abundances peak between 4 and 6.6 %CO. Possibly, given the complex vertical structure of these ecosystems, the diffuse radiation gradient would be more efficient in detecting light demanding species.
High redundancy in light requirements among juveniles of tree species may have a positive effect on species’ coexistence in cloud forests and, therefore, in the maintenance of a high species diversity. However, other factors such as recruitment limitation ([25]) and differential growth/carbon-gain among species at the juvenile stage along the %CO range shown in this study would contribute to understanding the causes of the high diversity of these ecosystems and ways to preserve them.
Acknowledgements
The authors wish to thank Dr. Ken Green from the Australian Institute of Alpine Studies and an anonymous reviewer for their helpful and insightful comments, which helped us to improve the manuscript. Also, to Professor Luis E. Gámez from the Botany Laboratory (ULA) for his help in botanical species identification and to the SEUF field guides Ancelmo Dugarte and Dani Dugarte for helping in field species identification and field work. This work was funded by the grant F0-703-10-01-A from CDCHTA of Universidad de Los Andes (ULA), Venezuela, and Scholarship 200601148 from Misión Ciencia-FONACIT, Venezuela. We acknowledge the support of the Institute for Forestry Development (INDEFOR-ULA) for field support at the San Eusebio University Forest.
References
Gscholar
Gscholar
Gscholar
Gscholar
Gscholar
Gscholar
Online | Gscholar
Gscholar
Gscholar
Gscholar
Gscholar
Gscholar
Gscholar
Gscholar
Gscholar
Authors’ Info
Authors’ Affiliation
Facultad de Ciencias Forestales y Ambientales, Escuela Técnica Superior Forestal (ETSUFOR), Universidad de Los Andes (ULA), Conjunto Forestal, Mérida (Venezuela)
Facultad de Ciencias Forestales y Ambientales, Centro de Estudios Forestales y Ambientales de Postgrado (CEFAP), Universidad de Los Andes, Conjunto Forestal, Mérida (Venezuela)
Carlos García-Núñez
Facultad de Ciencias, Instituto de Ciencias Ambientales y Ecológicas (ICAE), Universidad de Los Andes, Conjunto Forestal, Mérida (Venezuela)
Corresponding author
Paper Info
Citation
Quevedo-Rojas A, Jerez-Rico M, Schwarzkopf Kratzer T, García-Núñez C (2015). Distribution of juveniles of tree species along a canopy closure gradient in a tropical cloud forest of the Venezuelan Andes. iForest 9: 363-369. - doi: 10.3832/ifor1568-008
Academic Editor
Arthur Gessler
Paper history
Received: Jan 19, 2015
Accepted: Jul 31, 2015
First online: Dec 08, 2015
Publication Date: Jun 01, 2016
Publication Time: 4.33 months
Copyright Information
© SISEF - The Italian Society of Silviculture and Forest Ecology 2015
Open Access
This article is distributed under the terms of the Creative Commons Attribution-Non Commercial 4.0 International (https://creativecommons.org/licenses/by-nc/4.0/), which permits unrestricted use, distribution, and reproduction in any medium, provided you give appropriate credit to the original author(s) and the source, provide a link to the Creative Commons license, and indicate if changes were made.

Web Metrics
Breakdown by View Type
Article Usage
Total Article Views: 53029
(from publication date up to now)
Breakdown by View Type
HTML Page Views: 44428
Abstract Page Views: 3197
PDF Downloads: 4003
Citation/Reference Downloads: 15
XML Downloads: 1386
Web Metrics
Days since publication: 3885
Overall contacts: 53029
Avg. contacts per week: 95.55
Article Citations
Article citations are based on data periodically collected from the Clarivate Web of Science web site
(last update: Mar 2025)
Total number of cites (since 2016): 2
Average cites per year: 0.20
Publication Metrics
by Dimensions ©
Articles citing this article
List of the papers citing this article based on CrossRef Cited-by.
Related Contents
iForest Similar Articles
Review Papers
Digital hemispherical photography for estimating forest canopy properties: current controversies and opportunities
vol. 5, pp. 290-295 (online: 17 December 2012)
Research Articles
Spatial heterogeneity of light and tree sapling responses in the understory of disturbed montane forests
vol. 8, pp. 448-455 (online: 08 October 2014)
Research Articles
Relationships between overstory and understory structure and diversity in semi-natural mixed floodplain forests at Bosco Fontana (Italy)
vol. 9, pp. 919-926 (online: 21 August 2016)
Research Articles
Growth, morphology, and biomass allocation of recently planted seedlings of seven European tree species along a light gradient
vol. 13, pp. 261-269 (online: 03 July 2020)
Technical Advances
Thermal canopy photography in forestry - an alternative to optical cover photography
vol. 8, pp. 1-5 (online: 07 May 2014)
Research Articles
Growth and physiological acclimation to shade in young plants of Adesmia bijuga Phil., a critically endangered species in central Chile
vol. 14, pp. 307-312 (online: 01 July 2021)
Research Articles
Optimum light transmittance for seed germination and early seedling recruitment of Pinus koraiensis: implications for natural regeneration
vol. 8, pp. 853-859 (online: 22 May 2015)
Research Articles
Growth dynamics of the Norway spruce and silver fir understory in continuous cover forestry
vol. 13, pp. 56-64 (online: 05 February 2020)
Research Articles
Modelling natural regeneration of Oak in Saxony, Germany: identifying factors influencing the occurrence and density of regeneration
vol. 16, pp. 47-52 (online: 16 February 2023)
Research Articles
The estimation of canopy attributes from digital cover photography by two different image analysis methods
vol. 7, pp. 255-259 (online: 26 March 2014)
iForest Database Search
Search By Author
Search By Keyword
Google Scholar Search
Citing Articles
Search By Author
Search By Keywords
PubMed Search
Search By Author
Search By Keyword


