Methods to inventory and strip thin in dense stands of aspen root suckers
iForest - Biogeosciences and Forestry, Volume 8, Issue 5, Pages 590-595 (2015)
doi: https://doi.org/10.3832/ifor1461-008
Published: Apr 22, 2015 - Copyright © 2015 SISEF
Research Articles
Abstract
Aspen and their hybrids have demonstrated high biomass productivity and can produce abundant regeneration in the form of root suckers. This makes aspen particularly intriguing for bio-energy production, because replanting costs can be avoided and additional biomass can be obtained by thinning the regenerating stands. Mechanical strip thinning (removal of stems in parallel strips) has been proposed as a fast and efficient method for capturing biomass that would otherwise be lost to mortality in such stands. However, determining the appropriate width for the residual rows is challenging, due to the difficulty of conducting inventories with traditional sampling tools and the variability in gap sizes between root suckers in the residual rows. In this study, we describe the development and testing of a simple inventory tool that may be used to conduct either fixed-area or variable-radius sampling in these stands. Also described is the development and testing of an equation that uses such inventory data along with Poisson distribution theory to predict the size of the largest gap between root suckers within residual rows, which in turn can be used to inform strip thinning operations. Based on the promising results of our limited tests, we encourage further evaluation of these methods with regeneration from planted and natural aspen stands, as well as other root suckering species.
Keywords
Bio-energy, Coppice, Poisson Distribution, Populus, Thinning
Introduction
Aspen and their hybrids have proven capable of producing more than 10 Mg ha-1 yr-1 of dry biomass in short-rotation (8 to 10 year) plantations in the United States ([8], [24]) and Europe ([15]). In addition, these trees can produce abundant regeneration in the form of root suckers following the harvest of mature trees ([2], [20], [25]). While aspen can also regenerate from stumps, the large wounds are easily infected by pathogens and can result in significant mortality among stump sprouts within a few years after harvest of the mature trees, either directly from infection or indirectly from the sprouts breaking off of the rotting stumps ([4]). As a result, root suckers are often considered a more reliable source of aspen regeneration than stump sprouts ([5]). This ability to provide profuse and reliable root sucker regeneration, estimated to be up to 3.4 dry Mg ha-1 after one growing season ([11]), in turn offers the opportunity to avoid replanting costs and to capture additional biomass from thinning operations, making aspen particularly intriguing as a sustainable feedstock for bioenergy production.
Strip thinning (defined for the purposes of this study as the mechanical removal of aspen regeneration in parallel strips between which rows of residual stems are retained) has been proposed as a method for capturing biomass that would otherwise be lost to mortality ([22]), and may also improve the growth of residual stems ([7]). For aspen plantations, the removal strips are ideally centered over the stump rows of the original planting, so as to also capture the biomass of stump sprouts before they succumb to disease and/or breakage. Using machinery to strip thin is a fast and efficient approach for dense young stands ([3], [6]) and allows stocking to be controlled by manipulating the width of the residual rows. However, selecting an appropriate row width is challenging. While narrower rows of residual stems will result in higher strip thinning yields, they will also contain fewer and more-widely-spaced stems, which may result in understocking of the residual rows. Selecting a row width that avoids excessively large gaps between residual stems thus appears to be a sensible approach for balancing strip thinning yields against the risk of understocking in the residual rows.
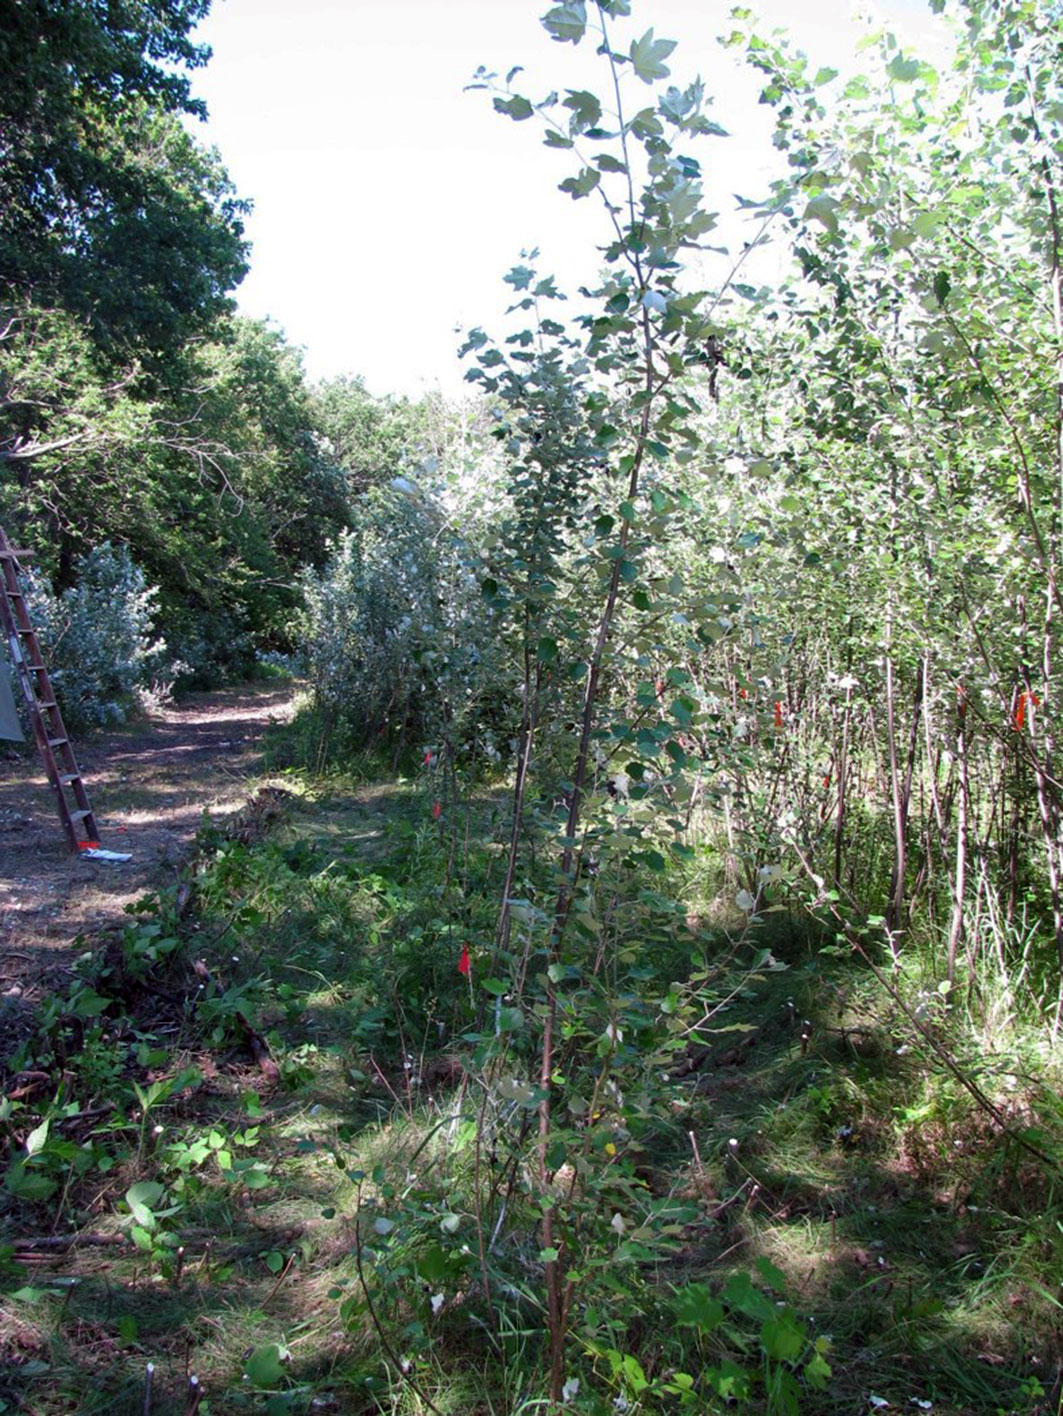
An equation which relates the maximum gap size within the residual row to the width of the row is therefore desirable. Such an equation should logically derive from stand density, as this is the inverse of stem spacing. However, the rapid growth and high density of these stands (Fig. 1) make traditional inventory tools for measuring regeneration density (e.g., fixed-area hoops) impractical. Thus, an inventory tool which is more conducive to working in such conditions would be beneficial. In addition to stand density information, predicting the gap sizes between individual root suckers also requires an understanding of the spatial distribution of the regeneration. Haight ([10]) describes a number of ecological studies conforming to the Poisson, or random, distribution and asserts that the “distribution of plants […] in space or time is frequently Poisson”. Based on this hypothesis, the distribution of aspen root suckers can be tested for conformity to a Poisson distribution using known statistical procedures and, if conformity is observed, the size of the gaps between root suckers can be predicted using Poisson theory.
Fig. 1 - Stand of 1-year-old hybrid aspen regeneration near Ames, IA (USA) in early spring of 2009. Root sucker density is approximately 200 000 stems ha-1, with individual stems measuring up to 3 m tall and up to 3 cm diameter at harvestable height (dhh; measured 10 cm aboveground).

In this technical report, we describe the development and testing of: (1) a simple inventory tool for conducting inventory measurements in dense stands of aspen root suckers; and (2) an equation to facilitate strip thinning of such stands by relating the size of the largest gap within a residual row to the width of the row, based on root sucker density (as determined by inventory) and Poisson distribution theory. Together, these methods provide a framework to inventory and strip thin dense young stands of root suckers, which we expect to be useful for sustainably managing regeneration of aspen as well as other root suckering species.
Materials and methods
Inventory tool: design and use
The inventory tool developed in this study was composed of relatively inexpensive and readily-available materials; the basic design is shown in Fig. 2. A threaded steel rod measuring 0.6 cm in diameter and 100 cm in length is the main component, with a hollow bamboo stick serving as the handle and secured at the top end of the rod using washers and lock nuts. A nylon measuring tape is affixed 10 cm from the bottom tip of the rod via a grommet, which is also kept in place with locks nuts. Note that just enough space should be allowed between the grommet and lock nuts for the tape to swivel freely around the rod. The placement of the tape at 10 cm aboveground corresponds to the stem height that is generally considered harvestable by machinery and thus facilitates measuring stem diameter at harvestable height (hereafter referred to as dhh), rather than diameter at breast height (dbh) which by definition would fail to include root suckers shorter than breast height (130 cm). The design is flexible, however, in that the placement of the tape may be adjusted by moving the lock nuts to whatever height is deemed most appropriate by the user. Similarly, the length of the tape is subject to adaptation based on the user’s needs.
Fig. 2 - Schematic of a simple inventory tool that can be used for either fixed-area or variable-radius sampling in densely regenerating stands of aspen root suckers. Photo inset (upper right) shows the tool as used in the field.
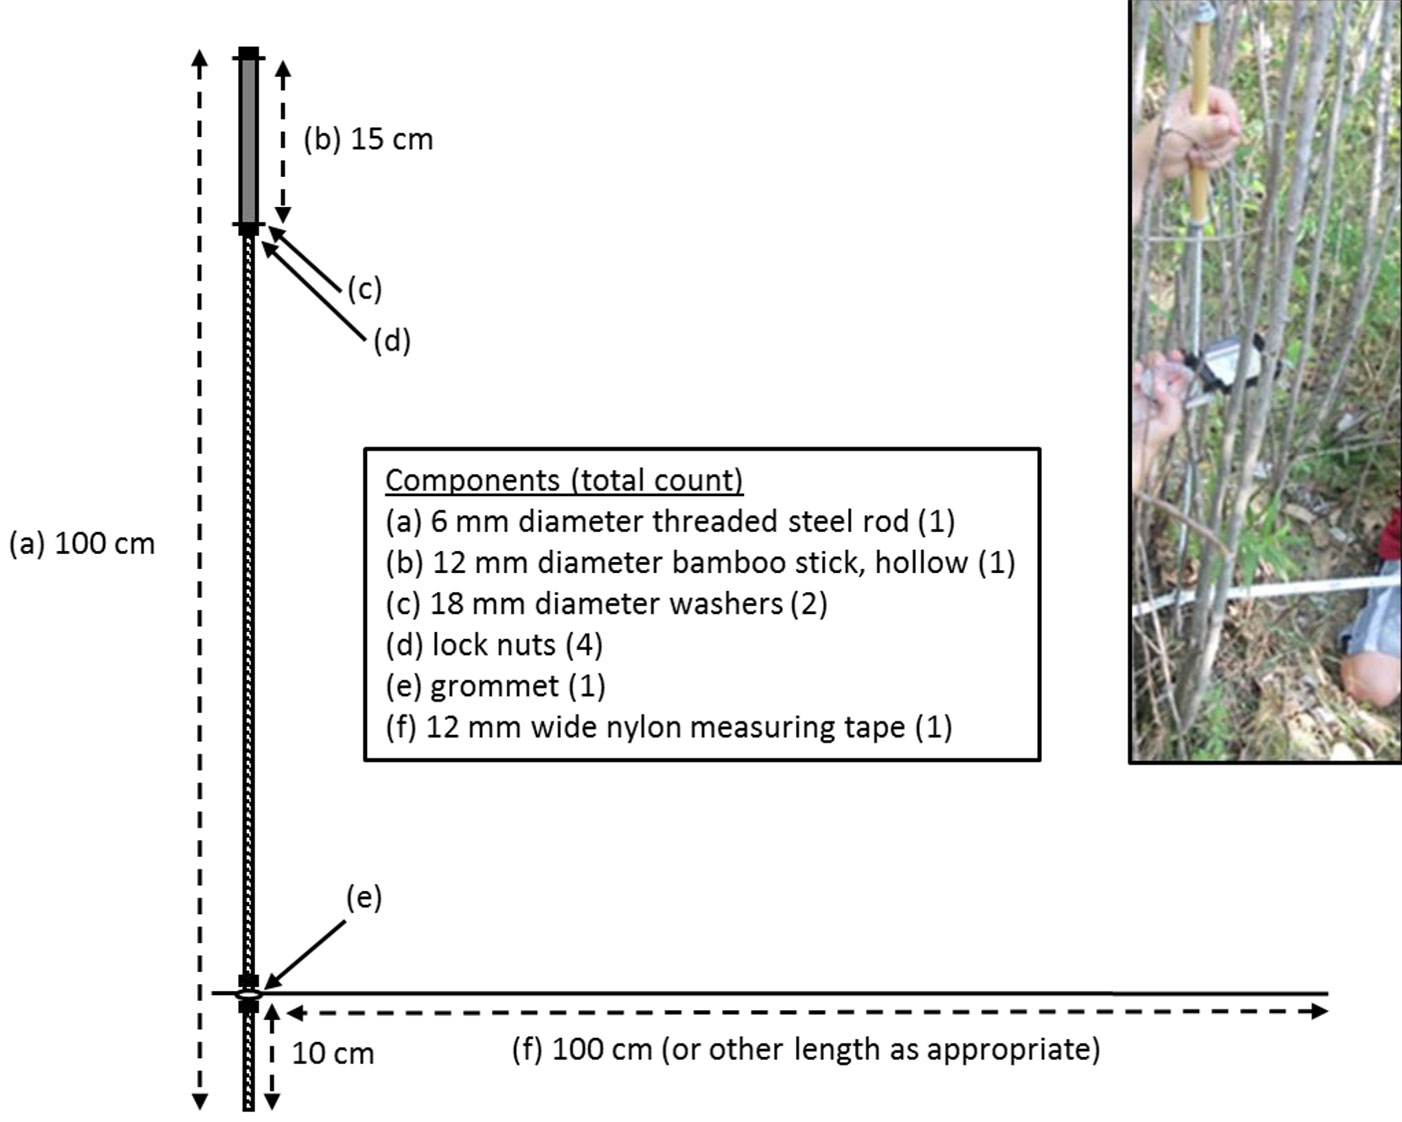
To use the inventory tool, the rod should be oriented vertically while the tip is placed at the sample point. To maintain the sample point during measurements (as well as for future measurements), a flag or PVC pipe may be placed in the soil; in the case of a pipe, the interior diameter should be just large enough for the tip of the tool to fit inside, and its height should be short enough that it does not interfere with the measuring tape. The nylon measuring tape (which due to its flexibility is easily moved between stems) can then be used to identify tally trees based on either fixed-area or variable-radius methods. With fixed-area sampling, trees are tallied if they lie within a prescribed radius of the sample point. Stand density (stems per unit area) for each sample point is then calculated by dividing the number of tally trees by the plot area. At our site, a fixed-area plot size of 1.7 × 10⁻⁵ ha (≈ 23 cm radius) was used to ensure the number of tally trees per sample point (3 to 4 on average - Ruigu & Hall, unpublished data) was both manageable and approximately on par with that typical of variable-radius sampling ([1]).
With variable-radius sampling, tally trees are selected based on the ratio of their distance from the sample point to their stem diameter. In mature stands, this method is widely employed using an angle gauge or prism that has an implicit distance:diameter ratio associated with its basal area factor (BAF). The stand density represented by each tally tree can then be estimated as the BAF divided by the basal area of the tally tree, and produces similar estimates of stocking in considerably less time than fixed-area sampling ([1]). Angle gauges and prisms are not practical in root sucker stands, however, as many of the stems are too short and the stands too dense for their use. Instead, tally trees may be identified by measuring the dhh of root suckers near the sample point (using hand-held digital calipers), multiplying dhh by the chosen distance:diameter ratio to determine how close the stem needs to be to the sample point to be tallied, and tallying the tree if it is indeed close enough (which sometimes requires use of the inventory tool’s measuring tape but often can be judged visually). While any distance:diameter ratio may be used, faster field measurements can be expected with whole-number ratios. Thus, we tested distance(cm):diameter(mm) ratios of 4:1 (BAF = 1.56 m2 ha-1), 3:1 (BAF = 2.78 m2 ha-1), and 2:1 (BAF = 6.22 m2 ha-1), and found that the 3:1 ratio resulted in a similar number of tally trees per sample point as the aforementioned fixed-area sampling.
The inventory tool was tested at a site near Ames, IA (USA), that contained hybrid aspen regeneration which sprouted following the harvest of a mature plantation in March of 2008. The original plantation consisted of a staggered-row design ([14]) spaced at 1.5 × 1.7 m and contained an array of promising hybrid aspen genotypes ([9]). Inventory measurements in the regenerating stand were conducted between early fall 2008 (just prior to dormancy) and early spring 2009 (just prior to bud break), when the regeneration was effectively 1 year old. A total of 27 sample points were randomly assigned to the study area, and inventory measurements were conducted at each sample point following the procedures described above. In addition, a subsample of tally trees was harvested to develop an equation for estimating stem biomass from dhh; for additional information on the biomass equation, as well as a description of random sampling techniques for root sucker stands, see Headlee ([12]).
Strip thinning equation: development and testing
Two main assumptions were made in developing the strip thinning equation. First, it was assumed that the spatial distribution of aspen root suckers can reasonably be described as random. Second, it was assumed that the width of the residual row of root suckers would be small relative to the length of the row. Under these two assumptions, the distances between root suckers in the residual row are analogous to the distances between randomly distributed points on a line, which can be described by Poisson probabilities. Specifically, Poisson probabilities describe the distribution of random events in linear time or space based on the following equation (eqn. 1 - [10]):
where Px(λ) is the probability of observing a given number of random events (x) having a known mean rate of occurrence (λ).
Based on Hida’s third theorem ([13]), the mean rate of occurrence λ is related to the size of the gaps between random events in a Poisson process, such that (eqn. 2):
where Gmax is the expected size of the largest observed gap, and n is the number of observed gaps.
To apply this equation for root suckers in the residual row, the following definitions and relationships are needed:
D: root sucker density (stems m-2; calculated by dividing stems ha-1 by 10 000 m2 ha-1);W: width of the residual row (m);L: length of the residual row (m);λ=D×W(stems m-1 of row length);n=D×W× L + 1 (number of gaps, including those between row ends and their nearest stems).
Thus, according to Poisson theory, the expected size of the largest observed gap may be estimated by re-arranging eqn. 2 and substituting the above terms for λ and n such that (eqn. 3):
It is instructive to consider here several points about this equation and its relationships. First, according to the equation above, the size of the largest observed gap in the row increases as the length of the row increases. While this may seem counter-intuitive, it is in fact logical if one recalls that the equation is derived from probabilities. Considering the entire population of gaps as a Poisson distribution curve, and the observed gaps in any given row as being a sample of this population, then it becomes clear that the probability of observing the largest gaps in the population (i.e., the extreme right-hand tail of the curve) will increase as the sample size (i.e., number of observed gaps) increases. Thus, if the length of the row is increased (and all other factors such as row width and stand density are held constant), then the number of observed gaps will increase and the probability of observing the largest gaps in the population will also increase. Second, it should be noted that the primary purpose of including the row ends in the calculation of the number of gaps is to simplify the measurements and calculations by making row length an easily-determined and consistent value (thus allowing Gmax to be estimated for multiple, equally long rows using a single calculation). Otherwise, measurements of the physical distance between the first and last stem in each row would be required along with separate calculations of Gmax for each of these distances, which would be particularly impractical as the length and/or number of rows becomes very large. In addition, if the user considers the growing space at the ends of the rows to be of similar interest and importance as that between stems, then including these gaps in the calculations is a logical step. Third, it should also be noted that the effect of the row width dimension on the distances between stems in the row will be negligible for small row widths, but will become more pronounced for larger row widths. In such cases, the planar distance between stems may be more informative than the linear distance along the row, and can be estimated using the simple geometric relationship described by the Pythagorean theorem for right triangles: a2 + b2 = c2, where a is linear Gmax in the dimension of L, b is distance between the stems in the dimension of W, and c is planar Gmax. For simplicity and brevity, however, we will consider only linear Gmax for the remainder of this paper.
To test eqn. 3 and its underlying assumption of random root sucker distribution, a stand of 2-year-old hybrid aspen regeneration (located in plots adjacent to where the inventory tool was tested) was strip thinned in 2010 (Fig. 3). Two rows (hereafter referred to as the east and west rows) of residual root suckers were created, each having lengths of 50 m and widths of 0.3 m. The dhh and distance of each root sucker from the start of the row was measured, from which a count of root suckers within each 2-meter interval was determined (2 rows × 25 counts per row = 50 counts). The count data were then analyzed using PROC GENMOD ([19]) in SAS (SAS Institute Inc., Cary, NC, USA) to test the assumption of a random (i.e., Poisson) distribution, and to test for differences in stocking between rows. In addition, the size of the gaps between individual root suckers in each row was calculated so that the size of the maximum gap could be compared with the values predicted by eqn. 3. For the purposes of testing across a wide range of maximum gap sizes, simulations were conducted such that a root sucker was randomly dropped from each row, the gaps were recalculated after each dropped root sucker, and the largest gaps were compared to the predicted values via linear regression using PROC REG ([16]) in SAS. For each of the two rows, the randomization and subsequent dropping of root suckers was replicated three times (2 rows × 3 simulations per row = 6 total simulations).
Fig. 3 - View looking down the west row of the strip thinning field test near Ames, IA (USA), during the summer of 2010. Stump sprouts and root suckers were cleared from the left and right sides, leaving the residual row of 2-year-old root suckers (0.3 m wide by 50 m long) shown in the center.
Results and discussion
Inventory tool
Based on our 27 sample points, stand density of the 1-year-old root suckers was estimated to be 185 000 stems ha-1 using fixed-area sampling (n = 85 total stems tallied) and 207 000 stems ha-1 using variable-radius sampling (n = 93 total stems tallied, BAF = 2.78 m2 ha-1). While the estimated stand density was higher for variable-radius sampling than for fixed-area sampling, the 95% confidence intervals for the two methods showed considerable overlap (fixed-area = 140 000 to 230 000 stems ha-1; variable-radius = 118 000 to 296 000 stems ha-1). The reduced precision (i.e., wider confidence interval) for variable-radius sampling compared to fixed-area sampling is expected at similar sampling frequencies, and in mature stands is often viewed as an acceptable trade-off to avoid the time-consuming process of establishing traditional fixed-area plots ([1]). In these dense stands of regeneration, however, the small size of the fixed-area plots may negate much of the time savings typically associated with variable-radius sampling. Results from using different BAFs were also evaluated (Tab. 1) and showed that a BAF of 1.56 m2 ha-1 produced a similar estimate of total stand density with a smaller confidence interval (likely related to the greater number of tally trees), whereas a BAF of 6.22 m2 ha-1 produced a considerably lower estimate of total stand density and larger confidence interval (likely related to the smaller number of tally trees). The under-estimation of stand density appeared to be linked to a failure to detect small stems, as the BAF of 6.22 m2 ha-1 estimated about half as many stems in the smallest dhh class (5mm) compared to the other two BAFs.
Tab. 1 - Comparison of mean stand density estimates (stems ha-1) obtained from variable-radius methods, using three different basal area factors (BAFs - m2 ha-1) resulting in different numbers of tally trees (n). Stand density estimates are shown by diameter class, totals across all diameter classes, and 95% confidence intervals (CI) for totals. Diameter classes listed are the midpoints of intervals of 5 mm (e.g., “5mm” = 2.5 to 7.5 mm). Results are based on 27 sample points.
| BAF (m2 ha-1) |
n (trees) |
Mean Stand Density (104 stems ha-1) by diameter class | |||||
|---|---|---|---|---|---|---|---|
| 5mm | 10mm | 15mm | ≥20mm | Total | 95% CI | ||
| 1.56 | 165 | 12.9 | 4.6 | 1.3 | 0.5 | 19.3 | 13.4 - 25.2 |
| 2.78 | 93 | 13.7 | 5.2 | 1.4 | 0.4 | 20.7 | 11.8 - 29.6 |
| 6.22 | 38 | 6.8 | 5.0 | 2.0 | 0.3 | 14.1 | 5.7 - 22.6 |
It should be noted that some of the variability in estimated stand density in the present study may be partially attributable to the relatively large genetic diversity represented at the site. The original plantation contained 32 different genotypes of hybrid aspen planted in a randomized design ([9]), and when the mature trees were harvested the genotypes had noticeable differences in vigor, which may have impacted their capacity for regeneration. Thus, smaller 95% confidence intervals might be expected for plantations (or natural clonal stands) having more uniform genetic material and/or stand vigor. Also, it should be noted that annual inventory measurements are recommended for dense young stands of aspen regeneration, as rapid growth and mortality may result in significant changes in stand density and stem size from one year to the next. Such measurements would also be useful for determining the self-thinning lines of various aspen species and their hybrids, which is of practical interest to both researchers and managers. For example, self-thinning lines serve as the upper boundary for stand density index ([21]), which can be a useful tool for evaluating stocking and planning thinning operations ([17]).
Strip thinning equation
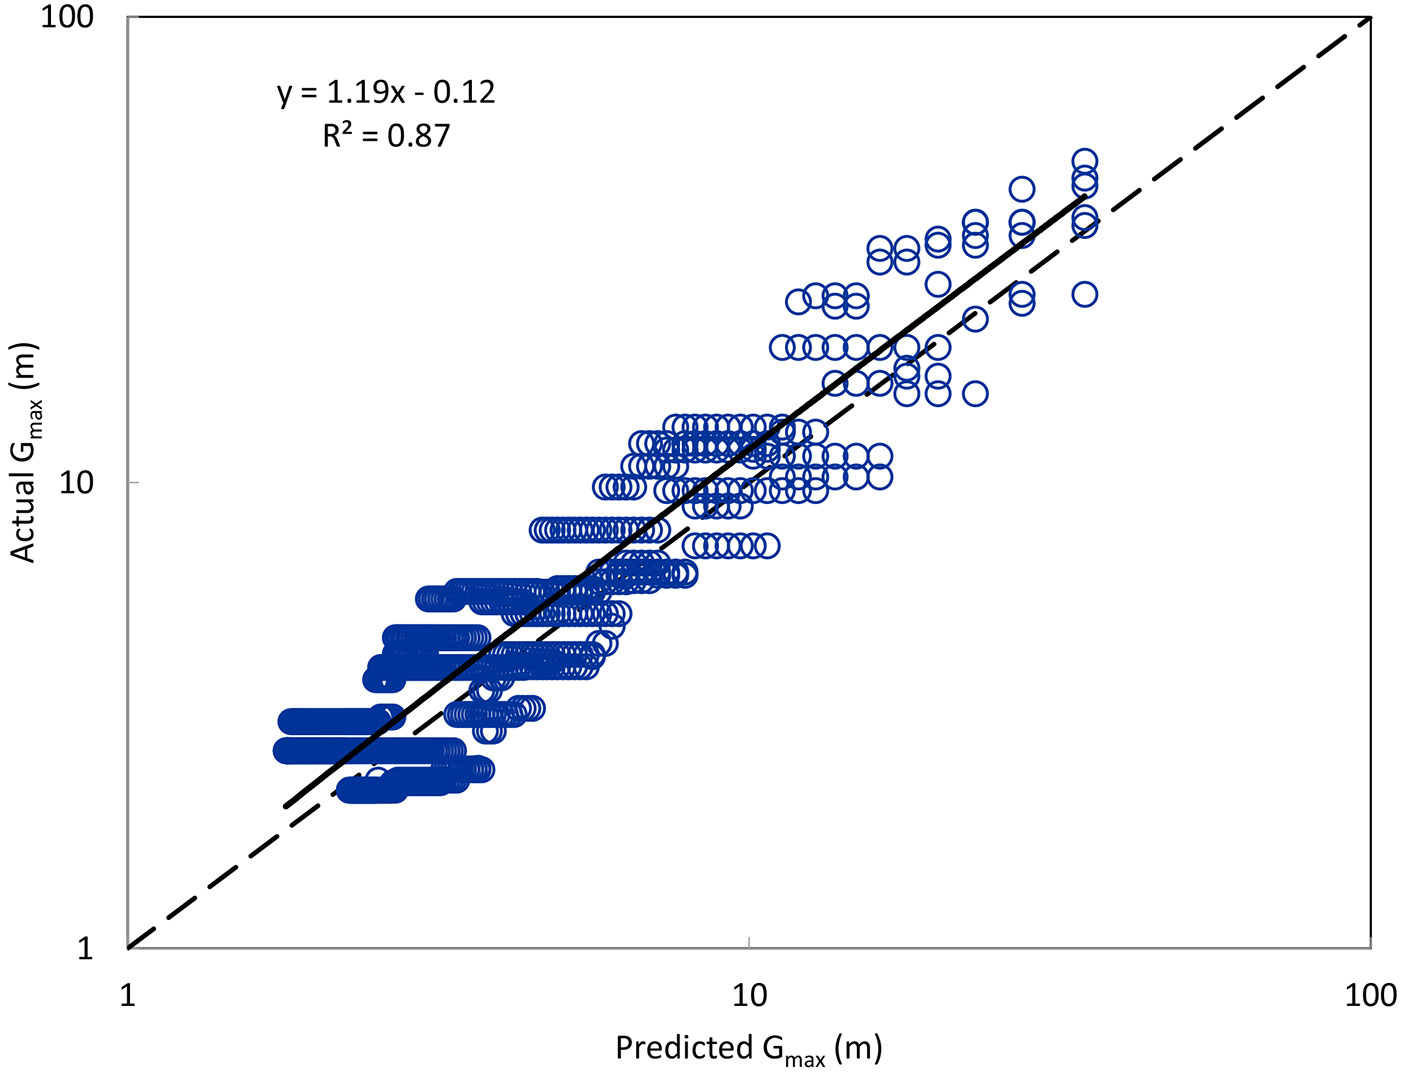
The test for conformity to the Poisson distribution showed that the distribution of the 2-year-old root suckers did not differ significantly from Poisson (p = 0.28, deviance = 53.28, df = 48), although a minor clumping effect (overdispersion) was indicated by the deviance:df ratio being >1. The stand densities were found to be significantly different (p = 0.02) between rows, with the east row having significantly higher mean density (9.1 stems m-2) than the west row (6.8 stems m-2). For the simulations based on randomly dropping sprouts from the rows, linear regression showed a strong relationship (r2 = 0.87) between actual maximum gap sizes and those predicted by eqn. 3, with the intercept of -0.12 not differing significantly from 0 (p = 0.32) but the slope of 1.19 differing significantly from 1 (p < 0.0001). Thus, regardless of stand density, the actual size of the largest gap tended to be about 19% larger than that estimated by the equation (Fig. 4). This is consistent with the minor clumping effect described above, which at any given density would be expected to produce larger-than-expected gaps at the high end of the gap distribution (i.e., the largest gaps in the row).
Fig. 4 - Actual versus predicted values of mean largest gap size (Gmax, m), based on simulations in which sprouts were randomly dropped from 2 rows with 3 simulations for each row, for a total of 6 simulations. Dashed line represents a perfect 1:1 relationship.
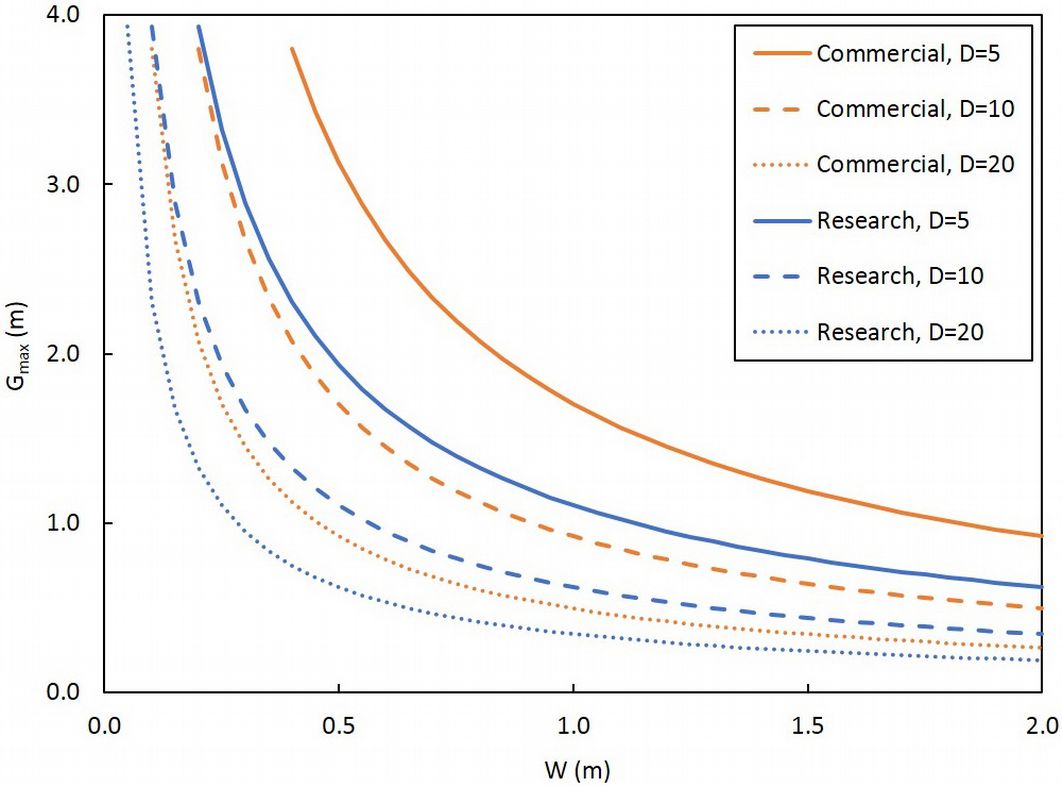
Our results suggest that the Poisson distribution can be reasonably applied to the spatial distribution of aspen root suckers. eqn. 3 represents a simple adaptation of Hida’s third theorem ([13]), and shows promising results when tested against a wide range of functional stand densities as simulated by randomly dropping stems from the rows. Thus, the equation appears useful for planning strip thinning operations. Specifically, the equation may be used to construct diagrams showing the expected mean size of the largest gap in the rows across a range of potential row widths (as influenced by operational constraints such as available equipment sizes), based on stand density (as determined by inventory) and the length of the rows (as influenced by the scale of the study); an example of such a diagram is shown in Fig. 5. We suggest row lengths of 50 m and 1 000 m as being useful approximations of research plot and commercial scales, respectively, although any combination of row width, row length, and stand density may be used. Similarly, the user has great flexibility in deciding upon an appropriate gap size, based on factors such as the desired rotation length. For example, if a similar rotation length as the original plantation is desired, then setting the largest gap equal to the within-row spacing of the original plantation would appear to be a logical goal.
Fig. 5 - Example of diagram for estimating the mean size of the largest gap in the rows (Gmax, m) associated with different row widths (W, m), at research scale (row length, L = 50 m - blue lines) and commercial scale (L = 1000 m - orange lines) at stand densities of 5 (solid lines), 10 (dashed lines), and 20 stems m-2 (dotted lines).
It should be noted that we did not include stump sprouts in our inventory measurements because our strip thinnings were centered over the stump rows which precluded them from contributing to the residual rows in terms of stem density or gap sizes, and also because the stump sprouts were not considered a viable long-term source of regeneration due to the disease/breakage issues previously described. However, if their inclusion in the inventory is desired (as may be the case with natural aspen stands where stump rows do not exist), it should be noted that the non-random (i.e., clumped) nature of stump sprouts will likely require that each stump (rather than each stump sprout) be treated as a single random event in order to accurately estimate gap sizes under Poisson theory. This assertion is based on research demonstrating that clumps of trees regenerated from seed tend to be Poisson distributed ([23], [18]), even though the individual trees are not.
Finally, it should also be noted that the spatial distribution of root suckers may not always be random or remain that way over time; thus, the importance of testing for conformity to the Poisson distribution prior to applying the strip thinning equation (and adjusting its use as needed) cannot be overstated. For example, root suckers arising from very poorly stocked stands may exhibit significant clumping effects, in which case eqn. 3 may be adapted to estimate the size of the largest gap between randomly-distributed clumps of root suckers. Conversely, dense stands of root suckers may become relatively uniformly spaced over time due to greater self-thinning among closely-spaced stems, in which case the size of the largest gap in the row should be expected to be approximately the inverse of λ (stems m-1 of row length).
Conclusions
The results of our limited tests of the inventory tool and strip thinning equation indicate that they are both potentially useful for managing dense young stands of aspen regeneration. Specifically, the inventory tool can be used to estimate stand density by either fixed-area or variable-radius sampling methods, and the strip thinning equation can be used to relate the size of the largest gap within the row to the width of the row at a given stand density (as determined by inventory) and row length (as dictated by study scale). However, our tests involved a relatively narrow range of conditions, and so we invite and encourage additional testing of these inventory and strip thinning methods with a wider variety of stand densities, ages, sites, and root suckering species.
Acknowledgements
The authors would like to thank the US Forest Service Northern Research Station Institute for Applied Ecosystem Studies, Iowa State University College of Agriculture and Life Sciences (CALS), and the CALS Agriculture Systems Initiative for their support in this project. They would also like to thank Phil Dixon, Ron Zalesny Jr., and Steve Jungst for their review and helpful comments on earlier drafts of the paper.
References
Gscholar
Gscholar
Gscholar
Gscholar
Gscholar
Online | Gscholar
Authors’ Info
Authors’ Affiliation
Richard B Hall
Department of Natural Resource Ecology and Management, Iowa State University, 339 Science Hall 2, Ames, 50011-3221 Iowa (USA)
Corresponding author
Paper Info
Citation
Headlee WL, Hall RB (2015). Methods to inventory and strip thin in dense stands of aspen root suckers. iForest 8: 590-595. - doi: 10.3832/ifor1461-008
Academic Editor
Luca Salvati
Paper history
Received: Oct 01, 2014
Accepted: Mar 24, 2015
First online: Apr 22, 2015
Publication Date: Oct 01, 2015
Publication Time: 0.97 months
Copyright Information
© SISEF - The Italian Society of Silviculture and Forest Ecology 2015
Open Access
This article is distributed under the terms of the Creative Commons Attribution-Non Commercial 4.0 International (https://creativecommons.org/licenses/by-nc/4.0/), which permits unrestricted use, distribution, and reproduction in any medium, provided you give appropriate credit to the original author(s) and the source, provide a link to the Creative Commons license, and indicate if changes were made.

Web Metrics
Breakdown by View Type
Article Usage
Total Article Views: 51518
(from publication date up to now)
Breakdown by View Type
HTML Page Views: 43079
Abstract Page Views: 3083
PDF Downloads: 3891
Citation/Reference Downloads: 16
XML Downloads: 1449
Web Metrics
Days since publication: 4118
Overall contacts: 51518
Avg. contacts per week: 87.57
Article Citations
Article citations are based on data periodically collected from the Clarivate Web of Science web site
(last update: Jul 2026)
(No citations were found up to date. Please come back later)
Publication Metrics
by Dimensions ©
Articles citing this article
List of the papers citing this article based on CrossRef Cited-by.
Related Contents
iForest Similar Articles
Research Articles
Modeling stand mortality using Poisson mixture models with mixed-effects
vol. 8, pp. 333-338 (online: 05 September 2014)
Research Articles
Predicted occurrence of ancient coppice woodlands in the Czech Republic
vol. 10, pp. 788-795 (online: 16 September 2017)
Research Articles
Energy production of poplar clones and their energy use efficiency
vol. 7, pp. 150-155 (online: 23 January 2014)
Research Articles
The conversion into high forest of Turkey oak coppice stands: methods, silviculture and perspectives
vol. 13, pp. 309-317 (online: 10 July 2020)
Research Articles
Modeling of time consumption for selective and situational precommercial thinning in mountain beech forest stands
vol. 14, pp. 137-143 (online: 16 March 2021)
Research Articles
First vs. second rotation of a poplar short rotation coppice: leaf area development, light interception and radiation use efficiency
vol. 8, pp. 565-573 (online: 27 April 2015)
Research Articles
A comparative study of four approaches to assess phenology of Populus in a short-rotation coppice culture
vol. 9, pp. 682-689 (online: 12 May 2016)
Research Articles
Interactions between thinning and bear damage complicate restoration in coast redwood forests
vol. 13, pp. 1-8 (online: 08 January 2020)
Research Articles
Distribution and concentration of cadmium in root tissue of Populus alba determined by scanning electron microscopy and energy-dispersive x-ray microanalysis
vol. 1, pp. 96-103 (online: 20 May 2008)
Review Papers
Integration of forest mapping and inventory to support forest management
vol. 3, pp. 59-64 (online: 17 May 2010)
iForest Database Search
Search By Author
Search By Keyword
Google Scholar Search
Citing Articles
Search By Author
Search By Keywords
PubMed Search
Search By Author
Search By Keyword


