Sensitivity of European beech trees to unfavorable environmental factors on the edge and outside of their distribution range in northeastern Europe
iForest - Biogeosciences and Forestry, Volume 9, Issue 2, Pages 259-269 (2015)
doi: https://doi.org/10.3832/ifor1398-008
Published: Oct 16, 2015 - Copyright © 2015 SISEF
Research Articles
Collection/Special Issue: IUFRO 7.01.00 - Ilhéus (Brazil, 2013) & Beijing (China, 2014)
Forest Response to Climate Change and Air Pollution
Guest Editors: Paoletti E, Kozovitz A, Feng Z, Bytnerowicz A
Abstract
European beech is a successful tree species outside its distribution range in northeastern Europe, where Prussian foresters introduced it mainly into Scots pine stands. This forest management practice resulted in new issues related to the sensitivity of European beech to current environmental changes in areas outside its natural range. We hypothesized that recent global environmental changes promoted the northeast migration of European beech outside its distribution range in Europe. To test this hypothesis, dendrochronological analysis of beech tree ring series was performed for eight sites located in Poland, Lithuania and Latvia. Frost in winter months and heat in June, along with drought in the vegetation period, limited beech tree growth outside its natural distribution range in northeast Europe. Higher air concentration of surface ozone and sulphur deposition level reinforced the negative effect of the detected key meteorological variables on beech growth, while higher air concentrations and deposition of nitrate had a positive effect. These factors explained about 50% of the total variation in increment indexes of beech trees at sites on the northeasren edge of their range. The observed trends of beech growth over the last 25 years has determined favorable conditions for planting this tree species outside its natural range in northeastern European forests.
Keywords
European Beech, Tree Increment Indexes, Meteorological Parameters, Ozone, Acidifying Compounds
Introduction
European beech (Fagus sylvatica L.) is one of the most widespread and important tree species in Europe due to its high physiological tolerance and competitiveness ([27], [44]). It is a climax species in most parts of Europe where it grows in very different environments. Beech is a monoecious, anemophilous and mostly allogamic species ([15]). Pure and mixed beech stands cover more than 12 million hectares, from southern Scandinavia to the Iberian, Italian and Balkan Peninsulas, and from southern England to Ukraine ([58]). In central Europe, beech is a component of lowland forests, while in the Mediterranean area it is a typical mountain species ([50]). Its proportion in central European forest is currently increasing, particularly where forests with a high percentage of conifers are being converted into more natural mixed forests ([56], [19]). Today, European beech is also a markedly successful species in the northeast of its distribution range and its distribution area may be larger than originally assumed ([10]). Prussian foresters promoted European beech in some areas of Latvia, Lithuania and northeast Poland in the nineteenth century by planting stands near or even outside the range edge ([23]). Past forest management is probably the main cause of the contraction in the postglacial European beech range ([10]). Due to its higher tolerance to abiotic and biotic threats accompanying climate change and an increased competitive ability compared to boreal tree species, these forest management practices ensure beech migration toward the northeast ([11]). There, European beech partially overlaps with the boreal coniferous species on loamy moraine soils in pure or mixed stands, usually with Scots pine ([10]).
European beech is also one of the most thoroughly investigated European tree species, due to its wide distribution range and domination as well as high ecological and economic importance ([21], [33]). Nonetheless, a limited number of studies have examined pre- or mature beech tree growth on the edge or outside their natural distribution range in relation to meteorological parameters and environmental pollutants in northeast Europe. The first data on beech growth outside its distribution range were presented by Latvian forest researchers ([23]). In Lithuania such investigations began in 2010 ([7], [48], [39]). However, with increased mean air temperature and precipitation amount, followed by the increase in vegetative growth period, new issues arose related to the sensitivity and resistance of beech on the edge and outside of its distribution concerning the impact of acidifying compounds and surface ozone ([35]). The importance of this problem increases due to the fact that beech trees growing in the understory of Scots pine increase the productivity of stands by 30-70 % even outside of their natural distribution range ([30]).
The present study aimed to determine the sensitivity of beech trees growing on the edge and outside of their distribution range to meteorological conditions and air pollutants, including surface ozone, by employing dendrochronological studies for different regions going from south to north and from west - the Baltic seaside - to east. The objectives were:
- to detect differences in beech tree growth on the edge of their distribution range and outside it in northeast Europe;
- to detect key meteorological parameters and environmental pollutants which could have resulted in the significant differences in beech tree growth at the study sites;
- to develop multiple regression models simulating beech tree growth in northeast Europe;
- to evaluate the sustainability of beech trees on the edge and outside of their distribution range.
Materials and methods
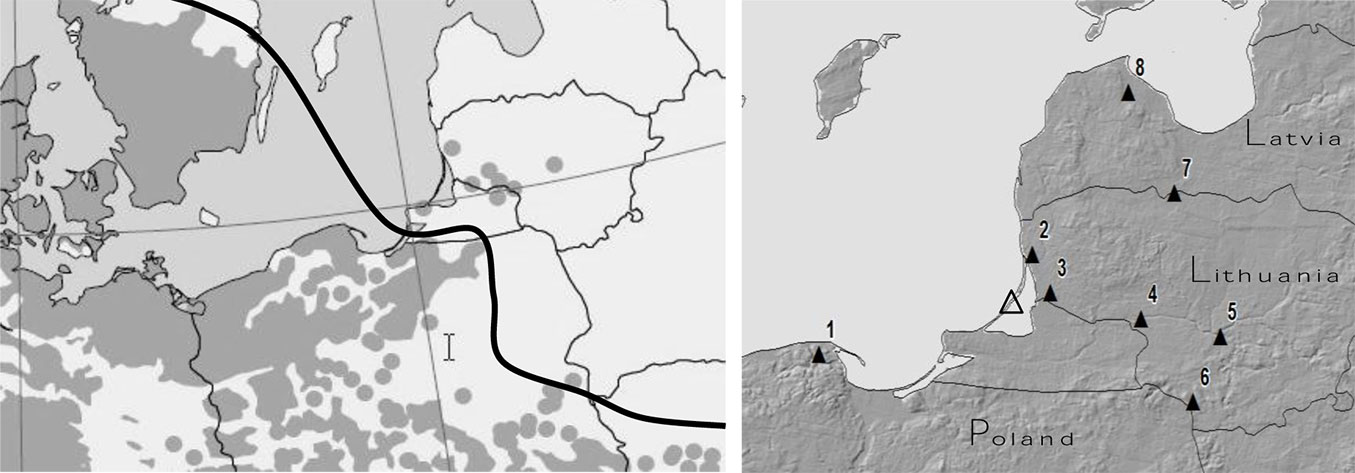
To determine sensitivity of beech trees to unfavorable environmental factors 8 beech tree sites were selected (Fig. 1). Their main characteristics are listed in Tab. 1. To investigate the sensitivity of beech on the south -north gradient three sites were selected: Kartuzy Site No 1 in Poland, Klaipeda Site No 2 in Lithuania, and Talsi Site No 8 in Latvia. Only Kartuzy Site in Poland represents natural beech growth in relation to meteorology and pollution load. To investigate the effect of continentality four Lithuanian sites were selected: Klaipeda site No 2 (seaside part of the country), Silute Site No 3 and Viesvile site No 4 (western part), and Girionys Site Kaunas district No 5 (middle part). The remaining two sites (No 6 and 7) represent extreme conditions to beech growth, because there information on beech growth was obtained from only individual beech trees, i.e., beech could not frame tree succession. All sites were established on flatland area. This characteristic allowed to ignore the effect of altitude on beech reaction to unfavorable environmental factors, which is well established ([43]).
Fig. 1 - (Left panel): beech tree distribution range in northeast Europe (continuous line); (right panel): location of experimental sites (black triangles) and the Preila EMEP station (empty triangle - [28]).
Tab. 1 - Topography and main characteristics of the monitored beech stands on the edge and outside of their distribution range. Altitudes of the sites were obtained from the elevation map of Europe ([26]).
| Site No | Location | Country | Coordinates WGS | Coordinates Lambert | Altit. | D1.3 | H, | Sample trees unit | ||
|---|---|---|---|---|---|---|---|---|---|---|
| Lat | Long | Lat | Long | m | cm | m | ||||
| 1 | Kartuzy | PL | 54.72 | 18.17 | 2799018 | 518617 | 30 | 29.6 | 30.8 | 45 |
| 2 | Klaipeda | LT | 55.73 | 21.22 | 2935122 | 693250 | 6 | 36.6 | 29.0 | 25 |
| 3 | Silute | LT | 55.35 | 21.47 | 2895754 | 715675 | 3 | 24.3 | 19.1 | 25 |
| 4 | Viesvile | LT | 55.08 | 22.77 | 2880539 | 801057 | 11 | 23.2 | 26.4 | 25 |
| 5 | Girionys | LT | 54.89 | 23.90 | 2873510 | 874874 | 20 | 24.3 | 22.4 | 20 |
| 6 | Lazdijai | LT | 54.23 | 23.51 | 2797810 | 864120 | 43 | 28.1 | 16.4 | 15 |
| 7 | Zagare | LT | 56.36 | 23.25 | 3024422 | 805011 | 25 | 67.7 | 24.0 | 15 |
| 8 | Talsi | LV | 57.39 | 22.59 | 3128521 | 745582 | 17 | 30.7 | 28.6 | 35 |
To detect sensitivity of beech trees to air concentration of acidifying compounds, their deposition and surface ozone data from the Preila EMEP station were obtained. The monitored stands were located no further than 300 km from this EMEP station, which was the source of the longest data set on concentrations of acidifying compounds in this part of Europe, as well as their wet deposition and surface ozone. Preila EMEP station is under operation since 1981 ([29], [55]). In this study, we used longer data sets from one station rather than shorter sets (data since 1994) from stations representing the considered regions. We assumed that the distance between the studied stands and the Preila EMEP station providing data on regional air pollution was not generally an important factor in detecting common effects of acidifying compounds and surface ozone on the growth of beech trees. It is known that short time data series may lead to misinterpretations of relationships between predict and response variables and, in the context of global change, may contribute to the significant uncertainties in this field ([36], [53]). Moreover, it was much more important to detect the significance of the temporal effect of regional pollution alone on beech growth over 1982-2010 period than to detect spatial effect over 1994-2010 period, because concentrations of air pollutants and deposition of acidifying compounds until 1994 were much higher and their effect on beech growth had to be more significant than that after 1994 ([8]).
On the other hand, topography of the considered sites, especially site’s longitude, was used in the analysis as a predict variable, which is related to some extent to the spatial variability of the considered pollutants. Main pollutant sources in this part of Europe are long-range transboundary air pollutants traveling with air masses from middle and western parts of Europe. Detailed data on variation in air concentration of acidifying compounds, acid deposition and surface ozone at the Preila EMEP station were presented in our earlier studies ([7], [8]).
More than 200 tree ring width series from eight European beech locations were chosen to meet the objectives of the study. Three beech stands were aggregated into one complex site in northeast Poland, Site No 1, in Latvia Site No 8 and also in Lithuania, Sites No 3 and 4 (Fig. 1). One stand represented data in the middle of Lithuania - Girionys Site No 5. The area of observation plots was 500 m2 each in Latvia and Poland, and 1000 m2 in Lithuania. Only in Lazdijai and Zagare (Lithuanian sites No 6 and 7), due to missing beech stands, individual beech trees were used for the analysis. The main stem and crown parameters (diameter at breast height, height, crown width, and crown length) of each beech tree were measured, and in addition wood samples were taken from randomly selected trees by a Pressler borer for tree-ring (annual radial increment) analysis. Main characteristics of the monitored beech stands are listed in Tab. 1.
Details on the preparation of tree stem borers and measurement technique was reported in earlier publications ([8], [34]). Tree-ring width was measured to the nearest 0.01 mm. The measurements were accomplished using a Lintab tree-ring measuring table and the TSAP software package (F. Rinn, Engineering Office and Distribution, Heidelberg, Germany). The obtained individual tree-ring width series were synchronized by visual comparison of ring width graphs ([24]) and statistically by calculating the coefficients of correlation ([9]). The mean tree-ring series for each stand were calculated on the basis of individual tree-ring series of 20-30 sampled beech trees. The standardization of these tree-ring series and the elimination of age trend ([32]) were performed by fitting a third-degree polynomial curve. Indexes of annual increment were calculated by computing the differences between the measured ring width and its approximated value. The values obtained (in mm) allowed to evaluate the significance of the increment amplitude to the sustainable growth of beech trees under the presses of unfavorable environmental factors.
Meteorological data were obtained from meteorological stations nearest to the monitored beech stands (about 10-15 km apart). Mean monthly values of air temperature and sum of precipitation of a month were chosen as the main factors which could result in beech tree growth peculiarities outside their distribution range ([16], [25], [17], [52], [45], [34]). To detect differences in the variability of air temperature and precipitation amount at the considered sites, two different periods were selected: (i) the growing season - from April through September; and (ii) the dormant period - from October through March. Simple Pearson’s correlation analysis was applied to detect significant relationships between meteorological variables and the increment indexes of beech trees, based on the following assumptions:
- existing causative relationship between predictor and response variables should be established by means of simple mathematical methods;
- no causative relation exists if relationships between predictor and response variables are not significant.
The problem remains only that significant relationships not always reflect causative relationship between the predictor and the response variables, because some coincidence in the nature always exists, or predictors frequently can be response variables due the impact of “real” predict variables which is unknown.
To solve this problem the linear multiple regression technique implemented in the statistical sofware STATISTICA® 7.0 was applied. Single monthly values on temperature or precipitation amount, along with mean air concentration of surface ozone during growing season, and annual air concentrations of acidifying compounds and their amount of deposition, were included in the models. During this procedure, the selected parameters were excluded from the regression model by a stepwise procedure based on their lowest level of significance ([22]). Finally, variables with a high level of significance (p < 0.05) were used to run the models. These parameters were evaluated as key factors limiting beech growth outside their distribution range. The goodness-of-fit of each model was assessed by determining the coefficient of determination (R2) and the level of statistical significance (p).
Comparison of the results obtained at the site on the edge of the beech natural distribution range (in Poland) with those obtained at sites outside the range (in Lithuania and Latvia), enabled to assess the sensitivity of beech trees to all possible unfavorable environmental factors, and to predict their resistance to: (a) frost during the dormant period; (b) drought and heat during the vegetative period; (c) acidifying compounds; and (d) surface ozone.
Results and discussion
Geographical distribution of the beech trees depends on their low resistance to summer drought at low altitude/latitude, and low temperatures (late frost and short length of the growing season) at high altitude/latitude ([43]). Therefore, the effect of summer drought and winter frost in conjunction with air concentration of acidifying compounds and surface ozone concentration was analyzed to investigate beech tree growth peculiarities on the edge of their distribution range.
Spatial and temporal changes in meteorological parameters
The long-term mean annual temperature at all sites fluctuated between +5.94 and +7.7 °C, with an increasing trend in the period 1950-2010 by approximately 0.026°C per year (Tab. 2). This increase was in full agreement with data presented by the SRES A1 B Project, and was most pronounced during the dormant period (October-March), with an increase of 0.03 °C per year (p = 0.034). During the growing season (April-September) mean monthly temperature showed a tendency towards increasing 0.022 °C per year (p = 0.068).
Tab. 2 - Main statistical parameters of single-factor ANOVA of mean temperature during dormant, growing season, and annual periods across the selected sites in latitudinal and longitudinal directions.
| Direction | Variable | Site no / Statistics |
Annual (n=58) |
Dormant (n=58) |
Vegetation (n=58) |
|---|---|---|---|---|---|
| Latitudinal | Mean temperature at site | No 1 | 7.70 | 2.54 | 12.86 |
| No 2 | 7.27 | 1.48 | 13.06 | ||
| No 8 | 5.94 | -0.31 | 12.20 | ||
| ANOVA: Single Factor statistics |
SS | 95.9 | 238.1 | 23.2 | |
| df | 2 | 2 | 2 | ||
| MS | 47.96 | 119.03 | 11.59 | ||
| F | 50.7 | 54.7 | 17.9 | ||
| F crit | 3049 | 3049 | 3049 | ||
| P-value | 5.2×10⁻¹⁸ | 4.5×10⁻¹⁹ | 9.0×10-08 | ||
| Longitudinal | Mean temperature at site | No 2 | 7.27 | 1.48 | 13.06 |
| No 3 | 6.97 | 0.65 | 13.29 | ||
| No 4 | 6.14 | -0.61 | 12.88 | ||
| No 5 | 6.32 | -0.26 | 13.55 | ||
| ANOVA: Single Factor statistics |
SS | 41.3 | 154.0 | 14.8 | |
| df | 3 | 3 | 3 | ||
| MS | 13.76 | 51.33 | 4.93 | ||
| F | 13.0 | 19.9 | 6.91 | ||
| F crit | 2644 | 2644 | 2644 | ||
| P-value | 6.6×10-08 | 1.5×10⁻¹¹ | 0.00018 |
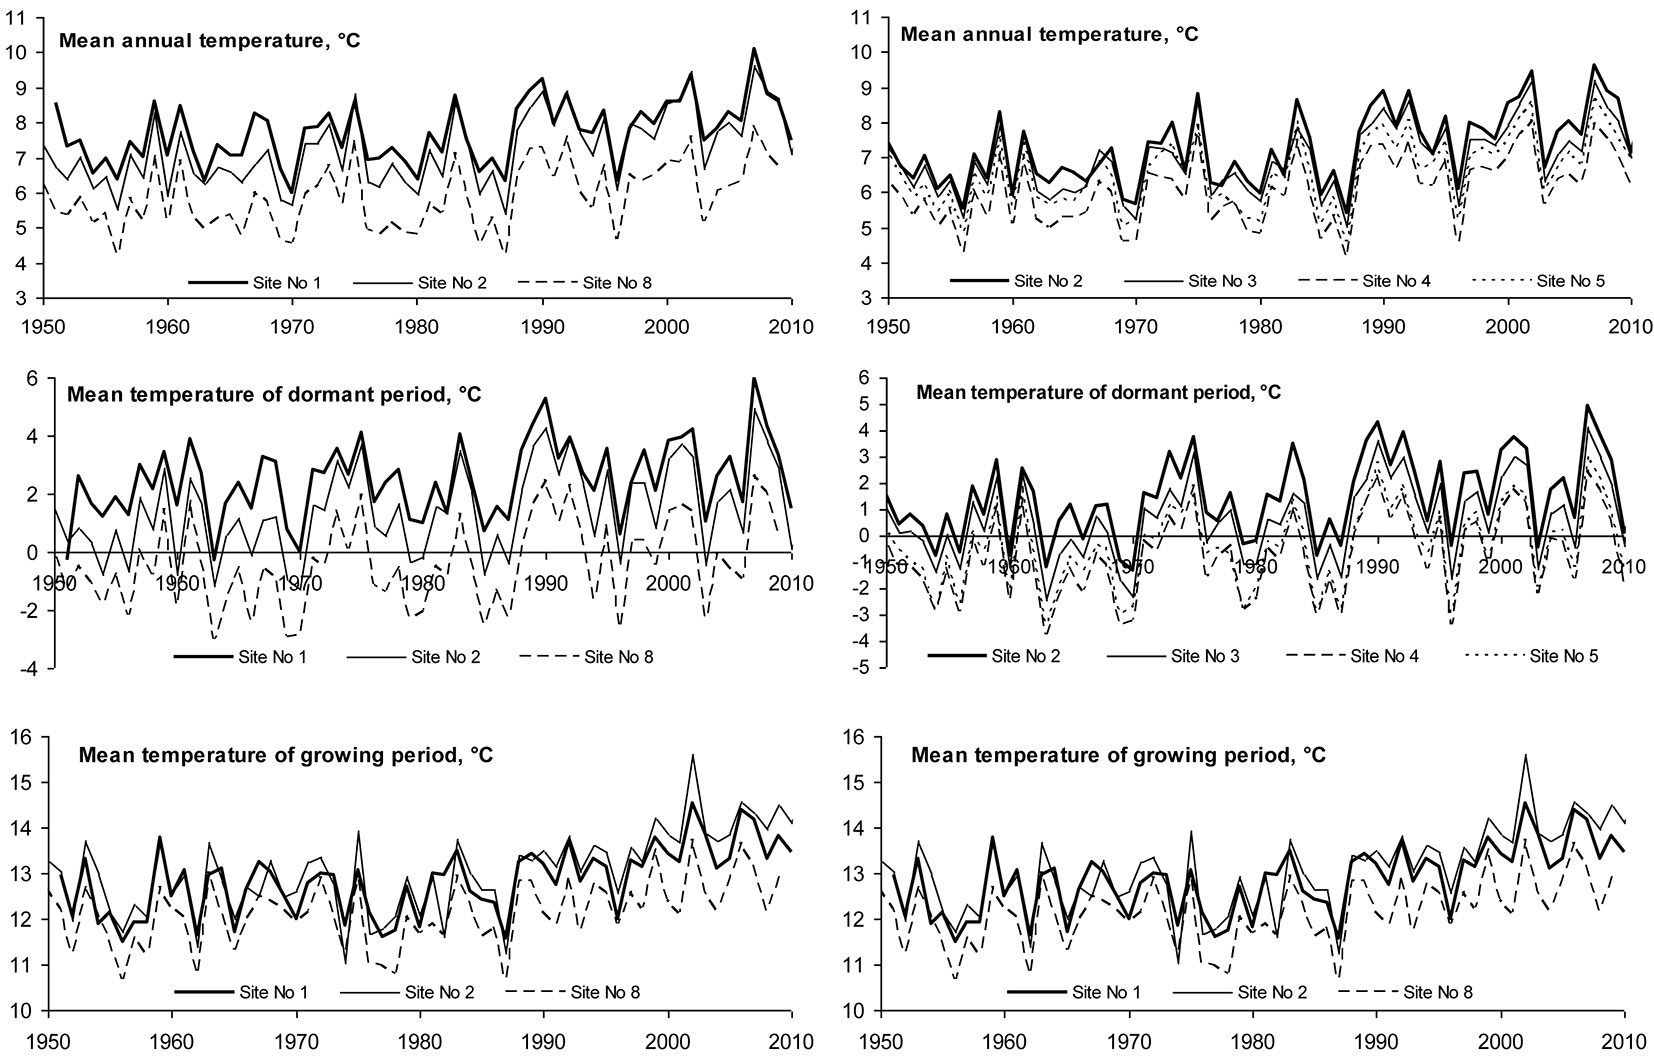
Spatial variation in mean temperature of the considered periods was determined (Fig. 2). Moving northbound along the Baltic seaside, mean annual temperature decreased significantly from 7.7 °C at Kurtuzy, Poland (Site No. 1) to 5.94 °C at Talsy, Latvia (Site No. 8); moving from Lithuanian west to east, temperature decreased from 7.27 °C at Klaipeda (Site No. 2) to 6.2 °C in central Lithuania (Sites No. 4 and 6 - Tab. 2). Spatial variation in mean air temperature during October-March (dormant period) and April-September (growing season) occurred following the same tendencies. Temperature decreased moving both north- and eastbound. All detected temporal variations were statistically significant (p < 0.05).
Fig. 2 - Latitudinal and longitudinal variation of the mean temperature during dormant, growing season and annual periods.
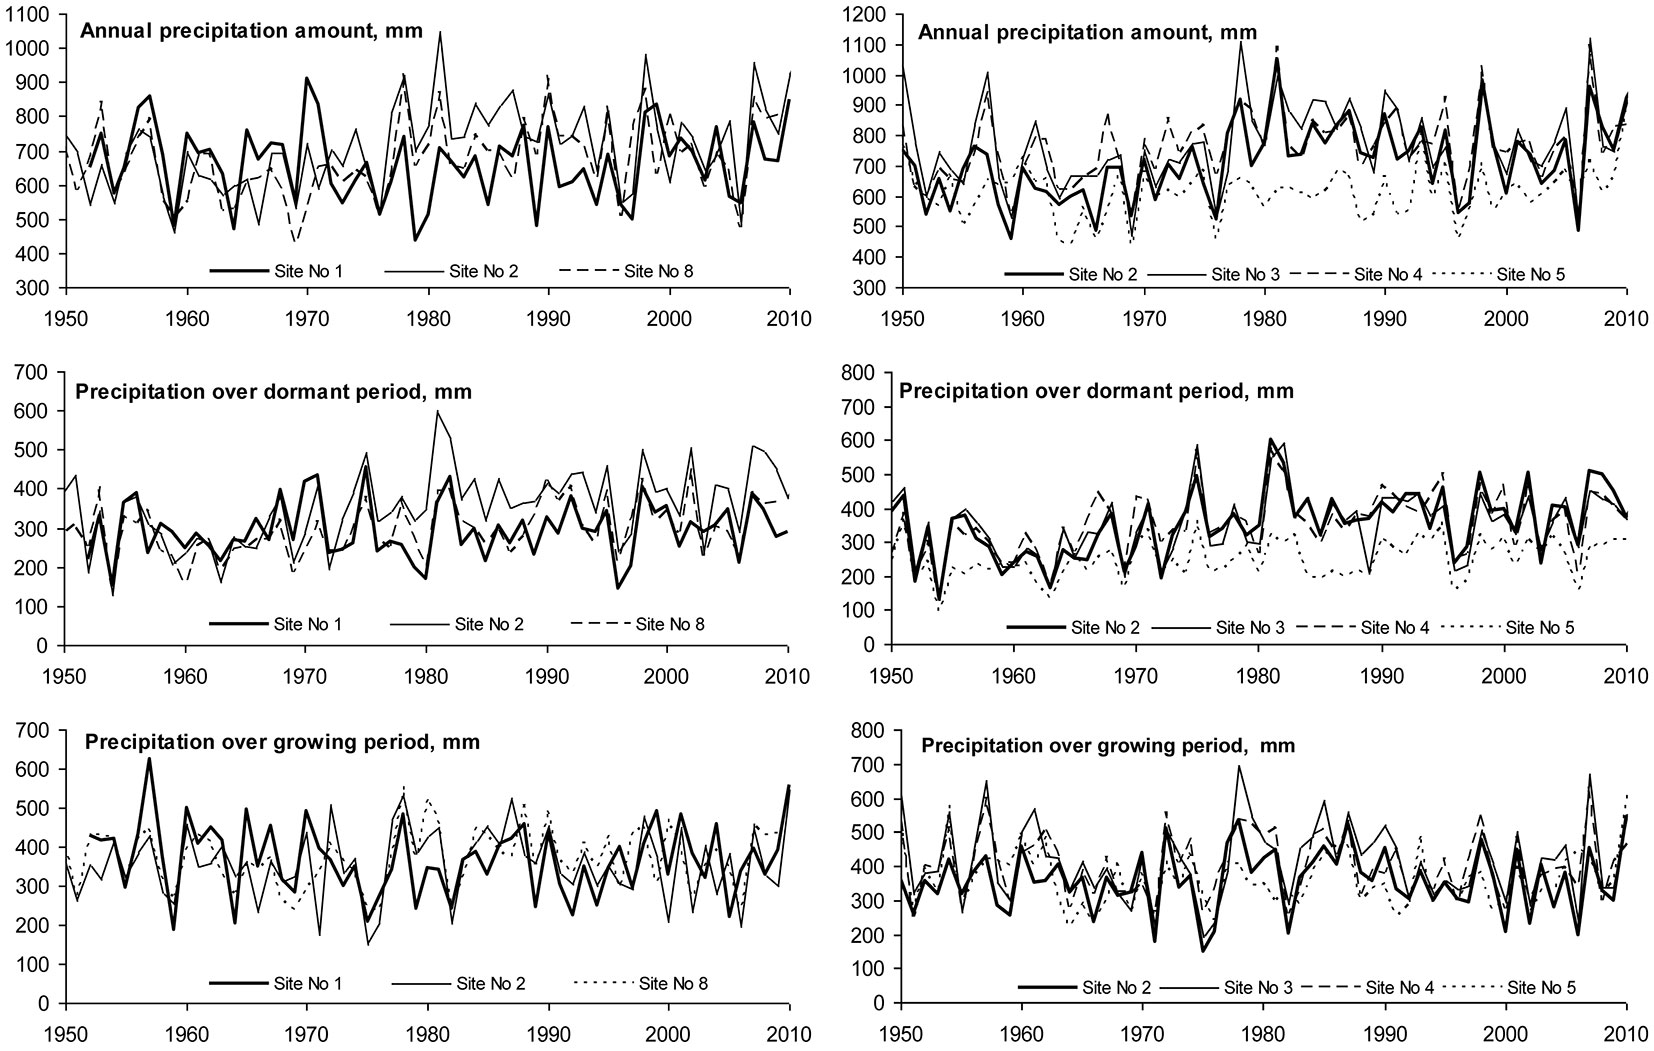
Annual amount of precipitation was in the range 620-770 mm, but significant differences were found moving from west to east. decreasing from 720-760 mm at the seaside site No 2 in Klaipeda to 620 mm at Girionys No5 site in the Kaunas district (Fig. 3). A statistically significant (p<0.05) decrease in precipitation during both the growing season (April-September) and dormant (October-March) period was also found moving in this direction (Tab. 3).
Fig. 3 - Latitudinal and longitudinal variability of precipitation during the dormant, growing seasons and annual periods.
Tab. 3 - Main statistical parameters of single-factor ANOVA of precipitation amount during the dormant, growing seasons and annual periods across the selected sites in latitudinal and longitudinal directions.
| Direction | Variable | Site no/ Statistics |
Annual (n=59) |
Dormant (n=59) |
Vegetation (n=59) |
|---|---|---|---|---|---|
| Latitudinal | Precipitation amount at site | No 1 | 663 | 294 | 369 |
| No 2 | 710 | 351 | 359 | ||
| No 8 | 680 | 301 | 379 | ||
| ANOVA: Single Factor statistics |
SS | 66517 | 114436 | 11866 | |
| df | 2 | 2 | 2 | ||
| MS | 33258 | 57217 | 5933 | ||
| F | 2407 | 8688 | 0.784 | ||
| F crit | 3049 | 3049 | 3049 | ||
| P-value | 0.0931 | 0.0003 | 0.4581 | ||
| Longitudinal | Precipitation amount at site | No 2 | 710 | 351 | 359 |
| No 3 | 762 | 348 | 413 | ||
| No 4 | 771 | 361 | 410 | ||
| No 5 | 618 | 252 | 365 | ||
| ANOVA: Single Factor statistics |
SS | 867794 | 454681 | 147152 | |
| df | 3 | 3 | 3 | ||
| MS | 289265 | 151560 | 49051 | ||
| F | 19.89 | 19.71 | 5405 | ||
| F crit | 2644 | 2644 | 2644 | ||
| P-value | 1.6×10⁻¹¹ | 2.0×10⁻¹¹ | 0.0013 |
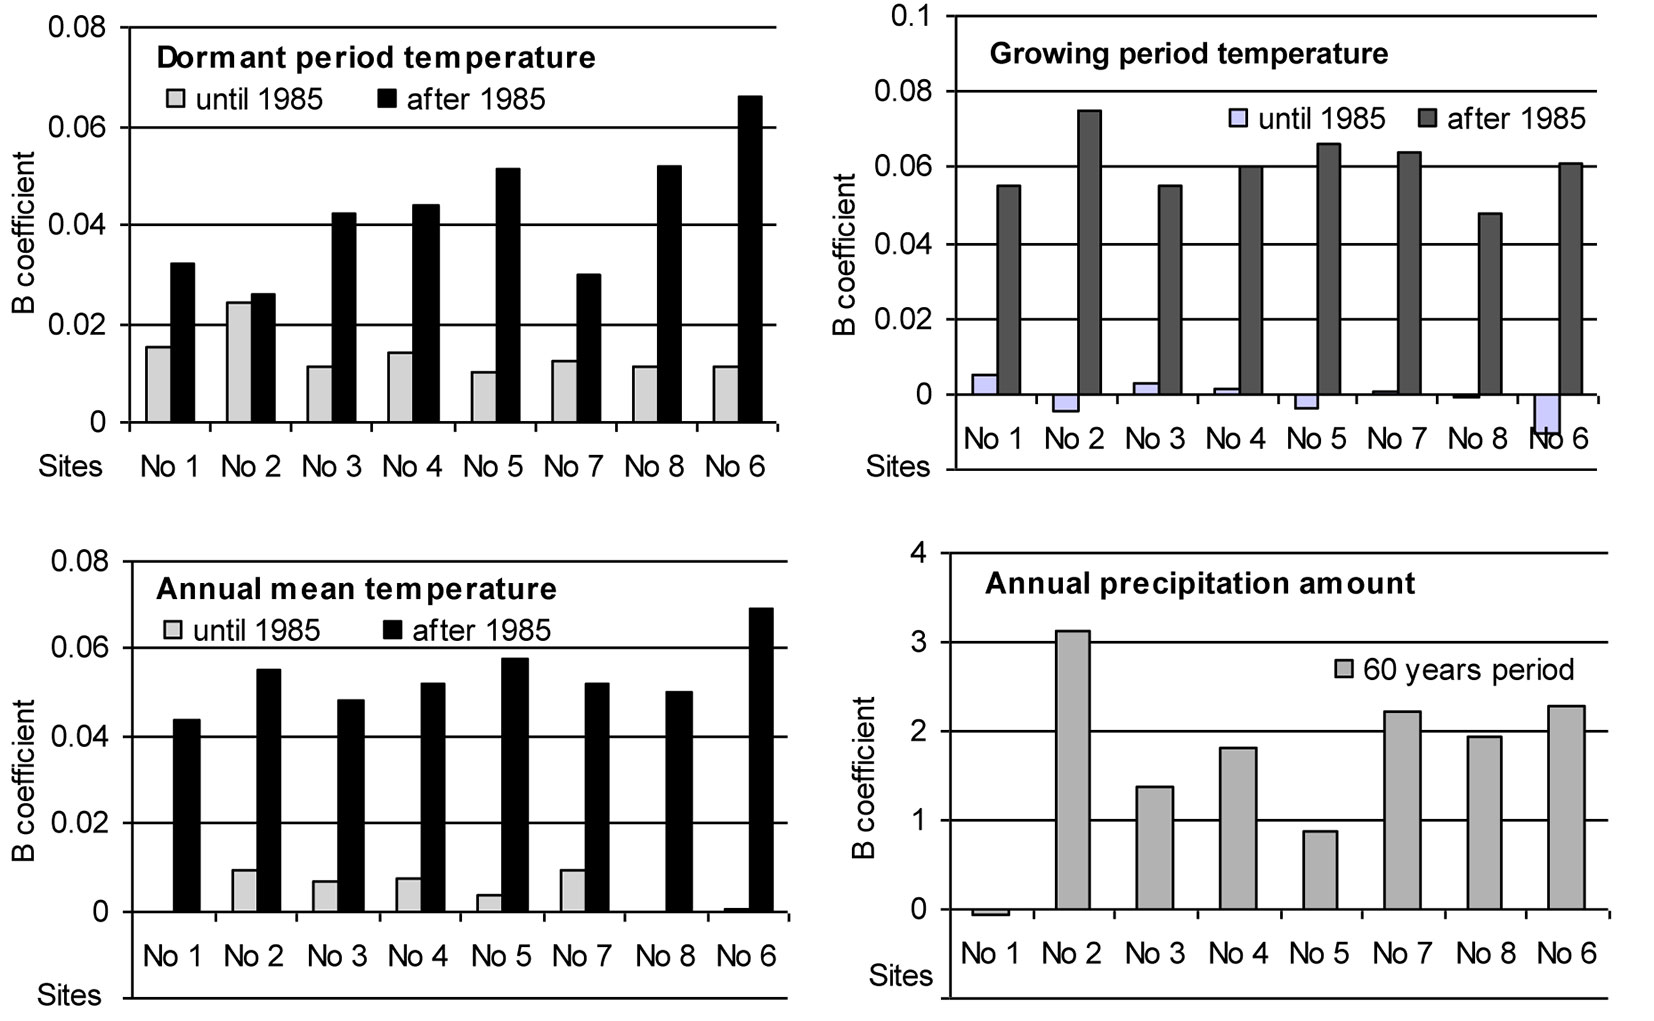
The intensity of trends in temporal variation of the considered meteorological parameters differed significantly during the entire period of investigation at the sites (Fig. 4). Until 1985 the annual mean temperature was rather stable and only during the dormant period there was a trend of increase by approximately 0.01 °C per year. After 1985 the situation changed substantially: mean temperature during the growing season started increasing by approximately 0.06 °C per year, and during the dormant period increased from 0.025 °C per year at Site No. 2 up to 0.065 °C per year at Site No. 6. Such changes in mean temperature resulted in an increase in the annual mean temperature by approximately 0.05 °C per year and could have had a significant impact on beech migration to the east.
Fig. 4 - Trends of the intensity of variation (B coefficient of the linear regression) and its slopes (positive: increase; negative; decrease) for the considered meteorological parameters over the periods 1955-1985 and 1985-2010.
Lack of moisture occurred in 1976, 1977, 1997 and 2006, when the annual amount of precipitation was ≤ 600 mm, representing only about 30-40% of the optimum value for beech whose growth requires 1500 mm according to Teissier du Cros et al. ([58]) (Fig. 3). The years with excessive humidity were 1978-1991, 1998, 2005 and 2007, when annual precipitation was > 1000 mm, representing approximately 60% of the optimum for beech growth.
The analysis of annual precipitation revealed an increase of about 1-2 mm per year during the whole period considered, with the exception of Site No. 1, where precipitation remained stable. Trends of variation in precipitation during the dormant as well as growing seasons did not differ significantly. Increase in precipitation showed no significant spatial variation, therefore its effect could have had only local character.
Beech tree growth
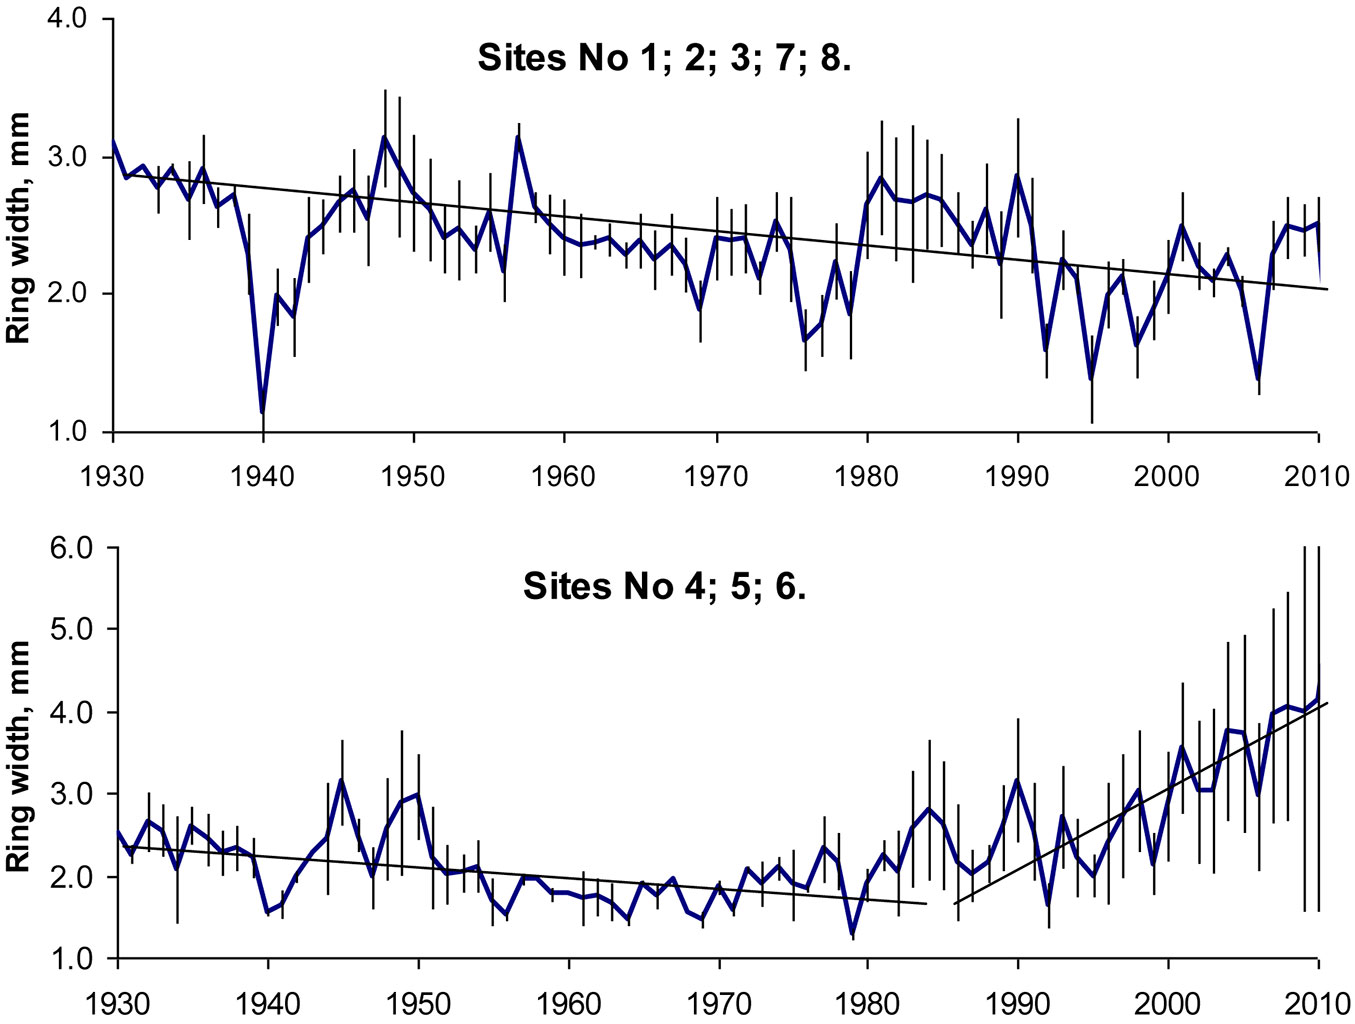
At lower altitude sites in central Europe, there were clear increasing growth trends, whereas at higher altitudes almost all sites showed slightly decreased growth potential, especially in recent decades ([21]). On the edge of the natural distribution range, beech tree ring width series revealed different tree growth scenarios, in particular since 1992-1994. Up to these years beech growth slightly decreased at all sites, according to well-known ageing regularities, by approximately 0.02 mm per year (Fig. 5). These findings agreed well with the findings from southern Europe, where decreased beech growth was detected as a result of increasing temperatures during the growing season and insufficient increase in precipitation to counterbalance the negative effects of increased temperatures on tree growth ([35]). At sites close to the Baltic sea this regular pattern continued after 1992-1994 as well (Fig. 5a), while beech tree growth at more eastern sites revealed a trend towards increasing (Fig. 5b), increasing at the same time the amplitude of variation. This growth trend is not consistent with recently detected trends in Central and South Europe ([54], [1]) and could be attributed to the effect of climate change.
Fig. 5 - Annual increment of beech trees and standard errors of their ring widths on the edge and outside of their distribution range.
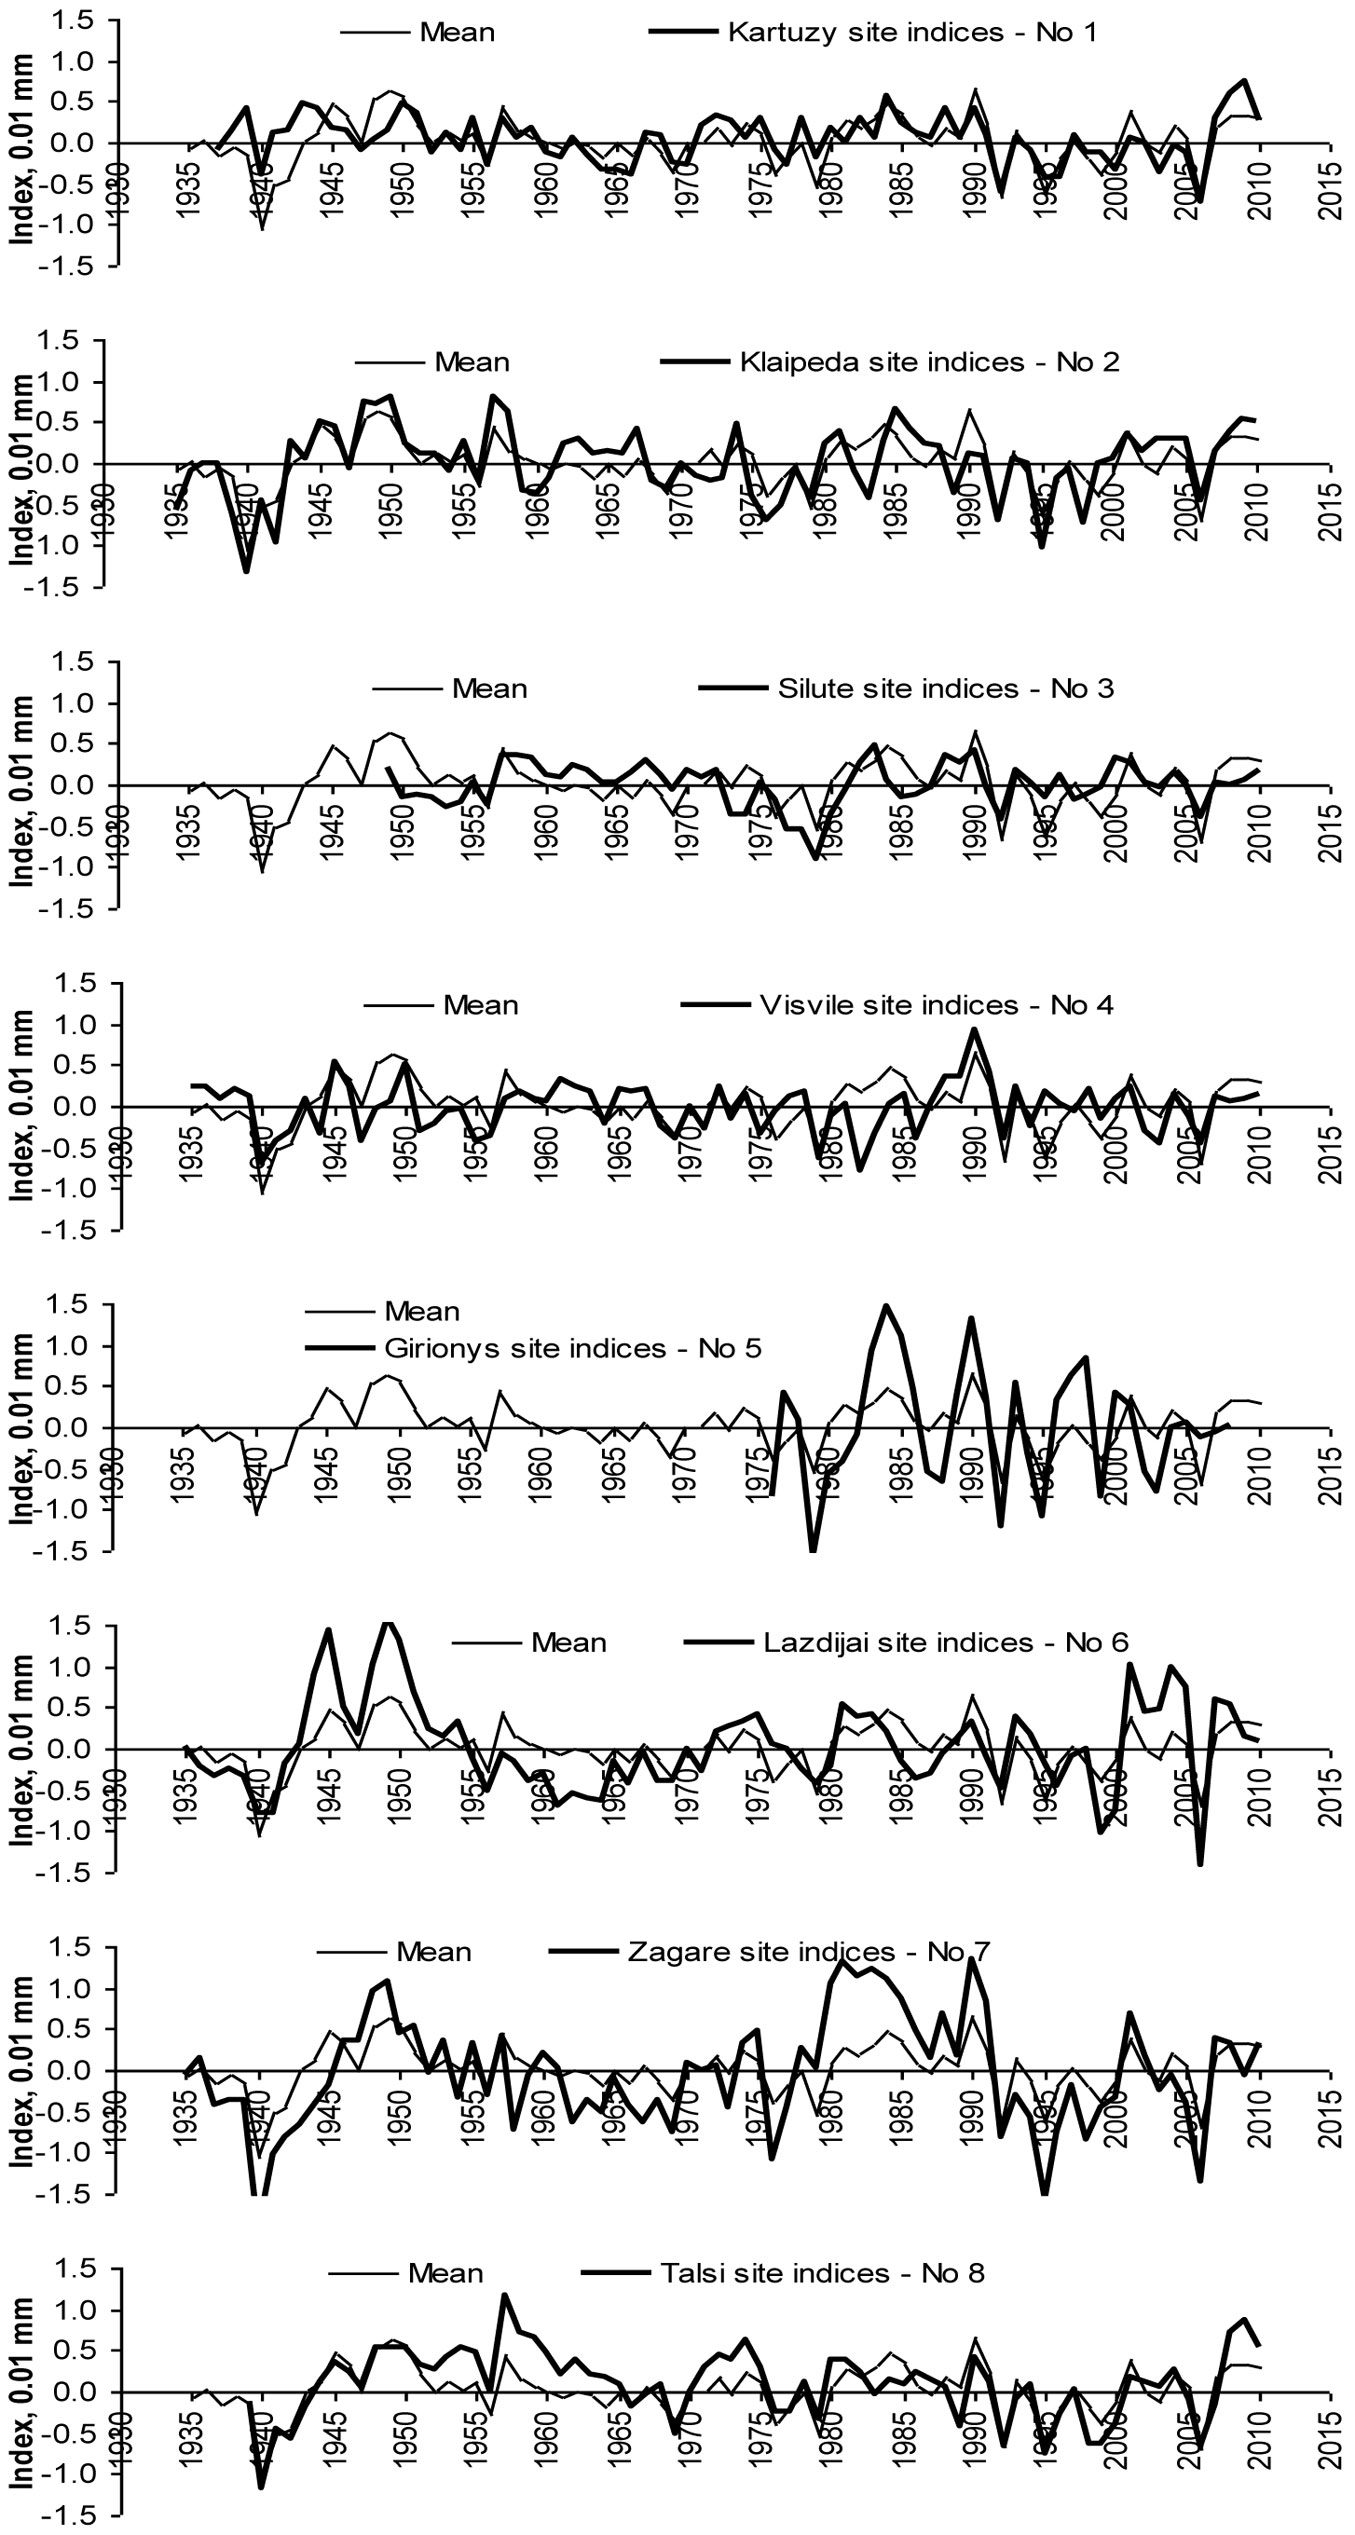
In general the most favorable years for beech tree growth were found to be the middle and the end of 1940s, also 1957, the period between 1981 and 1990 and the decade following 2001. Significant decrease in increment was detected in 1940, 1956 and 1979, due to frost in winter, and in 1992, 1994 and 2006, mainly due to drought during the growing season (Fig. 3). Furthermore, it should be noticed that the heat during the growing season 2007 had no negative effect on beech stem increment, while heat in 2003 which damaged the forests in western and southern Europe ([61]) was not pronounced in the study region ([62]).
Correlation analysis between calculated tree ring indexes indicated the same beech tree growth peculiarities at sites close to the Baltic Sea (Site No 1, 2, 8). Correlation coefficients between these data series were statistically significant (p<0.05). With increasing distance from the sea eastbound, the difference in beech tree growth increased (Fig. 6) and the significance of relationships between tree ring indexes series of the considered sites decreased (Tab. 4).
Tab. 4 - Inter-correlation between tree ring indexes of beech trees from different locations. Statistically significant interaction in bold (p<0.05).
| Site number |
No_8 | No_2 | No_1 | No_7 | No_3 | No_4 | No_6 | No_5 |
|---|---|---|---|---|---|---|---|---|
| No_8 | - | 0.645 | 0.652 | 0.498 | 0.267 | 0.182 | 0.386 | 0.270 |
| No_2 | - | - | 0.478 | 0.469 | 0.284 | 0.249 | 0.386 | 0.276 |
| No_1 | - | - | - | 0.626 | 0.240 | 0.256 | 0.479 | 0.428 |
| No_7 | - | - | - | - | 0.219 | 0.127 | 0.486 | 0.394 |
| No_3 | - | - | - | - | - | 0.347 | 0.151 | 0.430 |
| No_4 | - | - | - | - | - | - | 0.175 | 0.464 |
| No_6 | - | - | - | - | - | - | - | 0.205 |
| Mean | 0.763 | 0.738 | 0.786 | 0.801 | 0.447 | 0.412 | 0.707 | 0.470 |
Correlation analysis between meteorological variables and beech tree increment lines
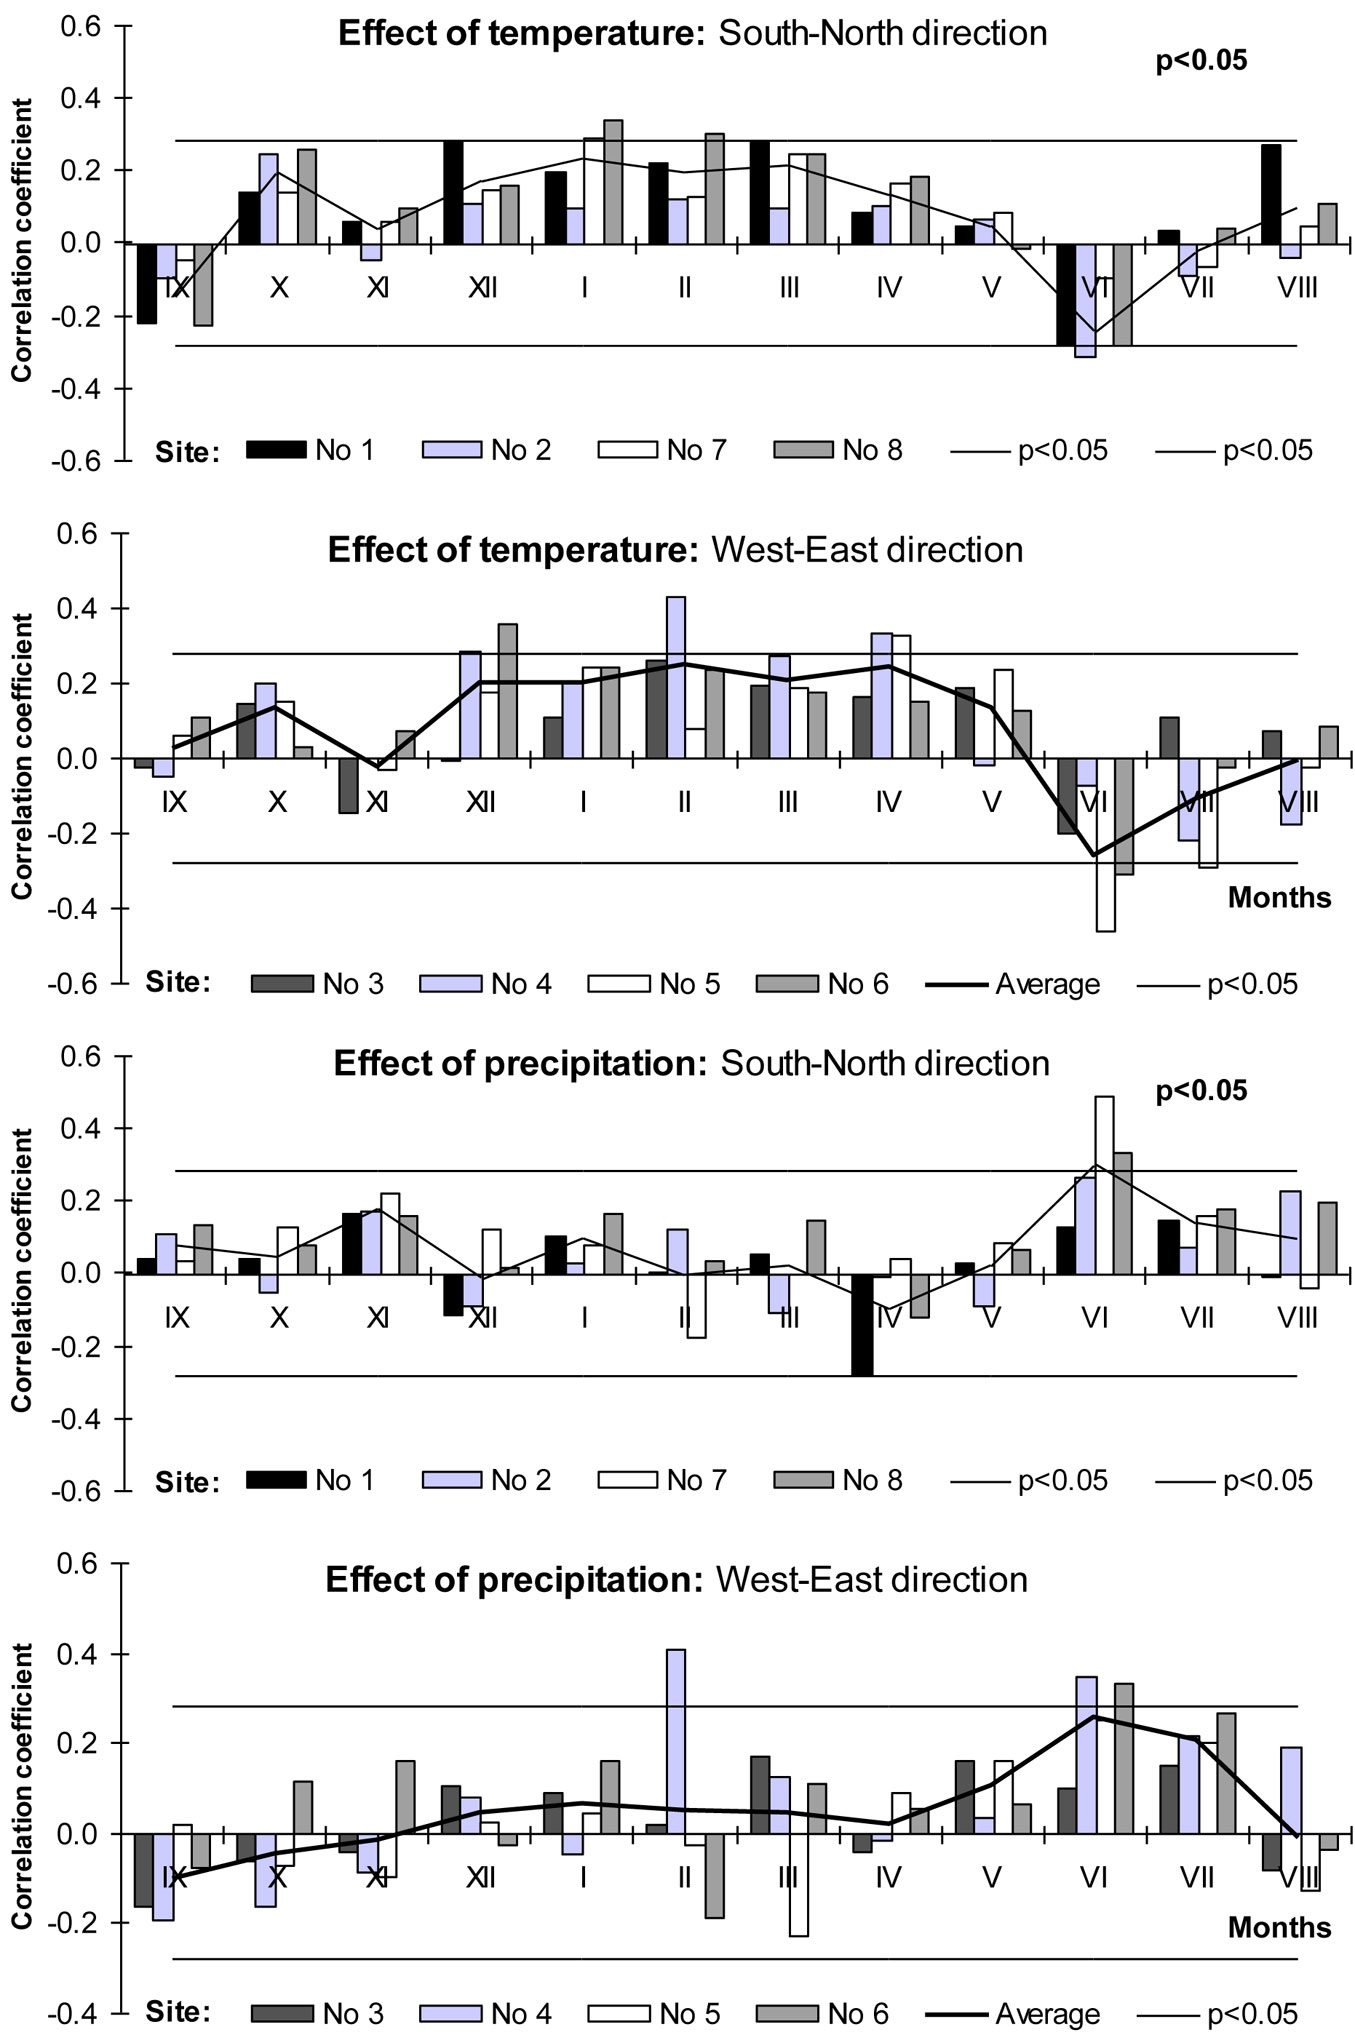
Correlation analysis revealed a positive relationship between warmer winters (December-February) and beech increment indexes as well as negative between mean temperature of June and beech increment indexes (Fig. 7). Increment indexes obtained at the site of natural distribution (Poland, Site No. 1) significantly and positively correlated with warmer dormant period. Moving to the north along the seaside, the significance of this relationship increased, especially at Lithuanian Sites No 7 and Latvian Site No 8. Warmer April and May seemed to have also positive impact on beech growth, especially at most eastern Lithuanian sites Nos 5 and 6. It could be explained by an earlier budburst which increases the probability of late frost impact in temperate and boreal zones ([31]), resulting in the reduction of tree increment.
High temperatures during July-September usually had a negative impact on beech stem radial increment of the following year ([21]). In our case, we detected negative relationships between June’s mean temperature and increment indexes of beech trees. The significance of these negative relationships increased moving eastward, and the most significant value was reached at the most eastern site, i.e., Site No. 5 (Kaunas District - Lithuania).
Contrary to the statement that a positive effect of precipitation during the growing period could be detected only at high altitude ([43]), the results obtained revealed that these positive relationships could be detected also at lower altitude, but outside the beech natural distribution range in northeastern Europe (Fig. 7). It should be noticed that the relationship between the precipitation amount of the rest months and increment indexes was much less significant (p>0.05). Tree water deficit during the growing season negatively affects tree ring formation by inhibiting cell division and enlargement ([63]), and reduces carbon assimilation via stomatal control of photosynthesis and transpiration ([14]) - moving toward the northeast the significance of this effect increased. The least significant relationships between precipitation amount in June and annual increment of beech were detected at Sites No 1 and 3, and the most significant at Site No 7.
Previously reported growth-climate correlation analyses yielded negative correlations with summer temperature and positive correlations with precipitation at the same time ([57]) - this was consistent with our results. The lack of humidity and heat during June-July was one of the key factors limiting the migration of beech trees northward. These findings agreed well with the known sensitivity of beech growth to drought in the period between budburst and the end of July ([21], [38], [46], [51]). A cold dormant period especially winter months is a likely accompanying factor limiting beech tree growth and distribution toward the northeast of Europe.
Recently, beech tree growth decline has become a widespread phenomenon in Europe. Higher temperatures accompanied with lack of humidity during the vegetative period may lead to a rapid decline in the growth of range-edge populations and to the consequent retreat of the compounds distribution in southern Europe ([35]). Beech does not tolerate extreme water stress. Therefore, during the growing period, especially June and July, low temperatures and high precipitation supported the formation of wide tree rings. Warm, sunny and dry early autumn also promoted radial growth at the beginning of the following season ([21]).
The results of the correlation analysis revealed that in the most northeastern location of beech distribution range the lack of humidity (precipitation) in the middle of the vegetative period (July), frost in winter, lower temperatures in early spring (March-April) and higher temperatures in June limited the growth of beech trees.
Relationships between beech increment indexes and air concentration of acidifying compounds, their deposition and surface ozone
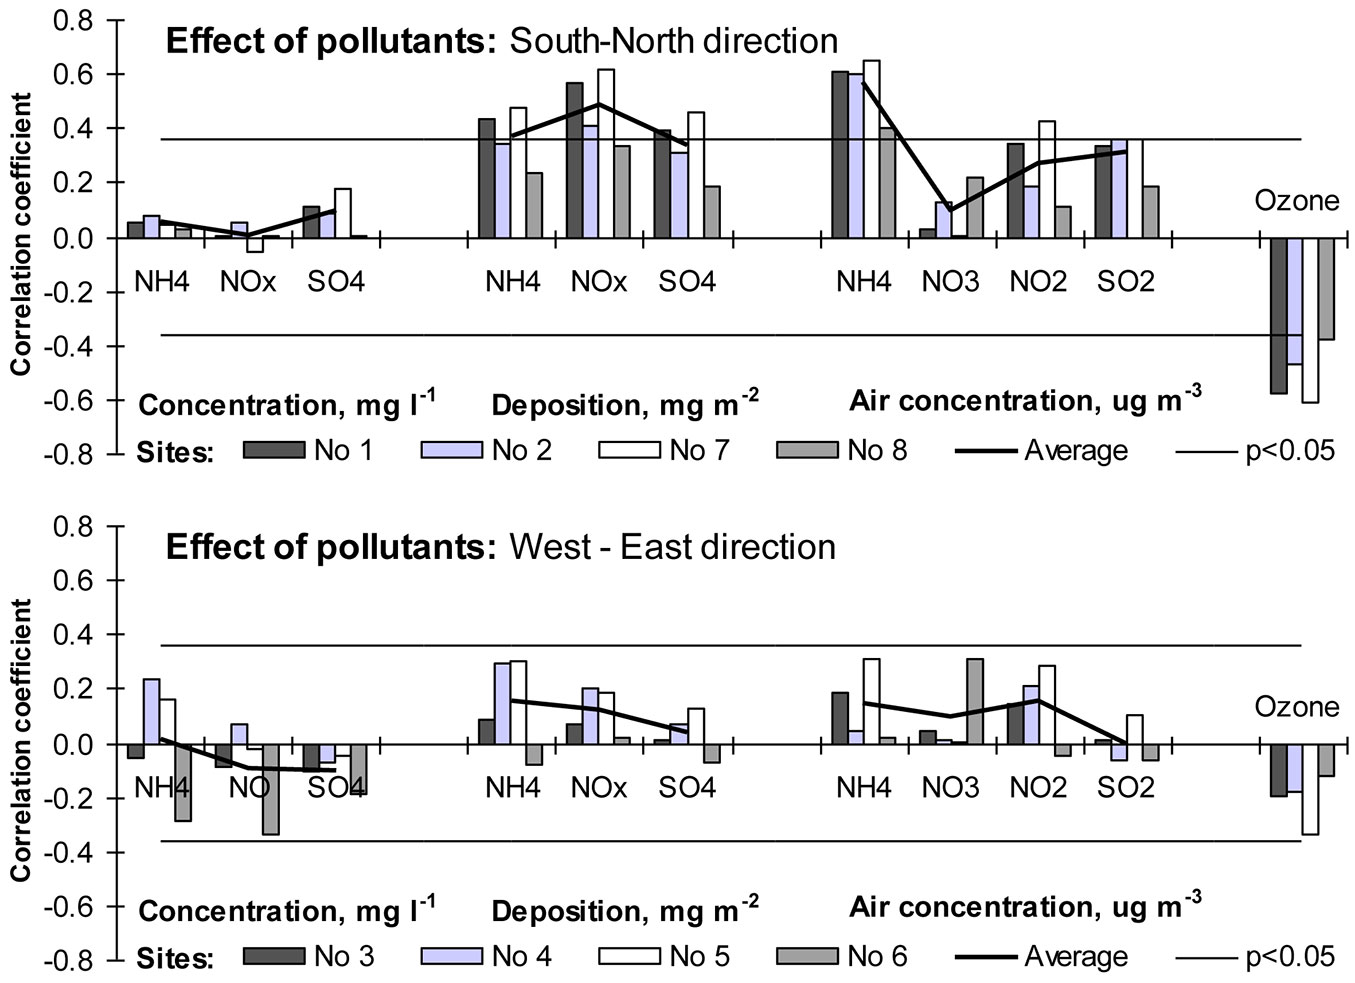
The recent trend of increasing growth of forest trees is often attributed not only to climate change and increased atmospheric concentrations of CO2, but also to the increased nitrogen deposition ([13], [12]), especially for nitrogen-limited soils ([1]). Sulfur and its acid deposition both had negative effects on tree health and productivity, but showed mostly positive slopes with tree growth only due to their high correlation with nitrogen deposition ([54]) whose effect is well established. In areas with high levels of nitrogen deposition the growth of beech trees is mitigated, and at lower fertility sites the nitrogen deposition has a fertilizing effect on beech growth ([1], [59], [60]). Our results suggest that N deposition on the edge and outside of beech distribution range could have also positive effect on beech tree stem increment. Relationships between increment indexes and N deposition (ammonium and nitrate) were statistically significant, but only at sites near to the Baltic Sea. Precipitation, which is the key factor of total wet deposition ([6]), is partly responsible for that reaction of beech tree growth. On the other hand, the positive relationship between ammonium concentration in precipitation and increment indexes was statistically significant at 5 out of the 8 monitored stands.
Beech is one of the most sensitive tree species to the phytotoxic effect of surface ozone ([40], [41], [42], [49]). The results obtained in this study fully confirmed such evidence. The relationships between surface ozone and beech tree ring indexes showed the highest negative significance rate. A higher concentration of ozone limited beech tree growth near the sea (Sites No 1, No 2, No 8) as well as sites close to it (Site No 7). Most likely, spatial variation in surface ozone concentration (which was not accepted in the present study since data from one EMEP station was used) could have had an essential effect on the significance of the detected relationships (Fig. 8).
Fig. 8 - Relationships between beech tree increment indices and air concentration of surface ozone, acidifying species and acid deposition.
Integrated effect of environmental factors on beech increment indes
The integrated effect of meteorological parameters, air concentration of surface ozone, along with acidifying compounds and their deposition, on beech tree increment indexes in northeast Europe was assessed by multiple regression analysis, whose results are reported in Tab. 5. The reduction in beech tree increment significantly correlated with frost in winter and heat in summer, as well as with more abundant precipitation in winter and drought in summer. Negative effect of these meteorological variables reinforced the effect of surface ozone and sulphur deposition, while nitrate air concentration and its deposition seemed to have positive effect on tree increment. The detected key environmental parameters explained up to 70-80% variation in beech tree increment indexes at the studied sites separately (Models 1-8). Similar results were obtained in our earlier study, i.e., air concentrations of sulfur dioxide and ozone, together with sulfur deposition, limited the growth of Scots pine trees, and only nitrate deposition and its air concentration had a positive effect on pine growth ([2], [3]). The same reactions to environmental factors most likely could explain why pine and beech trees grow together very well outside the beech natural range.
Tab. 5 - Key predicting variables of beech tree increment indexes and main statistics of the developed multi-regression models. (*): the number of cases applied for the model: N=A+B +1, where A is the number of predicting variables and B represents the degree of freedom; N=29 - years from 1982 to 2010; N=230 - 8 sites per 27-29 years. Relationship: (↑) positive; (↓) negative; in all cases p<0.05.
| Site No/ Parameter |
Model* (A-B) |
Long | Monthly temperature | Precipitation amount | Air concentration | Deposition | Statistics | |||||||||
|---|---|---|---|---|---|---|---|---|---|---|---|---|---|---|---|---|
| XII | II | VI | VII | XII | X | V | VII | O3 | NO3- | SO42- | NO3- | R2 | p | |||
| 1 | (8 - 20) | - | ↑ | ↑ | ↓ | - | ↓ | - | - | ↑ | ↓ | - | ↓ | ↑ | 0.715 | 0.0006 |
| 2 | (5 - 23) | - | ↑ | - | ↓ | - | - | - | - | ↑ | ↓ | ↑ | - | - | 0.621 | 0.0007 |
| 3 | (7 - 21) | - | - | ↑ | ↓ | - | - | ↓ | - | ↑ | ↓ | - | ↓ | ↑ | 0.639 | 0.0019 |
| 4 | (6 - 22) | - | - | ↑ | ↓ | ↓ | - | - | - | ↑ | - | - | ↓ | ↑ | 0.623 | 0.0007 |
| 5 | (7 - 19) | - | - | ↑ | ↓ | ↓ | - | - | ↑ | - | ↓ | - | ↓ | ↑ | 0.733 | 0.0004 |
| 6 | (6 - 22) | - | ↑ | ↑ | ↓ | - | - | - | ↑ | - | ↓ | - | - | ↑ | 0.638 | 0.0003 |
| 7 | (9 - 19) | - | ↑ | ↑ | ↓ | - | - | ↓ | ↑ | - | ↓ | ↑ | ↓ | ↑ | 0.829 | 0.0000 |
| 8 | (7 - 21) | - | ↑ | - | ↓ | - | - | - | - | ↑ | ↓ | ↑ | ↓ | ↑ | 0.712 | 0.0003 |
| Temperature | (3 - 226) | - | ↑ | - | ↓ | ↓ | - | - | - | - | - | - | - | - | 0.120 | 0.0000 |
| Precipitation | (2 - 227) | - | - | - | - | - | - | - | ↑ | ↑ | - | - | - | - | 0.097 | 0.0000 |
| Meteorology | (4 - 225) | - | - | ↑ | ↓ | - | - | - | ↑ | ↑ | - | - | - | - | 0.239 | 0.0000 |
| Concentration | (2 - 227) | - | - | - | - | - | - | - | - | - | ↓ | ↑ | - | - | 0.159 | 0.0000 |
| Deposition | (2 - 227) | - | - | - | - | - | - | - | - | - | - | - | ↓ | ↑ | 0.090 | 0.0001 |
| Pollution | (4 - 225) | - | - | - | - | - | - | - | - | - | ↓ | ↑ | ↓ | ↑ | 0.227 | 0.0000 |
| Total | (11- 218) | ↑ | ↑ | ↑ | ↓ | - | - | ↓ | ↑ | ↑ | ↓ | ↑ | ↓ | ↑ | 0.489 | 0.0000 |
| Deposition | (8 - 221) | - | ↑ | ↑ | ↓ | - | - | ↓ | ↑ | ↑ | ↓ | ↑ | - | - | 0.375 | 0.0000 |
| Concentration | (8 - 221) | - | - | ↑ | ↓ | - | ↓ | ↓ | ↑ | ↑ | - | - | ↓ | ↑ | 0.329 | 0.0000 |
| Nitrogen | (8 - 211) | ↑ | ↑ | ↑ | ↓ | - | - | ↓ | ↑ | ↑ | - | ↑ | - | - | 0.273 | 0.0000 |
| S | (7 - 212) | ↑ | ↑ | ↑ | ↓ | - | - | - | ↑ | ↑ | - | - | ↓ | - | 0.259 | 0.0000 |
| S + O3 | (9- 210) | ↑ | ↑ | ↑ | ↓ | - | ↓ | - | ↑ | ↑ | ↓ | - | ↓ | - | 0.364 | 0.0000 |
| O3 included | (8 - 211) | ↑ | ↑ | ↑ | ↓ | - | ↓ | - | ↑ | ↑ | ↓ | - | - | - | 0.333 | 0.0000 |
| O3 excluded | (10- 219) | ↑ | ↑ | ↑ | ↓ | - | - | ↓ | ↑ | ↑ | - | ↑ | ↓ | ↑ | 0.364 | 0.0000 |
| Meteorology | (5- 204) | ↑ | - | ↑ | ↓ | - | - | - | ↑ | ↑ | - | - | - | - | 0.252 | 0.0000 |
| Longitude | (10- 219) | - | ↑ | ↑ | ↓ | - | - | ↓ | ↑ | ↑ | ↓ | ↑ | ↓ | ↑ | 0.454 | 0.0000 |
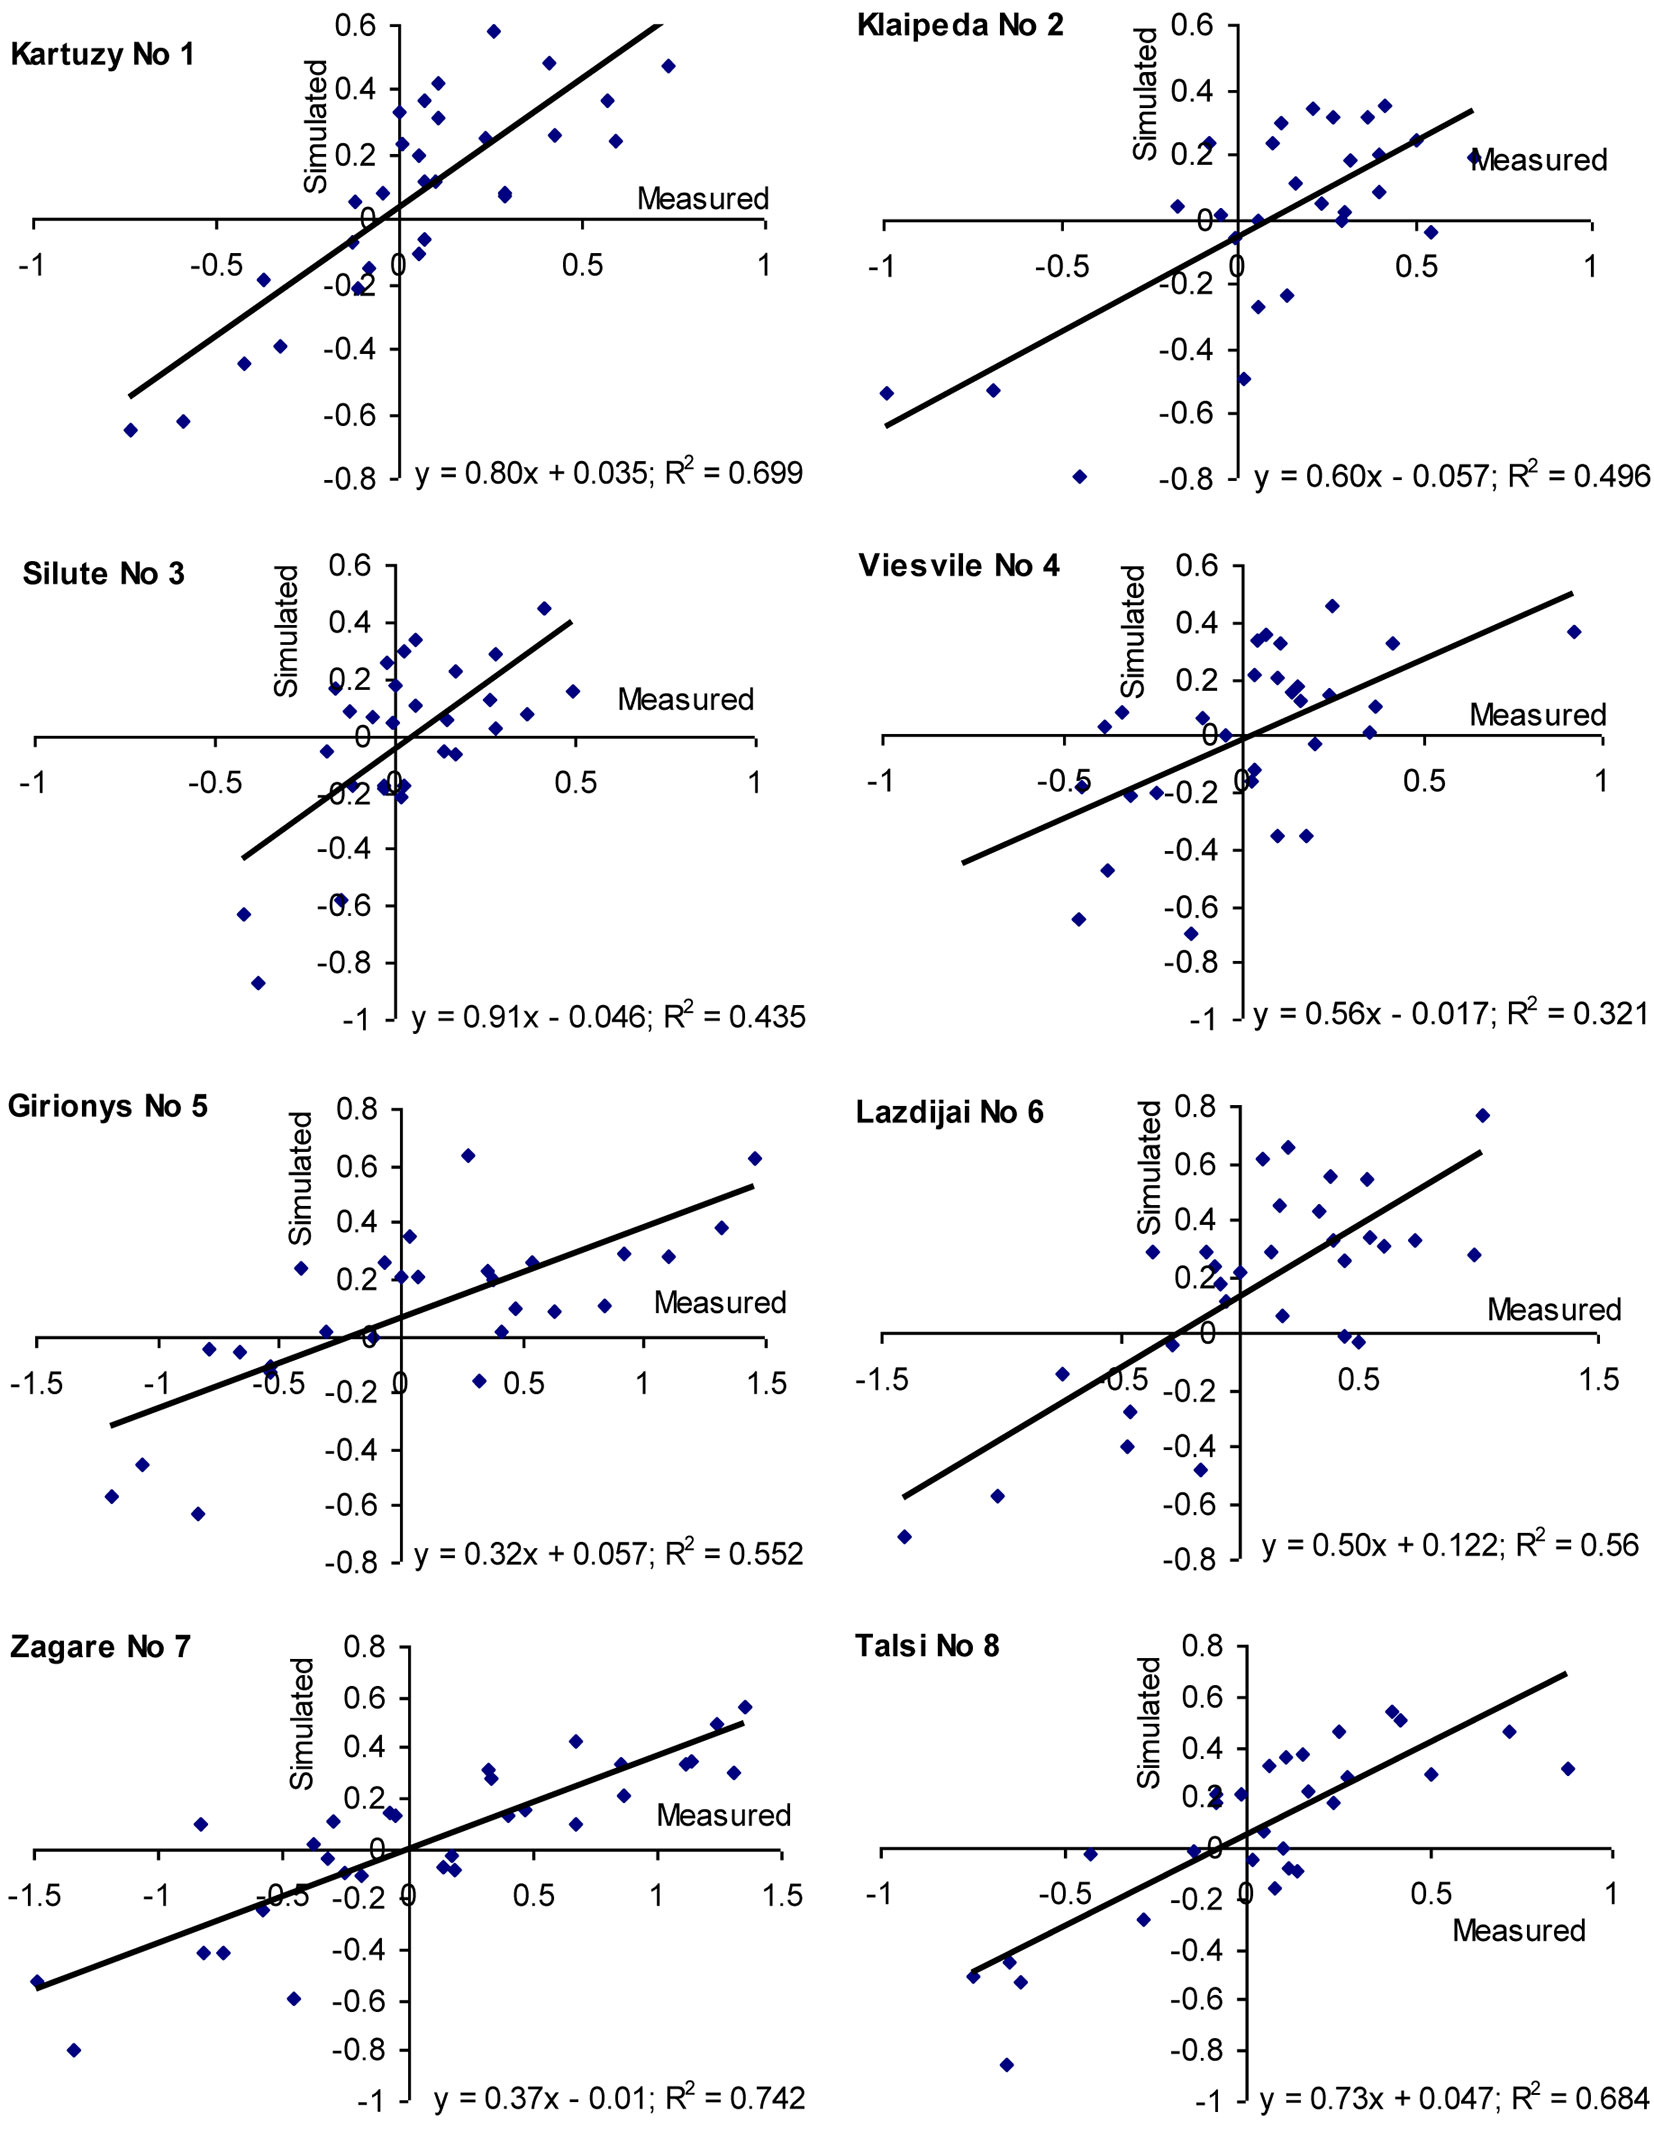
The general model developed in this study revealed that the detected key variables explained up to 50% of the total variation in beech increment indexes on the edge and outside their natural distribution range. Separate analyses carried out using the models at the sites considered revealed that coefficient of determination (R2) ranged from 30 to 40% at Sites No 3 and-4 up to 60-70% at Sites Nos 1, 7 and 8 (Fig. 9). It is worth to notice that increment indexes correlated best with environmental factors in Poland (Site No 1, natural growth conditions) and at the most northern sites (Site No 8 in Latvia, and Site No 7 in Lithuania), as well as at the most eastern locations (Sites No 5 and 6).
Fig. 9 - Evaluation of the created model significance at the considered beech sites by comparing measured and simulated beech increment indices over 1981-2010 period.
Air temperature effect on the variation of increment indexes was higher than the effect of precipitation (about 12% and 9%, respectively). Their integrated effect could explain up to 24% of the total variation in beech tree increment indexes. The effect of surface ozone, acidifying compounds in the air and their acid deposition showed very similar pattern. The explanatory power of surface ozone and air concentration of nitrate was higher than that of sulphur and nitrate deposition. Their integrated effect did not differ from the effect of meteorological variables. Combined with the meteorological parameters, the air concentration of the considered contaminants explained up to 38% of the total variation in beech growth indexes, while acid deposition only up to 33%. The positive effect of nitrate in conjunction with meteorology is higher than the negative effect of sulphur deposition, which increased the amount of variance accounted for meteorology by 0.7% only. Notwithstanding, this the effect was significant for both these contaminants (p<0.05).
The negative relationship between the precipitation in October-December and the increment indexes are difficult to be interpreted. The fact that precipitation is responsible for the total deposition level could be a possible explanation ([4]). Over the winter period, the air concentration of acidifying compounds usually reach the highest values, i.e., more abundant precipitation result in the highest amount of acid deposition. This factor should affect trees condition in general, directly through the effect on tree foliage and indirectly through the effect on soil ([5]).
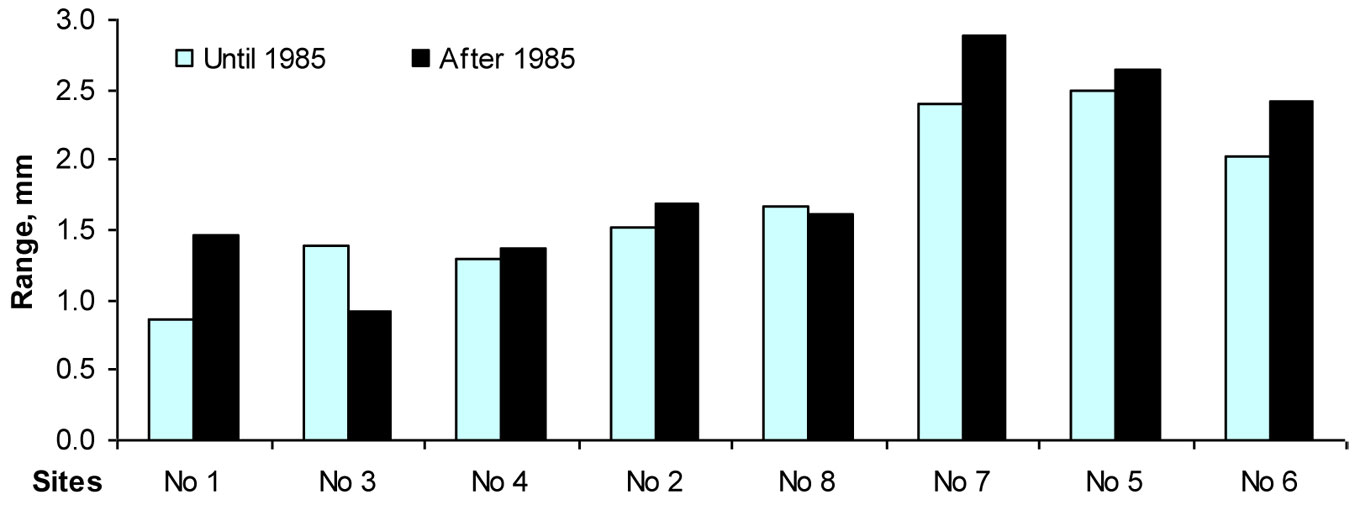
The results of this study also confirmed that European beech is one of the most sensitive tree species to the phytotoxic effect of surface ozone. Although an accurate assessment of the effect of ozone on trees may be obtained only by measuring the ozone flux ([42], [47]), multi-regression models applied in this study revealed that surface ozone can explain up to 12-13% of the total variation in beech increment indexes. It is known that reduced temperatures, shorter growing seasons and reduced nutrient supply with increased altitude can negatively affect growth rates ([18], [20], [37]). The same trend was expected with increasing longitude, but the opposite effect was found in this investigation. The relationship between longitude and beech increment was positive, and its effect on the variation of growth indexes exceeded 3 %. However, moving eastbound outside the beech range, not only maximum values of increment indexes increase, but their minimal values also decrease. Therefore, high amplitude of variation of beech tree increment (Fig. 10) may be interpreted as the key indicator of a decreased resiliency as well as resistance of beech trees to the effect of unfavorable climatic factors. Despite very high growth rates over the favorable periods, beech trees outside their natural range showed increments close to zero in unfavorable periods.
Fig. 10 - The range between maximal and minimal values of beech tree increment indices during 1950-1984 and 1985-2010.
Conclusions
Frost in winter months and heat in June, along with drought in the growing period and more abundant precipitation in winter limited beech tree growth outside its natural distribution range in the north-eastern part of Europe. Higher concentration of surface ozone and sulphur deposition level increased the negative effect on beech growth of the above key meteorological variables. Higher air concentrations of nitrate and their deposition level had a positive effect on beech growth. Based on the trends in air temperature and precipitation, probability of serious frost in winter and drought in summer should be reduced. Cumulative precipitation over winter had a decreasing effect, reducing in turn the amount of acid deposition. Sulphur deposition until 2000 decreased more than tenfold and kept decreasing by approximately 10 mg m-2 per year up to 0.2-0.3 µg S m-3 in 2011. Ozone also showed a tendency towards decreasing. Nitrate air concentration and its deposition over the last 20 years revealed a fertilizing effect on beech growth. Therefore, if changes in the above key parameters will persist, beech tree growth outside its distribution range should increase. The observed increase in the amplitude of variation of beech tree ring indexes may be interpreted as an indicator of the reduced resistance of beech trees to unfavorable environmental factors and possibly to their survival outside its natural range.
References
CrossRef | Gscholar
Gscholar
Gscholar
Gscholar
Gscholar
Gscholar
Gscholar
Gscholar
Gscholar
Gscholar
CrossRef | Gscholar
CrossRef | Gscholar
Gscholar
CrossRef | Gscholar
Gscholar
CrossRef | Gscholar
Gscholar
Authors’ Info
Authors’ Affiliation
Almantas Kliučius
Vitas Marozas
Mantas Pilkauskas
Ingrida Augustaitiene
Aleksandras Stulginskis University, Akademia, LT-53362 Kaunas dstr. (Lithuania)
Vytautas Magnus University, LT-46324 Kaunas (Lithuania)
Institute for Ecology of Industrial Areas, Katowice, Poland
Latvian State Forest Research Institute “Silava” (Latvia)
Latvian University of Agriculture (Latvia)
Corresponding author
Paper Info
Citation
Augustaitis A, Kliučius A, Marozas V, Pilkauskas M, Augustaitiene I, Vitas A, Staszewski T, Jansons A, Dreimanis A (2015). Sensitivity of European beech trees to unfavorable environmental factors on the edge and outside of their distribution range in northeastern Europe. iForest 9: 259-269. - doi: 10.3832/ifor1398-008
Academic Editor
Elena Paoletti
Paper history
Received: Jul 12, 2014
Accepted: May 26, 2015
First online: Oct 16, 2015
Publication Date: Apr 26, 2016
Publication Time: 4.77 months
Copyright Information
© SISEF - The Italian Society of Silviculture and Forest Ecology 2015
Open Access
This article is distributed under the terms of the Creative Commons Attribution-Non Commercial 4.0 International (https://creativecommons.org/licenses/by-nc/4.0/), which permits unrestricted use, distribution, and reproduction in any medium, provided you give appropriate credit to the original author(s) and the source, provide a link to the Creative Commons license, and indicate if changes were made.
Web Metrics
Breakdown by View Type
Article Usage
Total Article Views: 51830
(from publication date up to now)
Breakdown by View Type
HTML Page Views: 43083
Abstract Page Views: 3289
PDF Downloads: 4174
Citation/Reference Downloads: 23
XML Downloads: 1261
Web Metrics
Days since publication: 3685
Overall contacts: 51830
Avg. contacts per week: 98.46
Article Citations
Article citations are based on data periodically collected from the Clarivate Web of Science web site
(last update: Mar 2025)
Total number of cites (since 2016): 16
Average cites per year: 1.60
Publication Metrics
by Dimensions ©
Articles citing this article
List of the papers citing this article based on CrossRef Cited-by.
Related Contents
iForest Similar Articles
Research Articles
Changes in the proteome of juvenile European beech following three years exposure to free-air elevated ozone
vol. 4, pp. 69-76 (online: 05 April 2011)
Research Articles
Effects of abiotic stress on gene transcription in European beech: ozone affects ethylene biosynthesis in saplings of Fagus sylvatica L.
vol. 2, pp. 114-118 (online: 10 June 2009)
Research Articles
A comparison between stomatal ozone uptake and AOT40 of deciduous trees in Japan
vol. 4, pp. 128-135 (online: 01 June 2011)
Research Articles
Growth patterns of Scots pine (Pinus sylvestris L.) under the current regional pollution load in Lithuania
vol. 8, pp. 509-516 (online: 12 November 2014)
Research Articles
Scots pine’s capacity to adapt to climate change in hemi-boreal forests in relation to dominating tree increment and site condition
vol. 14, pp. 473-482 (online: 18 October 2021)
Research Articles
Soil drench of ethylenediurea (EDU) protects sensitive trees from ozone injury
vol. 4, pp. 66-68 (online: 05 April 2011)
Research Articles
Effects of planted European beech on the understory in Scots pine forests of Lithuania
vol. 7, pp. 12-18 (online: 07 October 2013)
Research Articles
Impact of climate change on radial growth of Siberian spruce and Scots pine in North-western Russia
vol. 1, pp. 13-21 (online: 28 February 2008)
Research Articles
Ambient ozone phytotoxic potential over the Czech forests as assessed by AOT40
vol. 5, pp. 153-162 (online: 25 June 2012)
Research Articles
Prediction of ozone effects on net ecosystem production of Norway spruce forest
vol. 11, pp. 743-750 (online: 15 November 2018)
iForest Database Search
Search By Author
- A Augustaitis
- A Kliučius
- V Marozas
- M Pilkauskas
- I Augustaitiene
- A Vitas
- T Staszewski
- A Jansons
- A Dreimanis
Search By Keyword
Google Scholar Search
Citing Articles
Search By Author
- A Augustaitis
- A Kliučius
- V Marozas
- M Pilkauskas
- I Augustaitiene
- A Vitas
- T Staszewski
- A Jansons
- A Dreimanis
Search By Keywords
PubMed Search
Search By Author
- A Augustaitis
- A Kliučius
- V Marozas
- M Pilkauskas
- I Augustaitiene
- A Vitas
- T Staszewski
- A Jansons
- A Dreimanis
Search By Keyword

