Effects of planted European beech on the understory in Scots pine forests of Lithuania
iForest - Biogeosciences and Forestry, Volume 7, Issue 1, Pages 12-18 (2014)
doi: https://doi.org/10.3832/ifor0695-007
Published: Oct 07, 2013 - Copyright © 2014 SISEF
Research Articles
Collection/Special Issue: IUFRO 7.01.00 - COST Action FP0903, Kaunas (Lithuania - 2012)
Biological Reactions of Forest to Climate Change and Air Pollution
Guest Editors: Elena Paoletti, Andrzej Bytnerowicz, Algirdas Augustaitis
Abstract
Understanding how the planting of non-native species impacts native vegetation is of most importance for forest management, as introduced species may alter environmental conditions with respect to soil composition, light intensity, and species composition. Here, we compared the stand structure, understory vegetation and site properties of a natural Scots pine (Pinus sylvestris L.) stand with Norway spruce (Picea abies (L.) Karst.) and European beech (Fagus sylvatica L.) as the second tree layer. We recorded saplings and species and their abundance in the understory vegetation, the thicknesses of organic (O) and humus (A) soil layers, soil pH and light indexes in nine Scots pine stands with a second tree layer of beech and in nine control pine stands with a second tree layer of spruce. An ordination method was used to analyze all the data together and ANOVA to determine whether there were differences between stands. We found that species diversity in pine stands with planted beech as the second layer was lower than in pine stands with spruce as the second layer. In pine stands with beech as the second tree layer, shrub, herb and moss cover was significantly lower, and the soil humus layer and organic soil layer were thicker and thinner, respectively. Stand parameters such as mean volume and mean annual increment of the second tree layer were significantly higher in pine stands with planted beech as the second tree layer than in pine stand with spruce as the second tree layer. The mean volume and the mean annual increment of the first tree layer dominated by Scots pine did not differ significantly between stands with planted beech and those with natural spruce. Scots pine stands with a beech second layer had negative effects on understory species richness and abundance. This effect was most likely due to the lower light transmittance and poor physical properties of the forest-floor litter in the Scots pine stands with planted beech.
Keywords
Non-native Tree Species, Fagus sylvatica, Litter, Pinus sylvestris, Soil, Species Richness, Vegetation, Vertical Structure
Introduction
Extensive plantations of non-native, highly-productive tree species having high commercial value of wood have been carried out in several countries. However, to ensure sustainable management, it is necessary to know the effects of planted tree species on ecosystem diversity, structure and function ([3], [18]).
Understanding the effect of planted trees on understory species is important because these species play an important role in the functioning of forest ecosystems. Tree species in the stand can affect understory vegetation by changing the physical and chemical features of the litter and topsoil, as well as the leaf area index, which determines the amount of light reaching the understory ([30], [3], [27], [38], [14], [4]). Several studies on the impact of tree species on leaf-litter ([16], [13]) and soil properties ([15], [37], [1], [20], [35]) have been conducted. Previous studies have also compared the stand structure of plantations and natural forests ([29]) and the effects of overstory species on understory plant species ([11], [19], [36], [43], [42]).
To improve forestry practices and account for forest ecosystem biodiversity, additional studies that compare stand structure and its effects on the understory vegetation of plantations and natural forests are crucial, especially in stands including non-native species. The presence of a second (intermediate) tree layer greatly modifies understory vegetation, especially due to its effects on light regimes and site properties.
European beech (Fagus sylvatica L.) is the most commercially important tree species in central Europe. Beech is a shade-tolerant, highly competitive species that tolerates a wide variety of environmental conditions ([33]). However, beech is sensitive to drought, which restricts its distribution mainly to sub-oceanic regions.
Beech is one of the most recent tree species spreading to northern European territories after the last glaciation. Although European beech may still be migrating northwards, it is limited by various climatic factors ([6]). The north-eastern limit of its range is primarily determined by low winter temperatures and late spring frosts ([24], [2]). It has been argued that European beech is expanding its range in northeastern Europe ([17], [7]). Due to climate change, mean annual air temperature at the northeastern bounds of its distribution is expected to increase by a further 2-5 °C by the end of this century ([25]). Climate warming is predicted to increase winter precipitation but slightly decrease summer rainfall ([25]); these changes may favor the expansion of European beech in north-eastern Europe.
Only a few studies have examined European beech tree growth and its effect on understory vegetation outside its natural distribution range. The aim of this study was to test differences of the stand structure, understory vegetation and site properties between natural Scots pine (Pinus sylvestris L.) forest with a Norway spruce (Picea abies (L.) Karst.) as second tree layer and Scots pine stand with a second tree layer of planted European beech growing outside of its distribution area. We hypothesized that planted beech trees as a second tree layer affect stand structure, species diversity, soil properties, and light conditions of pine stands.
Material and methods
Study area
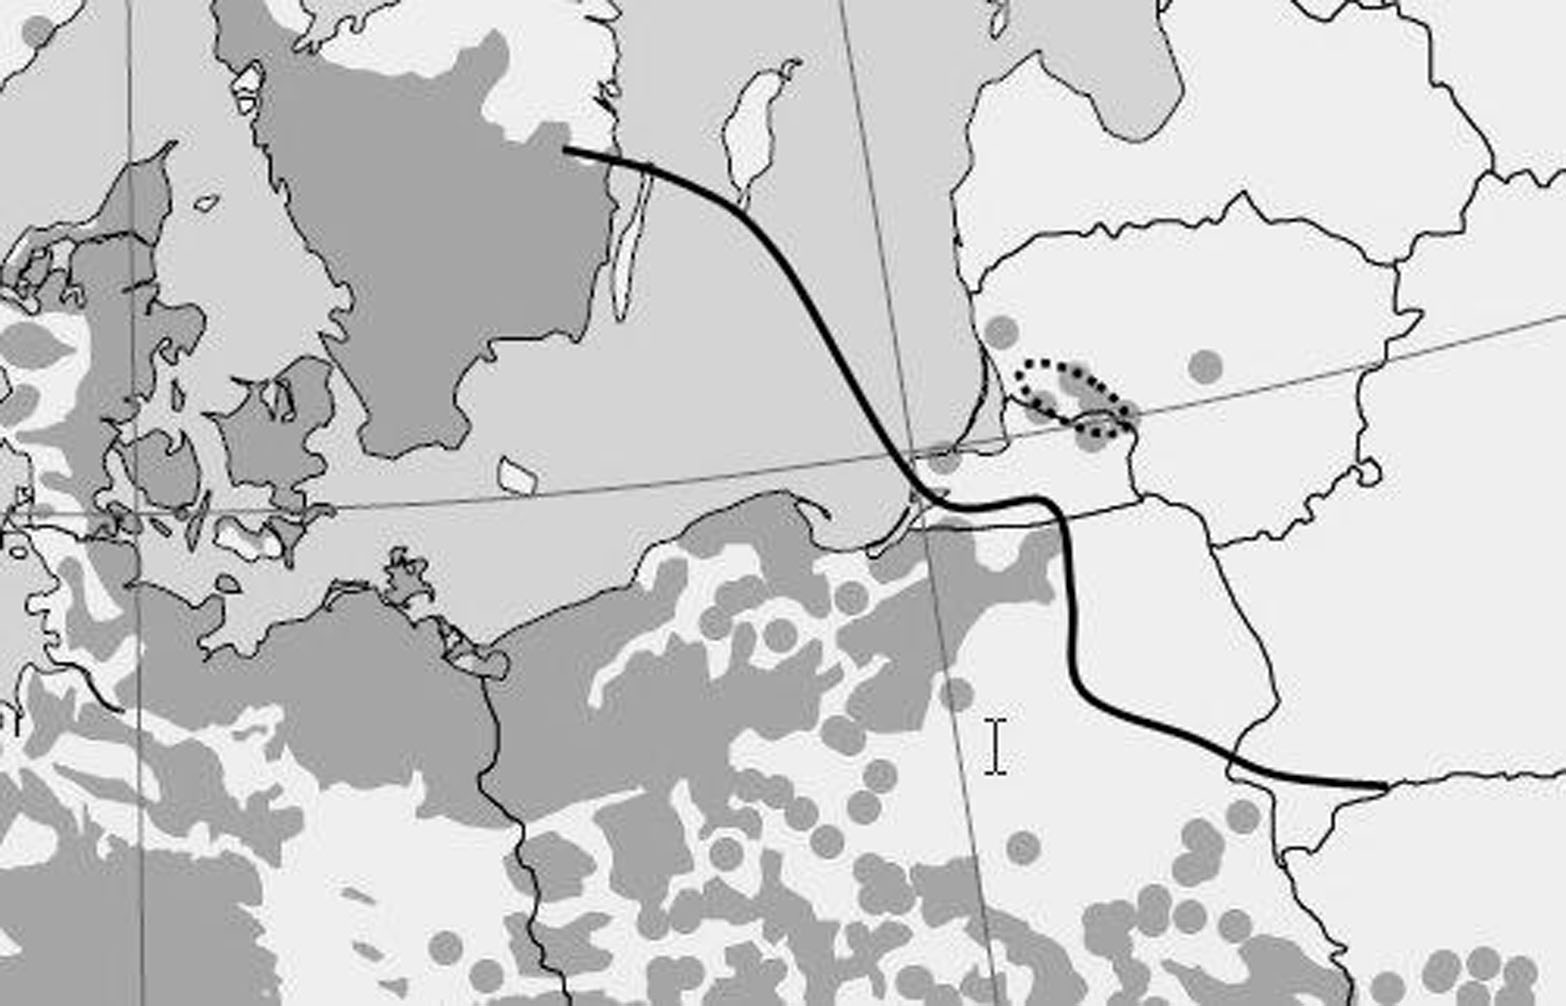
The study area was situated about 150 km north-east of the limit of the natural distribution of European beech in Poland (Fig. 1). The study plots were located in the western part of Lithuania in the forests of Norkaiciai (55.448 N; 21.519 E) and Viesvile (55.078 N; 22.397 E).
Fig. 1 - European beech range in north-eastern Europe (grey area), its distribution limits (continuous line) and the location of the study sites (dotted line). Adapted from von Wuehlisch ([46])
The altitude at the study site was 50-70 m a.s.l. The average annual temperature was 6.3-6.8 °C, with an average January (coldest month) temperature of -3.2 °C and an average July (warmest month) temperature of 16.3 °C. Annual precipitation was 750-800 mm. The frost-free period lasts 160-170 days, with permanent snow cover for 75-80 days ([10]). The study area was characterized by sandy, acidic, nutrient-poor soils, and pure Scots pine stands were the prevailing forest type.
The study was carried out on 90-125-years-old Scots pine stands with a second layer dominated by Norway spruce or European beech. European beech was planted during the period 1945-1955. All of the stands were growing on nutrient-poor sandy Arenosols (forest type: Vaccinio-myrtillo Pinetum). The following species prevailed in the understory vegetation: Vaccinium myrtillus, V. vitis-idaea, Festuca ovina, Luzula pilosa and Melampyrum pratense in the dwarf shrub and herb layer, and Dicranum polysetum, D. scoparium, Hylocomium splendens and Pleurozium schreberi in the moss layer.
Sampling
Sampling of stand parameters included recording saplings and species and their abundance in the understory vegetation, and determining the thicknesses of organic (O) and humus (A) soil layers, soil pH and light indexes in nine Scots pine stands with a second tree layer of beech and in nine control pine stands with a second tree layer of spruce. Control stands were located close to stands with beech.
Sampling was conducted in July and August 2011. A circular sample plot with an area of 500 m2 (r = 12.62 m) was laid out in a homogenous area located in the center of each stand. The diameters of all trees (dbh > 8 cm) were measured at a height of 1.3 m. Five to ten trees of medium height for each species were selected and their height measured using the ultrasonic hypsometer Vertex III. Age was determined by counting the number of tree rings in cores from five trees. Tree density, basal area and volume were estimated for each stand. Volume was estimated using local models used in the inventory of Lithuanian forests ([44]). The number of saplings was recorded in 50 m2 circular sample plots, and species and heights of saplings were noted. Trees of up to 4 m in height were considered as saplings ([44]).
Herbaceous and moss species composition and abundance were recorded for each species according to the Braun-Blanquet method ([8]). The overall percentage of cover for each vegetation layer (trees I and II layers, shrub, herb and moss layers) was also estimated. All plant species were classified according to the nomenclature of Jankevičiene ([26]). Tree species were assigned to different layers according to their heights (shrub layer, trees up to 4 m; tree II layer, trees whose height differed by more than 25% from tree I layer). In each plot, the thicknesses of the organic (O) soil and humus (A) soil layers were obtained by averaging the results of a set of five replicate measurements. Composite soil samples of 0-10 cm mineral soil layers were sampled for pH measurements, carried out potentiometrically in a 1 M CaCl2 suspension at the Agrochemical Research Laboratory.
Light availability was quantified by digital hemispherical photographs taken in the center of each plot using the equipment and software Hemiview (Delta-T devices Ltd., Cambridge, UK). A self-leveling camera mounted on tripod was positioned 1 m above the ground. The camera was oriented to magnetic north, and exposure and aperture were set according to the manufacturer’s recommendations (Delta-T Devices Ltd., Cambridge, UK). To obtain high-quality, evenly exposed photographs, photos were taken when the sky was overcast. Photographs were analyzed using the Hemiview software. Image classification was performed manually using the threshold algorithm Hemiview according to the recommendations in the user manual. For further data analyses, we used the indirect site factor (ISF), direct site factor (DSF), global site factor (GSF) and leaf area index (LAI) as measures of light intensity ([47]).
Data analyses
An ordination method was used to analyze all the data from seven plots pooled together. Vegetation data (abundance of each species) fwere considered as the dependent (response) variables. Tree, shrub, herb and moss layer cover, and stand (volume and mean annual increments of I and II stand layers), soil (thickness of O and A layers, soil pH) and light (ISF, DSF, GSF, LAI) parameters were independent (explanatory) variables in the analysis.
Detrended Correspondence Analysis (DCA) was first applied to test the data set for unimodality. Since the length of the gradient was long (more than 3SD), a Canonical Correspondence Analysis (CCA) was used to compare all the results globally ([32]). Generalized additive modeling (GAM) was then applied to assess species responses on the CCA axes ([32]). The CANOCO package was used for both ordination analyses and generalized additive modeling ([45]).
Shannon’s (H) and Simpson’s (D) diversity indexes were calculated to assess differences in species richness among plots. ANOVA was performed using species richness, stands, soil parameters and light indexes to verify whether there were differences between pine stands with spruce as the second tree layer and pine stands with beech as the second tree layer.
Results
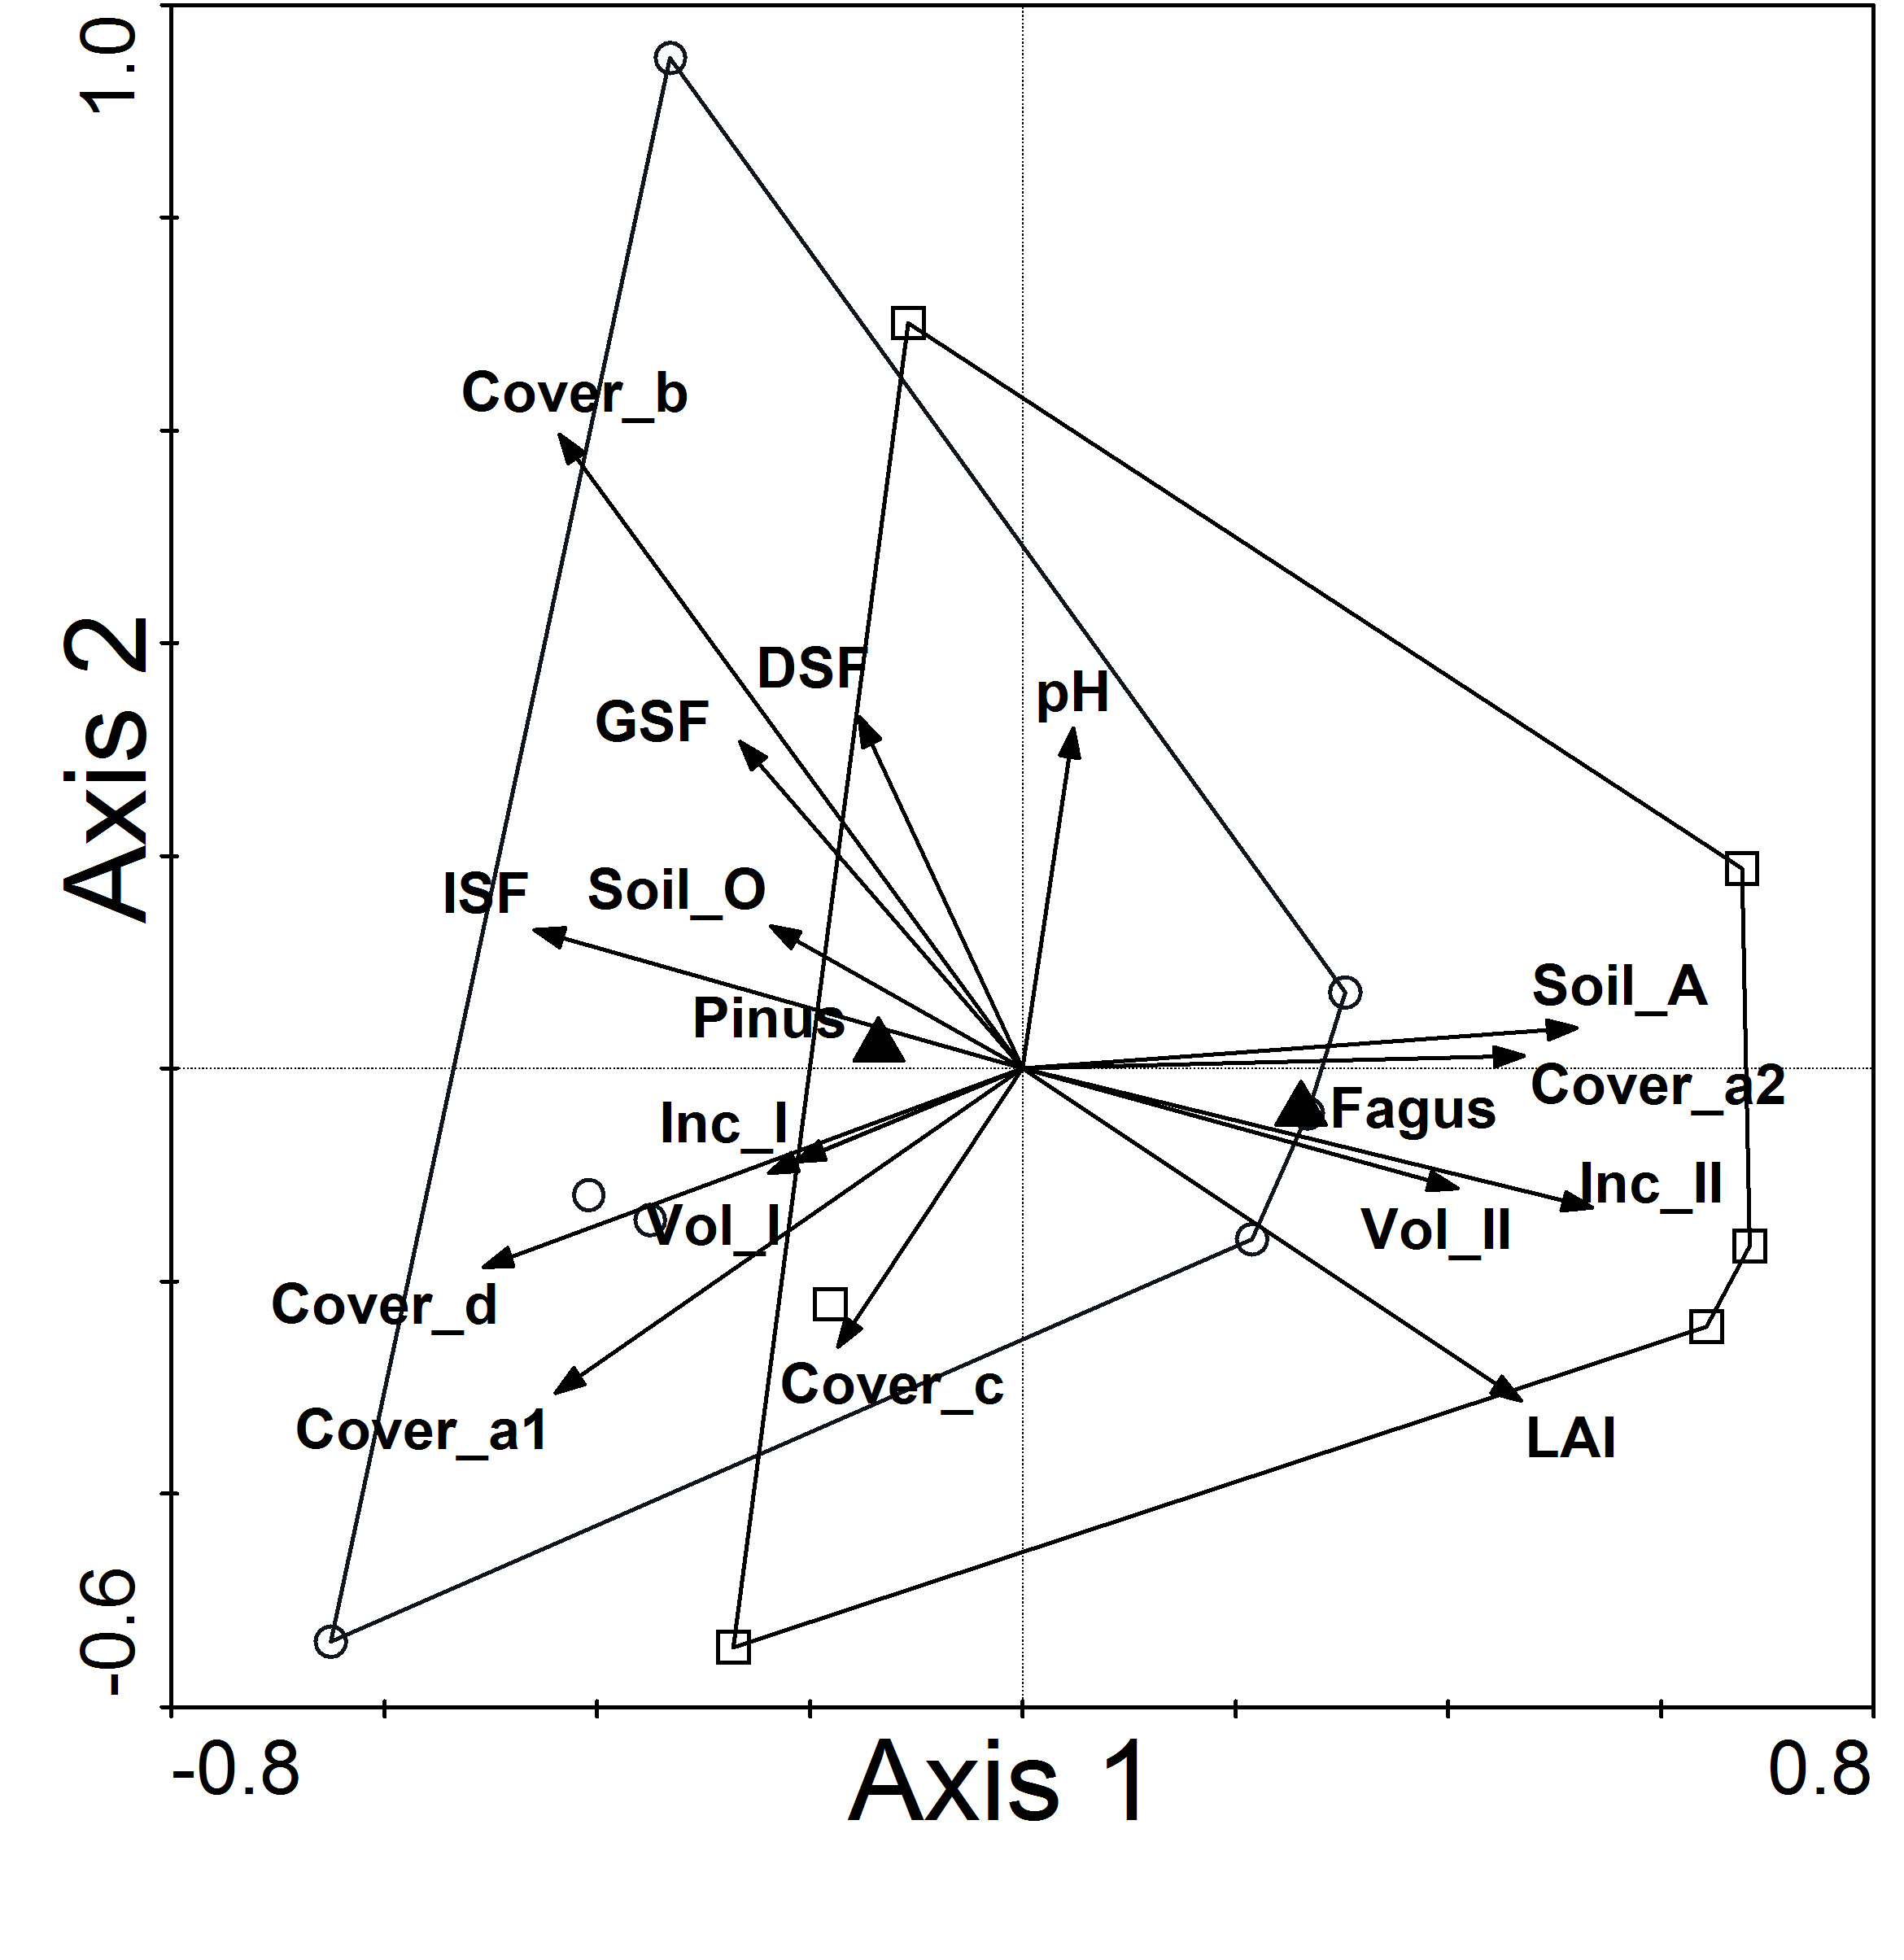
The joint comparison obtained by CCA differentiated the studied stands (Fig. 2). CCA of vegetation data with stand structure parameters, soil properties and light indexes indicated that pine stands with beech as the second tree layer clustered mostly together and were distinct from pine stands with spruce as the second tree layer along CCA Axis 1.
Fig. 2 - Canonical Correspondence Analysis (CCA) of understory vegetation with stand structure indexes and environmental variables for Scots pine stands with beech and spruce as second layers. (Cover_a1): cover of I tree layer; (Cover_a2): cover of II tree layer; (Cover_b): cover of shrubs; (Cover_c): cover of herbs; (Cover_d): cover of mosses; (DSF): direct site factor; (Fagus): Scots pine stands with beech as second layer; (GSF): global site factor; (ISF): indirect site factor; (Inc_I): mean annual increment of I tree layer; (Inc_II): mean annual increment of tree II tree layer; (LAI): leaf area index; (Pinus): Scots pine stands with beech as second layer; (pH): pHCaCl2 of mineral soil at a depth of 0-10 cm; (Soil_O): soil organic layer O; (Soil_A): soil layer A; (Vol_I): mean volume of I tree layer; (Vol_II): mean volume of I tree layer.
Compared to Scots pine stands with spru- ce, Scots pine stands with planted beech were associated with thicker humus (A) soil layers and more abundant second tree layers, with higher volume, a mean annual increment of second stand layer and LAI. Pine stands with spruce as the second tree layer were associated with thicker organic (O) soil layers, more abundant moss, herb and shrub coverage, higher volume, a mean annual increment of first stand layer, ISF, DSF and GSF (Tab. 1).
Tab. 1 - Correlation of explanatory variables with the axes of canonical correspondence analysis (CCA) and with plots of Scots pine stands with beech and spruce as second layers. (AX1): CCA axis1; (AX2): CCA axis2; (AX3): CCA axis3; (AX4): CCA axis4; (Cover_a1): cover of I tree layer; (Cover_a2): cover of II tree layer; (Cover_b): cover of shrubs; (Cover_c): cover of herbs; (Cover_d): cover of mosses; (DSF): direct site factor; (Fagus): Scots pine stands with beech as second layer; (GSF): global site factor; (ISF): indirect site factor; (Inc_I): mean annual increment of I tree layer; (Inc_II): mean annual increment of tree II tree layer; (LAI): leaf area index; (Pinus): Scots pine stands with beech as second layer; (pH): pHCaCl2 of mineral soil at a depth of 0-10 cm; (Soil_O): soil organic layer O; (Soil_A): soil layer A; (Vol_I): mean volume of I tree layer; (Vol_II): mean volume of I tree layer.
| Parameters | AX1 | AX2 | AX3 | AX4 | Fagus | Pinus |
|---|---|---|---|---|---|---|
| Cover_a1 | -0.5796 | -0.4021 | 0.471 | 0.1397 | -0.4827 | 0.4827 |
| Cover_a2 | 0.8941 | 0.022 | -0.0707 | 0.0562 | 0.8913 | -0.8913 |
| Cover_b | -0.4748 | 0.6493 | -0.4927 | 0.1532 | -0.5485 | 0.5485 |
| Cover_c | -0.4905 | -0.7377 | 0.2717 | -0.1658 | -0.3884 | 0.3884 |
| Cover_d | -0.8916 | -0.3283 | 0.2918 | -0.1059 | -0.8259 | 0.8259 |
| Soil O | -0.4735 | 0.2675 | 0.5167 | -0.5469 | -0.5348 | 0.5348 |
| Soil A | 0.6745 | 0.0492 | -0.3054 | 0.0753 | 0.6436 | -0.6536 |
| pH | 0.0551 | 0.368 | -0.4784 | -0.0641 | -0.0177 | 0.0177 |
| Vol I | -0.2456 | -0.101 | 0.0092 | -0.0598 | -0.2428 | 0.2428 |
| Vol II | 0.8412 | -0.2328 | -0.1078 | 0.0837 | -0.8832 | 0.8832 |
| Inc I | -0.2706 | -0.1104 | -0.016 | -0.063 | -0.2667 | 0.2667 |
| Inc II | 0.8651 | -0.2121 | -0.0643 | 0.0874 | 0.9042 | -0.9042 |
| ISF | -0.8611 | 0.2447 | 0.2855 | -0.2802 | -0.8926 | 0.8926 |
| DSF | -0.1852 | 0.3981 | 0.0028 | 0.1853 | -0.2569 | 0.2569 |
| GSF | -0.3789 | 0.4386 | 0.0708 | 0.1115 | -0.4545 | 0.4545 |
| LAI | 0.6332 | -0.4222 | -0.3894 | 0.2783 | 0.6913 | -0.6913 |
Results from ANOVA carried out on species number, Shannon’s and Simpson’s diversity indexes showed significant differences between pine stands with either beech or spruce as second tree layers. Species diversity in pine stands with spruce as the second layer was higher than in pine stands with planted beech as the second tree layer (Tab. 2). Stand structure parameters such as vegetation layer coverage were significantly different (except tree layer I) in the two forest types. Shrub, herb and moss layer cover was significantly lower in pine stands with beech as the second tree layer than in pine stands with spruce as the second tree layer. This was also the case for soil O and A layers. There was no significant difference in pH values (Tab. 2).
Tab. 2 - Characteristics of vegetation and soil properties in Scots pine stands with either beech (Pinus sylvestris - Fagus sylvatica) or spruce (Pinus sylvestris - Picea abies) as second layers. (H): Shannon’s diversity index; (D’): Simpson’s diversity index; (SD): standard deviation; (Min): minimal value; (Max): maximal value; [p (F-test)]: significance value.
| Parameters | Pinus sylvestris - Fagus sylvatica | Pinus sylvestris - Picea abies | p (F-test) | ||||||
|---|---|---|---|---|---|---|---|---|---|
| Mean | SD | Min | Max | Mean | SD | Min | Max | ||
| Species number | 7.28 | 3.147 | 4 | 12 | 17.85 | 1.069 | 16 | 19 | 0.0000 |
| H | 1.847 | 0.491 | 1.194 | 2.378 | 2.818 | 0.075 | 2.694 | 2.93 | 0.0002 |
| D’ | 0.797 | 0.097 | 0.66 | 0.887 | 0.931 | 0.006 | 0.922 | 0.939 | 0.0034 |
| Cover of I tree layer | 53.28 | 9.759 | 40 | 65 | 47.71 | 7.867 | 40 | 60 | 0.0683 |
| Cover of II tree layer | 60 | 5.773 | 50 | 70 | 10 | 7.071 | 5 | 20 | 0.0000 |
| Cover of shrubs, % | 0.8 | 1.852 | 0.1 | 5 | 7.14 | 5.669 | 5 | 20 | 0.0125 |
| Cover of herbs, % | 1.47 | 2.41 | 0 | 5 | 30.71 | 10.965 | 10 | 40 | 0.0001 |
| Cover of mosses, % | 0 | 0 | 0 | 0 | 45.71 | 9.759 | 30 | 60 | 0.0000 |
| Soil org. layer O, cm | 4.25 | 1.368 | 2.6 | 6.6 | 8.08 | 1.018 | 6.9 | 9.6 | 0.0000 |
| Soil layer A, cm | 11.35 | 5.461 | 6.5 | 22.6 | 4.98 | 2.16 | 2.6 | 8.3 | 0.0106 |
| pHCaCl2 (min. soil: 0-10 cm) | 3.4 | 0.207 | 3.2 | 3.7 | 3.45 | 0.237 | 3.2 | 3.8 | 0.5000 |
The ANOVAs carried out on stand parameters, including mean volume and mean annual increment of the second tree layer, showed significant differences between pine stands with beech and those with spruce, and the mean volume and mean annual increment of the second tree layer was higher in pine stands with planted beech (Tab. 3). Mean volume and the mean annual increment of the first tree layer dominated by pine did not differ significantly between the two types of stand (Tab. 3).
Tab. 3 - Characteristics of stand parameters in Scots pine stands with beech (Pinus sylvestris - Fagus sylvatica) and spruce (Pinus sylvestris - Picea abies) as second layers. (SD): standard deviation; (Min): minimal value; (Max): maximal value; [p (F-test)]: significance value.
| Parameters | Pinus sylvestris - Fagus sylvatica | Pinus sylvestris - Picea abies | p (F-test) | ||||||
|---|---|---|---|---|---|---|---|---|---|
| Mean | SD | Min | Max | Mean | SD | Min | Max | ||
| Mean volume of I layer, m3 | 514.7 | 102.69 | 318 | 660 | 559.6 | 63.49 | 526 | 590 | 0.2936 |
| Mean volume of II layer, m3 | 252.4 | 35.51 | 192 | 291 | 72.8 | 13.49 | 53 | 98 | 0.0005 |
| Mean annual increment of I layer, m3 | 4.54 | 1.067 | 3.18 | 6.13 | 5.38 | 0.751 | 4.67 | 5.81 | 0.0869 |
| Mean annual increment of II layer, m3 | 4.01 | 0.721 | 3.15 | 5.2 | 1.45 | 0.269 | 1.28 | 1.76 | 0.0052 |
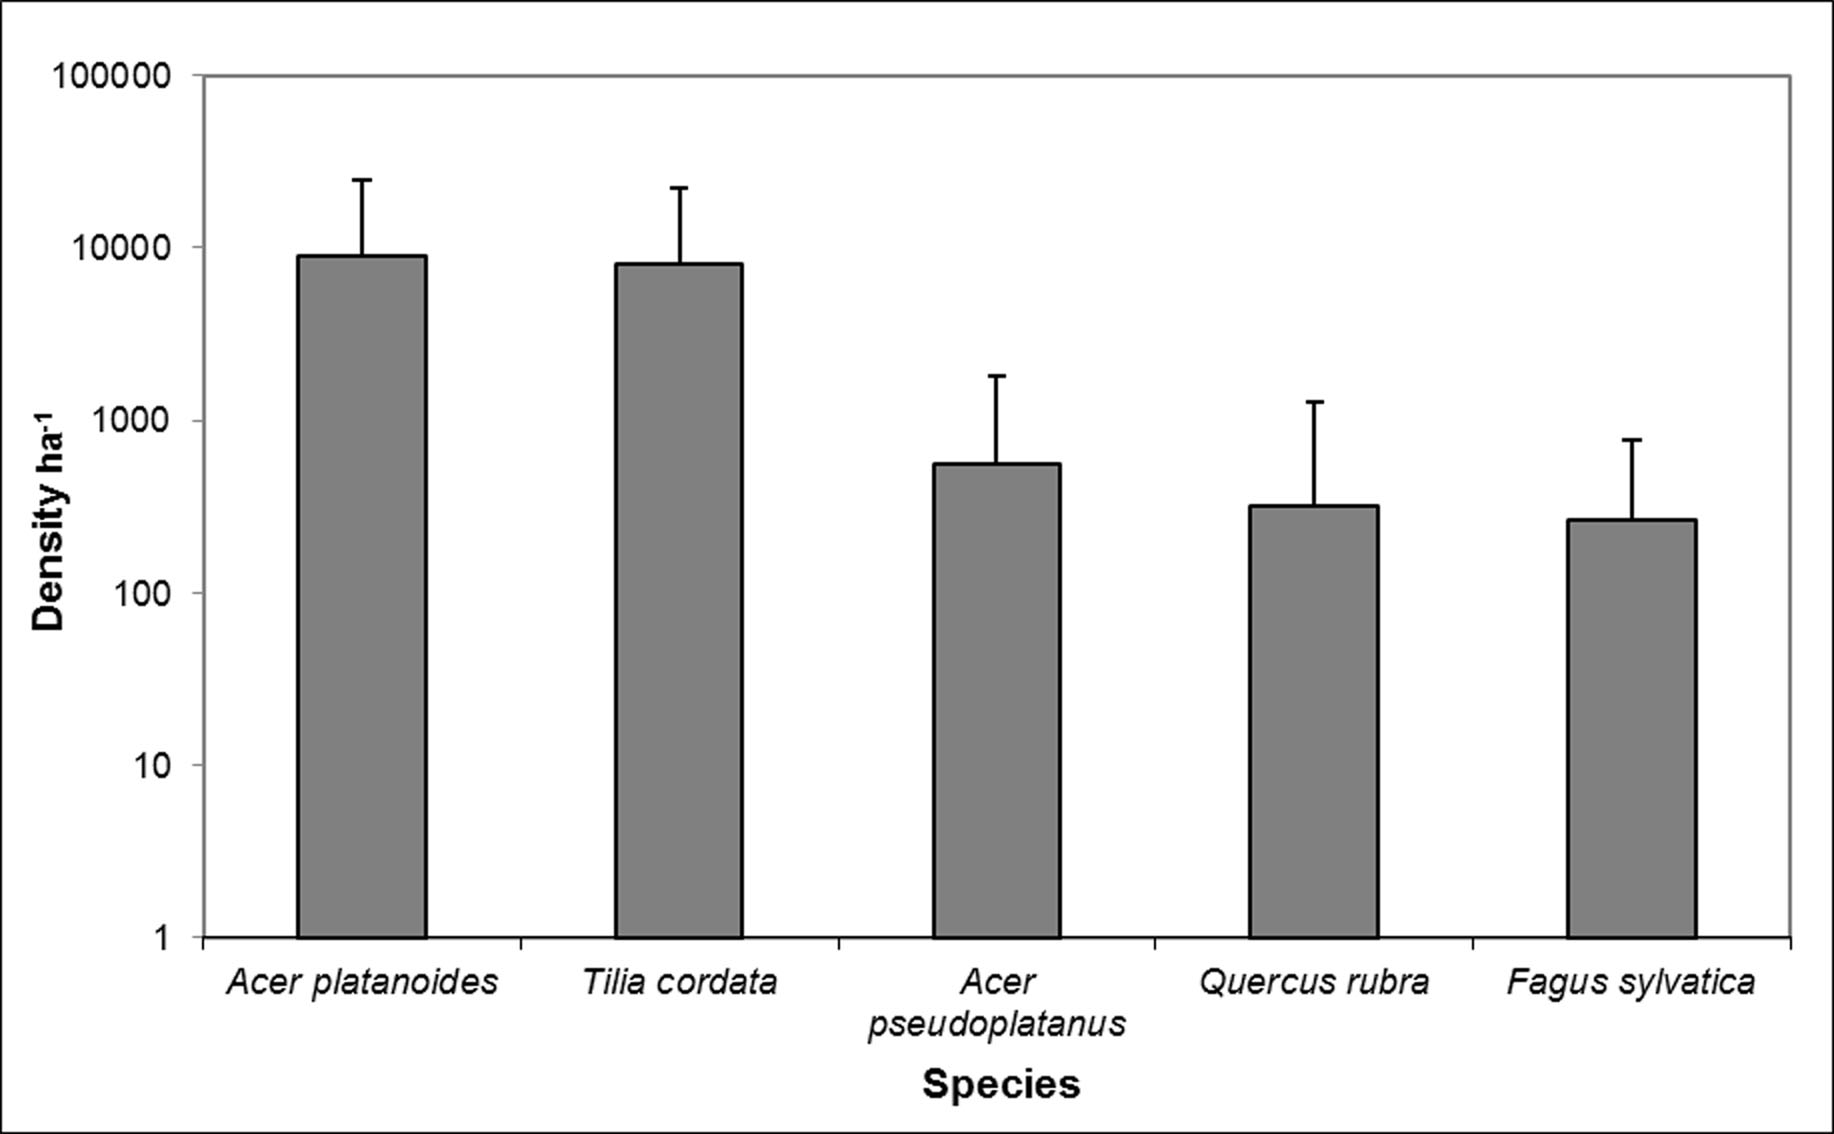
Results of the ANOVA carried out on light indexes clearly showed that ISF, DFS and GSFs were higher in pine stands with spruce as the second tree layer, and that the LAI was higher in pine stands with beech as the second tree layer (Tab. 4). Five tree sapling species in pine stands with European beech as the second tree layer were found. The mean density was highest for Acer platanoides and Tilia cordata saplings. Quercus rubra, Fagus sylvatica and Acer pseudoplatanus were also present in the stand, but their density was tenfold lower than the Acer platanoides and Tilia cordata saplings (Fig. 3). We found three tree sapling species (Picea abies, Quercus robur, Fagus sylvatica) in pine stands with spruce as the second tree layer.
Tab. 4 - Characteristics of light indices in Scots pine stands with beech (Pinus sylvestris - Fagus sylvatica) and spruce (Pinus sylvestris - Picea abies) as second layers. (SD): standard deviation; (Min): minimal value; (Max): maximal value; [p (F-test)]: significance value.
| Parameters | Pinus sylvestris - Fagus sylvatica | Pinus sylvestris - Picea abies | p (F-test) | ||||||
|---|---|---|---|---|---|---|---|---|---|
| Mean | SD | Min | Max | Mean | SD | Min | Max | ||
| Indirect site factor (ISF) | 0.091 | 0.0244 | 0.06 | 0.114 | 0.236 | 0.0226 | 0.19 | 0.256 | 0.0000 |
| Direct site factor (DSF) | 0.089 | 0.0302 | 0.05 | 0.124 | 0.134 | 0.0356 | 0.092 | 0.198 | 0.0260 |
| Global site factor (GSF) | 0.089 | 0.0282 | 0.05 | 0.123 | 2.395 | 0.1953 | 0.121 | 0.197 | 0.0013 |
| Leaf area index (LAI) | 2.977 | 0.3486 | 2.53 | 3.386 | 2.395 | 0.1953 | 2.17 | 2.759 | 0.0035 |
Fig. 3 - Density of saplings of different species in Scots pine stands with beech as secondary tree layer (mean ± standard deviation).
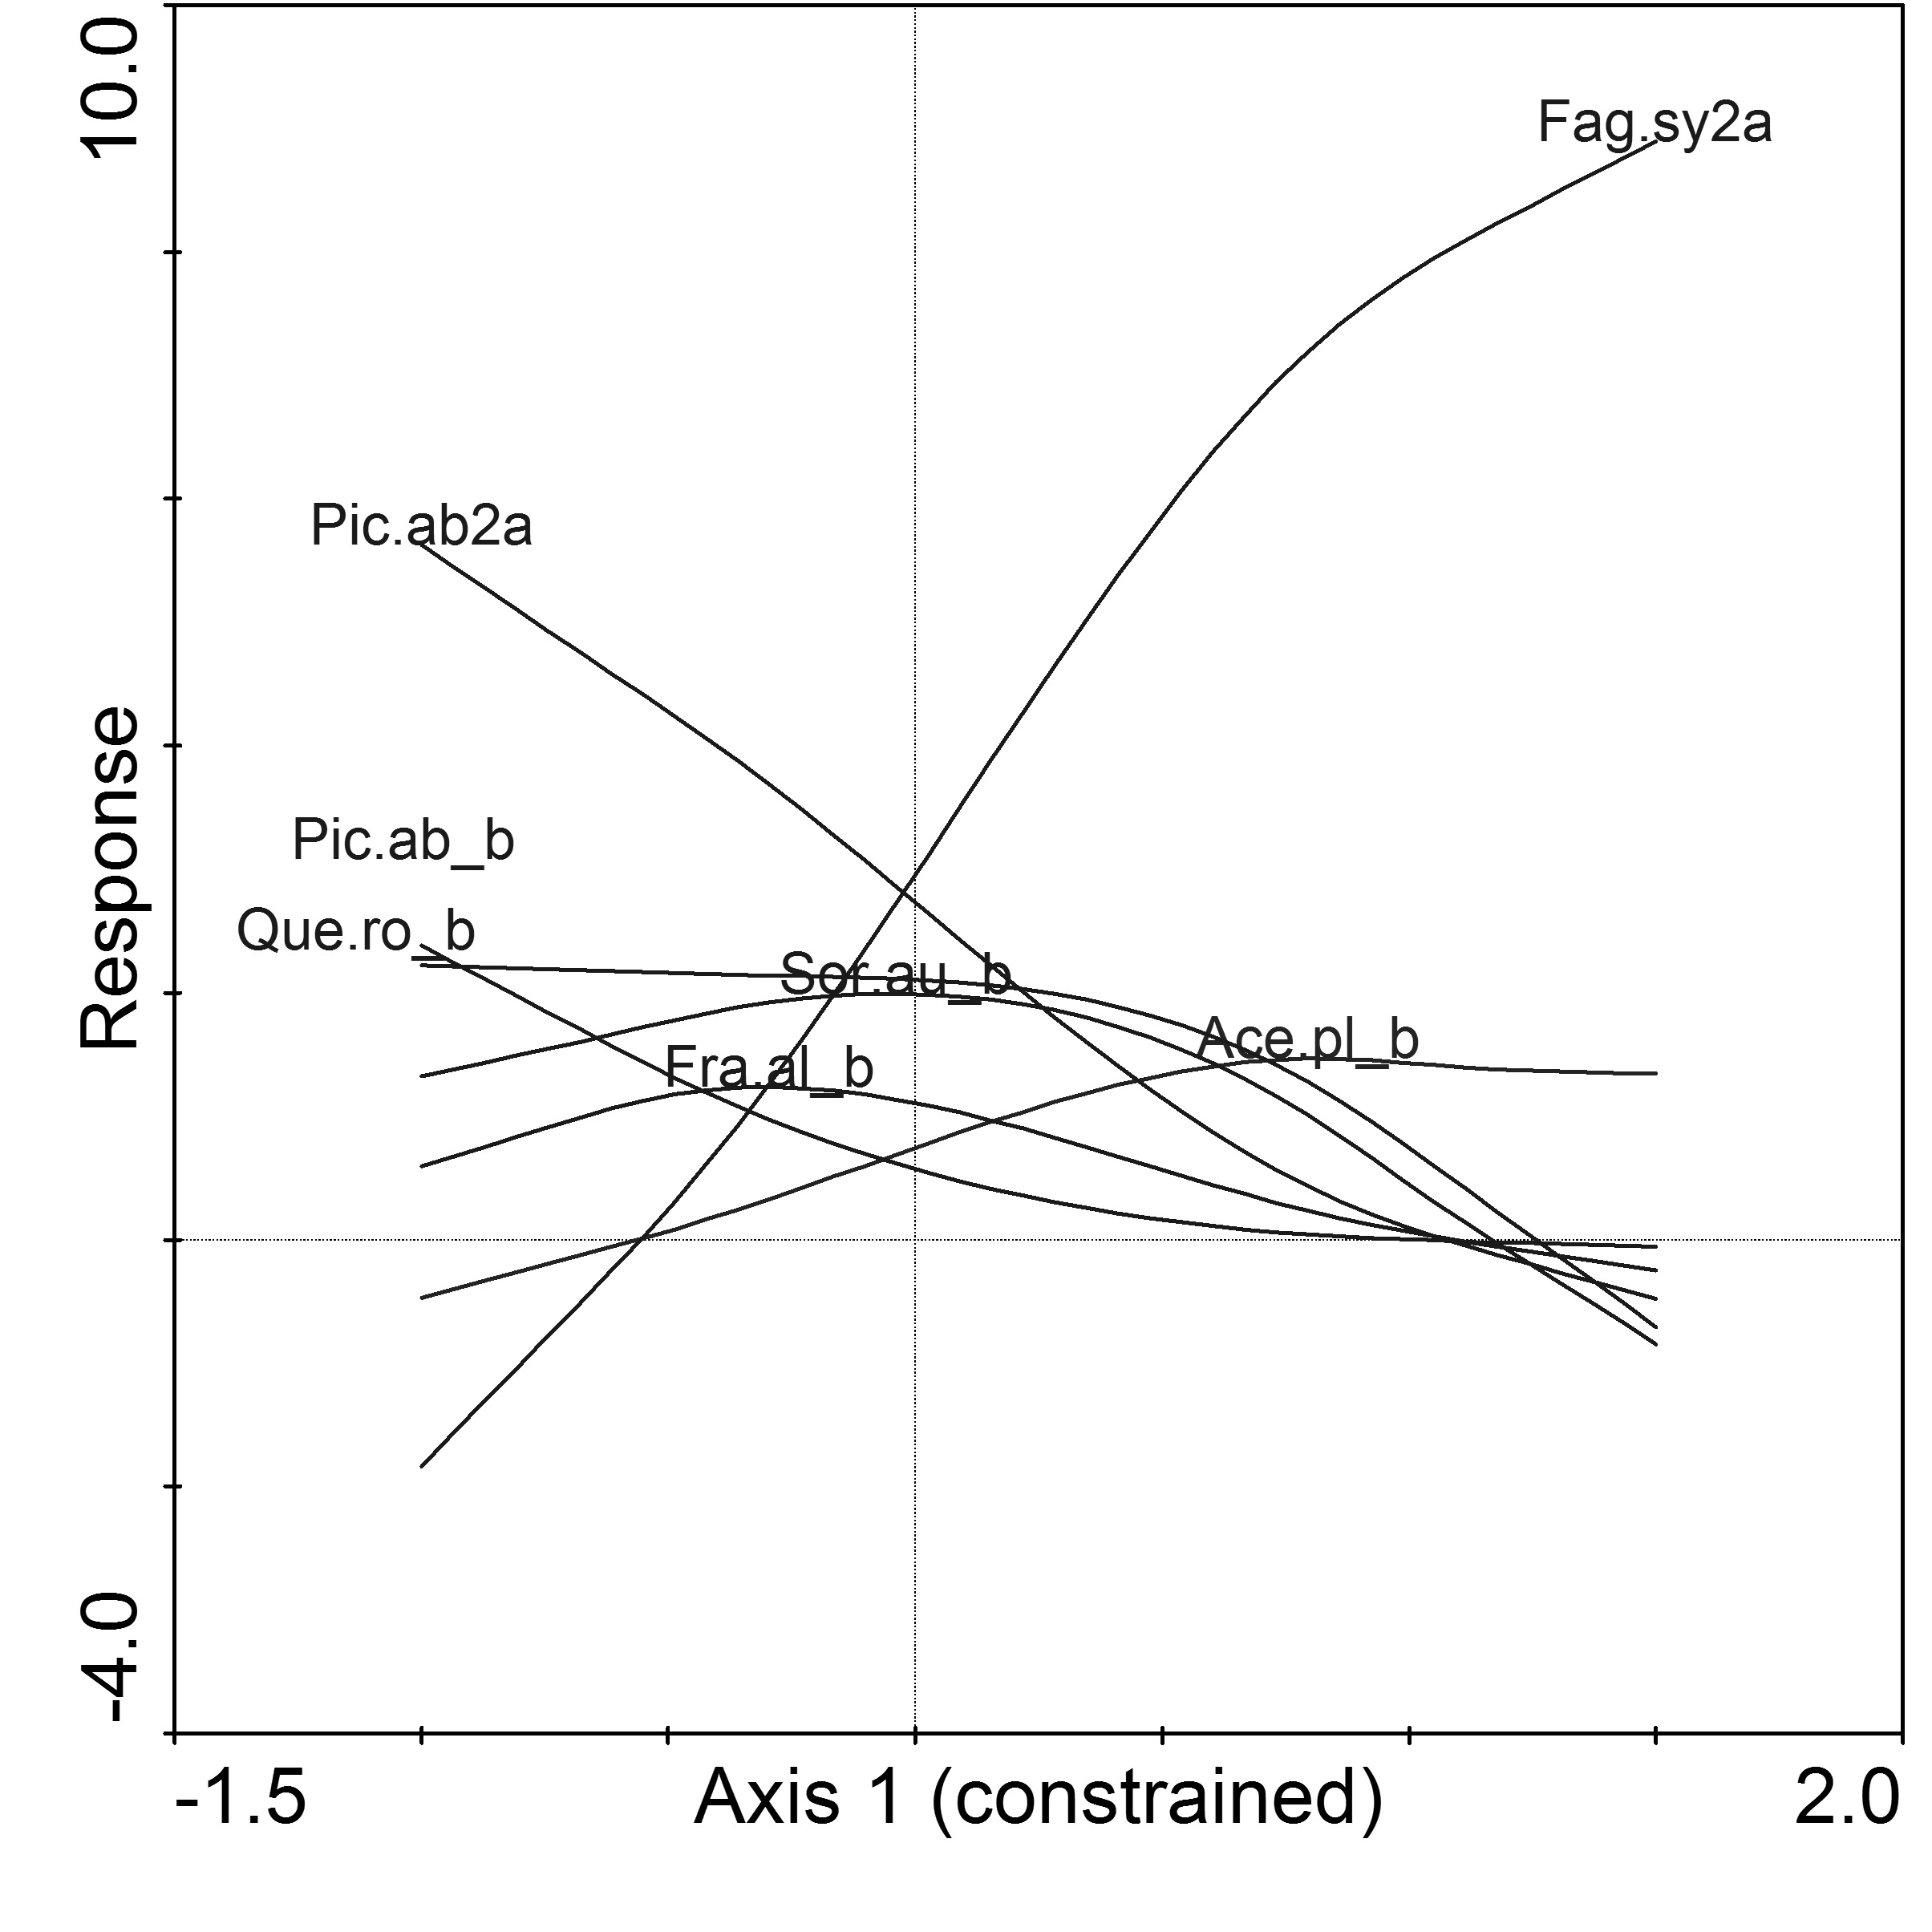
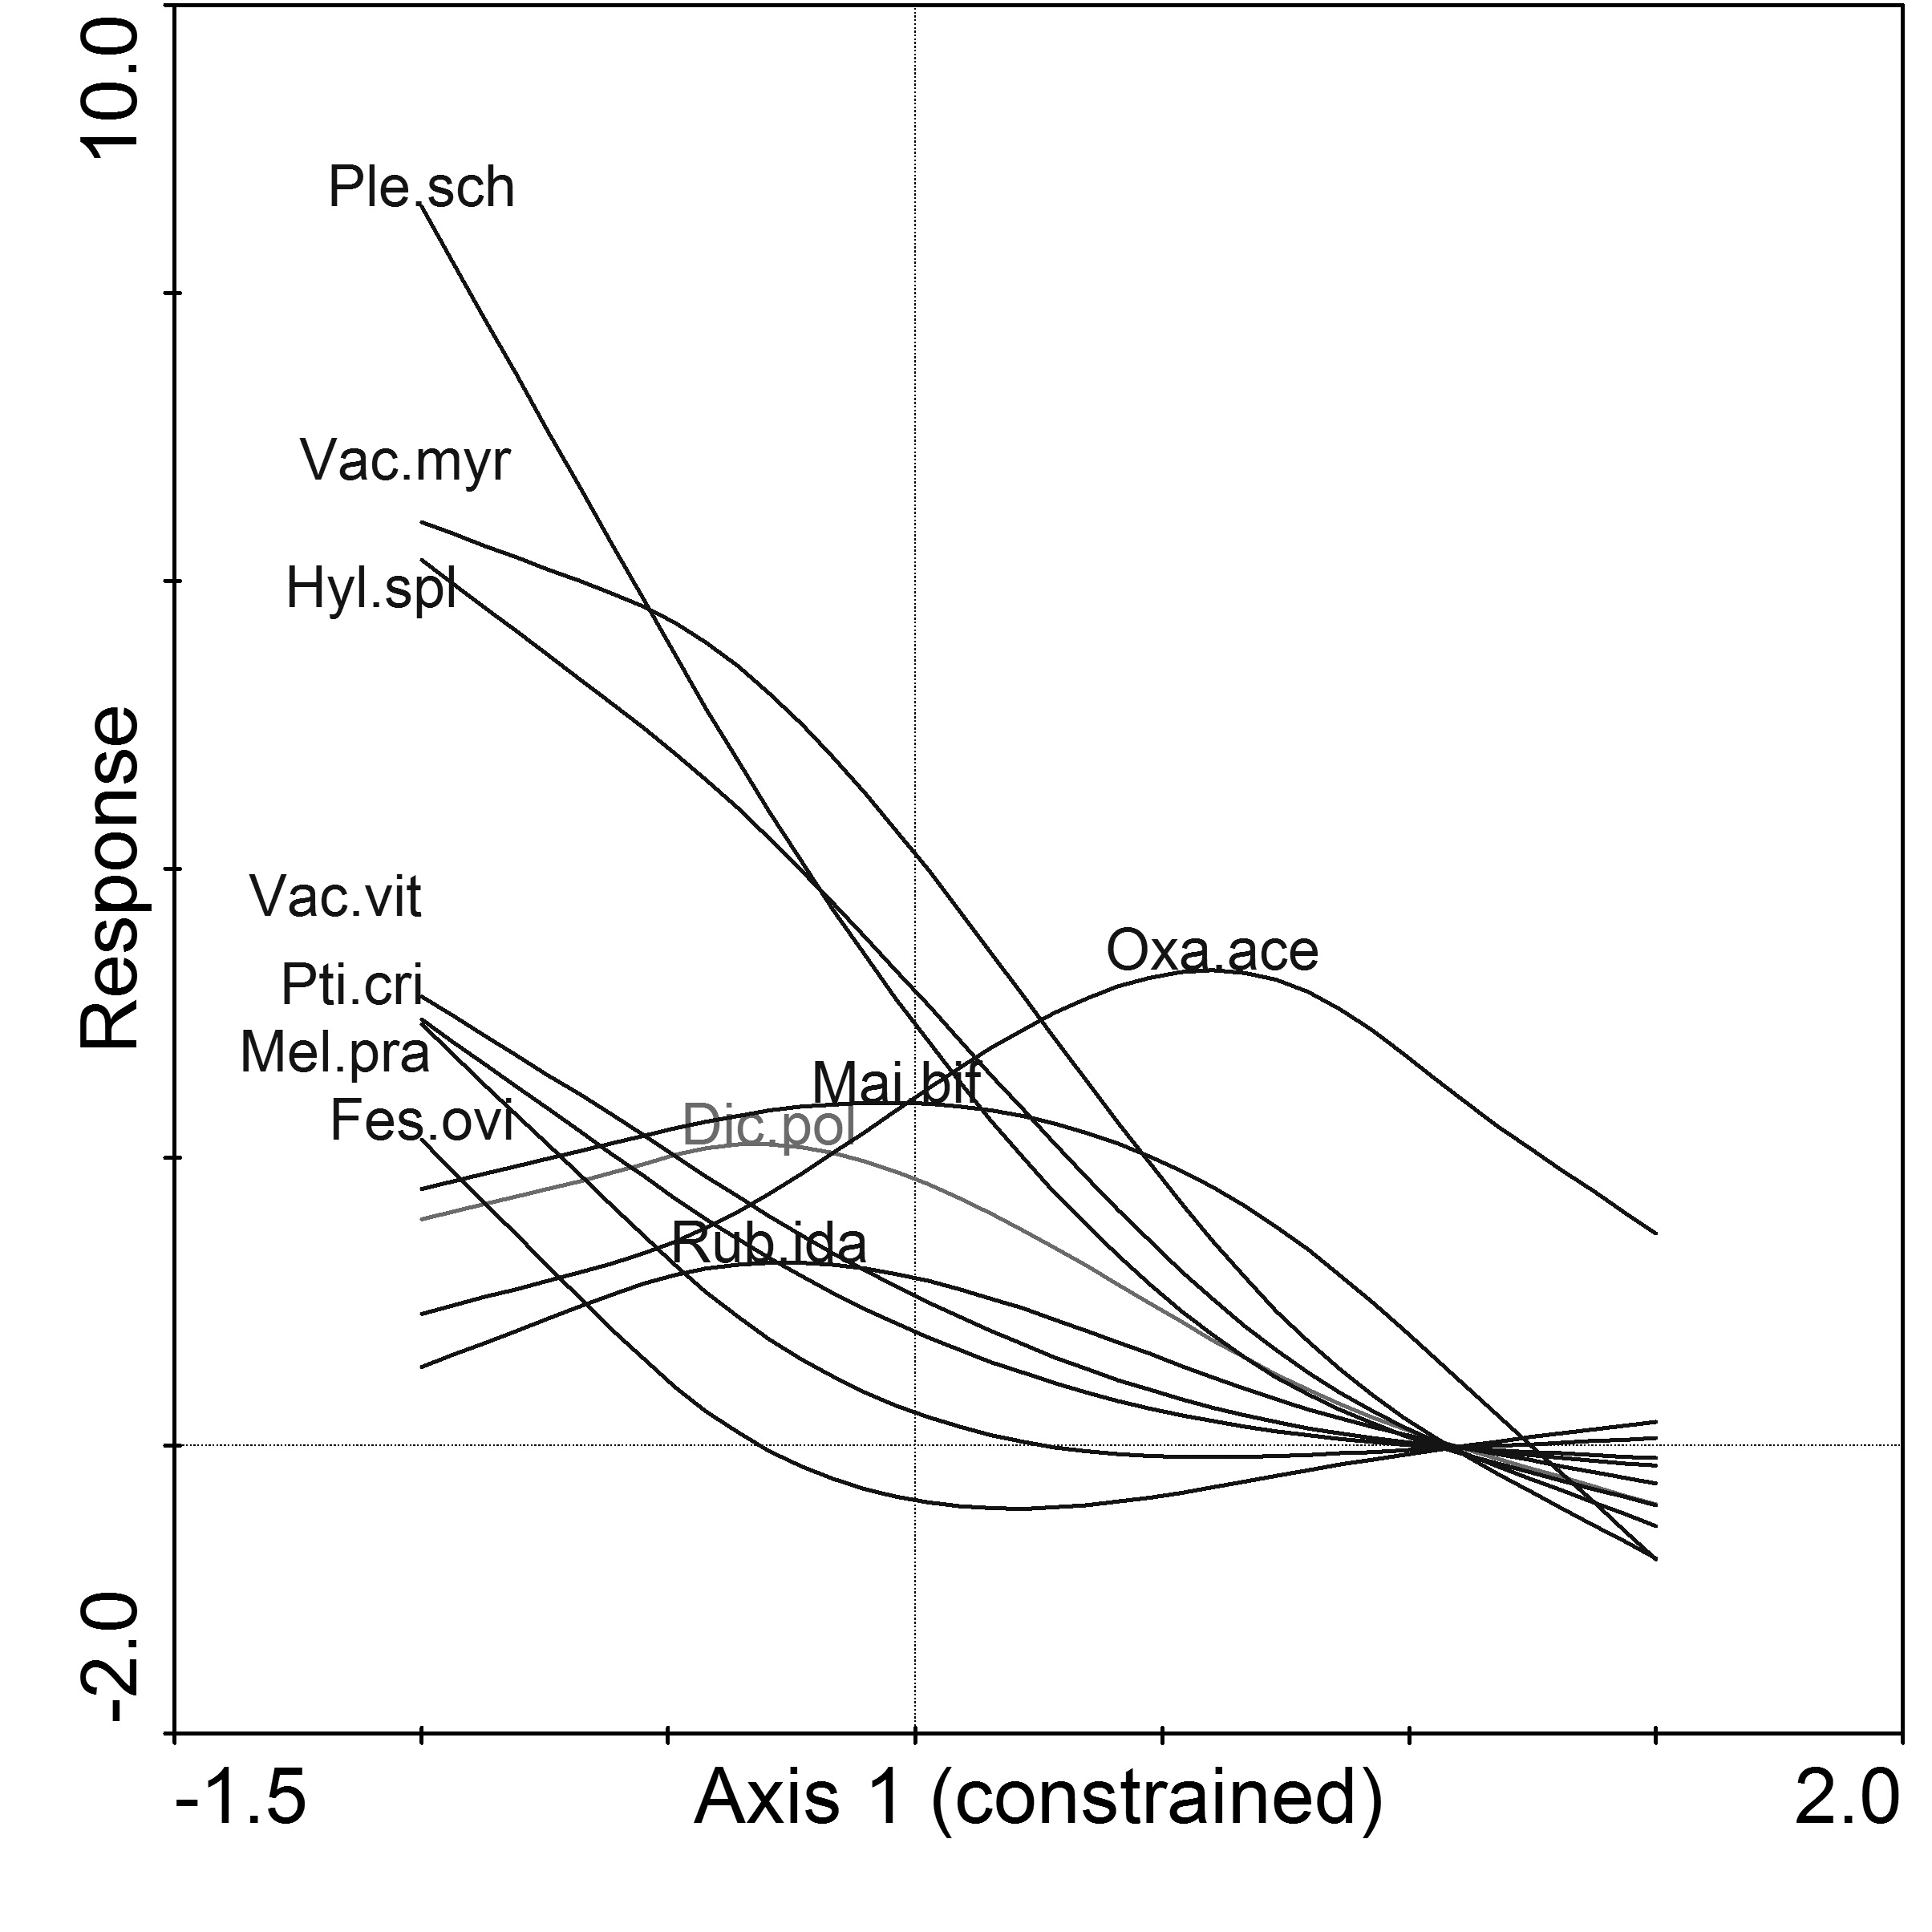
GAM of species responses according to the CCA Axis I showed that only Acer platanoides in the shrub layer is associated with beech as the second tree layer (Fig. 4). Almost all species in the herb and moss layers were associated with pine stands without beech as the second tree layer, except for Oxalis acetosella (Fig. 5).
Fig. 4 - Generalized additive modeling (GAM) of shrubs and saplings. (Ace.pl._b): Acer platanoides; (Fra.al_b): Frangula alnus; (Fag.sy2a): Fagus sylvatica II tree layer; (Pic.ab2a): Picea abies II tree layer; (Pic.ab_b): Picea abies; (Que.ro_b): Quercus robur; (Sor.au_b): Sorbus aucuparia.
Fig. 5 - Generalized additive modeling (GAM) of herb and moss species (Dic.pol): Dicranum polysetum; (Fes.ovi): Festuca ovina; (Hyl.spl): Hylocomium splendens; (Mai.bif): Maianthemum bifolium; (Mel.pra): Melampyrum pratense; (Oxa.ace): Oxalis acetosella; (Ple.sch): Pleurozium schreberi; (Pti.cri): Ptilium crista-castrensis; (Rub.ida): Rubus idaeus; (Vac.myr): Vaccinium myrtillus.
An examination of the understory herb and moss composition identified 14 species in Scots pine stands with beech as the second tree layer and 33 species in pine stands with spruce as the second tree layer. In stands with beech as the second tree layer, Acer platanoides, Acer peudoplatanus, Oxalis acetosella, Dryopteris filix-mas, and Dryopteris carthusiana were the most frequent species (Tab. 5). Moss species were totally absent in stands with beech as the second tree layer.
Tab. 5 - Frequency (%) of recorded species in Scots pine stands with either beech (P. sylvestris - F. sylvatica) or spruce (P. sylvestris - P. abies) as second layers. (a1): I tree layer; (a2): II tree layer; (b): shrub layer; (c): herb layer; (d): moss layer.
| Stand layer | Species | P. sylvestris - F. sylvatica | P. sylvestris - P. abies |
|---|---|---|---|
| a1 | Pinus sylvestris | 100 | 100 |
| a1 | Picea abies | 63 | 71 |
| a1 | Fagus sylvatica | 28 | 0 |
| a2 | Fagus sylvatica | 100 | 0 |
| a2 | Picea abies | 0 | 100 |
| a2 | Quercus robur | 14 | 28 |
| b | Fagus sylvatica | 100 | 14 |
| b | Acer platanoides | 71 | 0 |
| b | Acer pseudoplatanus | 28 | 0 |
| b | Quercus robur | 28 | 100 |
| b | Sorbus aucuparia | 14 | 85 |
| b | Corylus avellana | 0 | 42 |
| b | Frangula alnus | 0 | 57 |
| b | Lonicera xylosteum | 0 | 57 |
| b | Picea abies | 0 | 71 |
| c | Oxalis acetosella | 71 | 57 |
| c | Dryopteris filix-mas | 71 | 28 |
| c | Drypteris carthusiana | 71 | 57 |
| c | Maianthemum bifolium | 28 | 100 |
| c | Paris quadrifolia | 28 | 28 |
| c | Fragaria vesca | 14 | 14 |
| c | Vaccinium myrtillus | 0 | 100 |
| c | Vaccinium vitis-idaea | 0 | 85 |
| c | Melampyrum pratense | 0 | 71 |
| c | Rubus idaeus | 0 | 57 |
| c | Luzula pilosa | 0 | 42 |
| c | Calamagrostis arundinacea | 0 | 42 |
| c | Trientalis europaea | 0 | 42 |
| c | Festuca ovina | 0 | 28 |
| c | Convallaria majalis | 0 | 14 |
| c | Deschampsia flexuosa | 0 | 14 |
| c | Melica nutans | 0 | 14 |
| c | Mycelis muralis | 0 | 14 |
| d | Dicranum polysetum | 0 | 71 |
| d | Hylocomium splendens | 0 | 100 |
| d | Pleurozium schreberi | 0 | 100 |
| d | Ptilium crista-castrensis | 0 | 71 |
| d | Polytrichum formosum | 0 | 14 |
Discussion
Our data indicates that European beech planted under a Scots pine overstory reduces the understory vegetation cover and species diversity. Such changes could be caused by reduced light conditions, physical litter features or other related factors. It is generally thought that a conifer overstory allows for less understory diversity than does a deciduous tree overstory ([40], [28]). Barbier et al. ([4]) stated that the assumption that a conifer overstory will always lead to lower species diversity may not be correct, and concluded that it is very difficult to generalize about the effects of tree species on understory diversity. Among deciduous species, beech stands have the lower vascular species diversity ([9], [41]), while species such as pine and larch appear to promote understory species diversity ([4]). Mixed stands have been assumed to have a more species-rich flora than pure stands because they increase resource diversity ([23]).
Coniferous species also promote bryophyte species richness ([15]). Previous studies have shown that, in European beech and Norway spruce stands, the relative abundance of spruce had a positive effect on bryophyte richness ([15]). Conversely, in another study on hornbeam in oak forests ([31]), an abundant second tree layer was found to have a negative effect on herbaceous species richness. Our results showed that pine stands with beech as second layer had lower diversity of ground vegetation.
Light plays an important role in forest growth ([30], [27], [4]). Understory species vary in their optimal light requirements and canopy transmittance, depending on properties of the overstory tree species, which can be approximated from variables such as canopy closure or the leaf area index (LAI). Few studies have evaluated light conditions using different light-related ecological groups. Augusto et al. ([3]) found that understory vegetation in Scots pine stands had higher Ellenberg’s indicator values for light than understory vegetation in oak or spruce species’ stands. Using ecological groups, Lücke & Schmidt ([34]) showed that understory vegetation was more light-demanding in spruce and mixed spruce beech stands than in pure beech stands.
Other factors, such as soil, water and nutrients, have significant effects on the relationship between overstory and understory diversity ([5], [39]). The requirements for soil minerals and acidity/alkalinity differ among species ([12]). It is generally accepted that conifers produce a more acidic topsoil than deciduous plants, but this generalization is sometimes incorrect. Among deciduous species, beech produces more acidic topsoils than other hardwoods ([37], [20]). In this study, soil pH did not differ significantly between a pine forest with beech as the second tree layer and a pine forest with spruce as the second tree layer. Aubert et al. ([1]) also found a more acidic topsoil under pure beech than under a mixture of beech and hornbeam, and the acidity correlated with the higher number of acidophilous species under the pure beech stands.
Bryophytes and herbaceous species often do not have the same responses to soil modifications. Some authors consider acidic soil conditions to be favorable to bryophytes ([21]), especially to their ability to cover the forest floor ([15]).
Forest floor litter also has physical effects on understory vegetation ([16], [13]). Generally, a thicker litter layer is found under conifers than under deciduous trees. Bryophyte species are more sensitive to the physical effects of litter than vascular species ([22]). Ewald ([15]) suggested that the higher abundance of mosses under spruce than under deciduous trees was a consequence of their ability to creep along the abundant litter without making contact with the mineral soil layer; however, the slow growth rate of bryophytes under the relatively large leaves of deciduous trees makes them sensitive to the degree of cover.
Conclusions
The main results of the investigation carried out may be summarized as follows:
- Species diversity in pine stands with planted beech as the second tree layer was lower than in pine stands with spruce as the second layer. The cover of shrub, herbs and mosses layers was significantly lower, the soil humus (A) layer was thicker, and the organic (O) soil layer was thinner in pine stands with beech as the second tree layer.
- Stand parameters such as mean volume and mean annual increment of the second tree layer were significantly higher in pine stands with planted beech second tree layers than in pine stand with a spruce second tree layer. Mean volume and mean annual increment of first tree layer (dominated by Scots pine) did not differ significantly between stands with planted beech and natural spruce understory.
- Beech under a pine overstory had negative effects on understory species richness and abundance. This was most likely due to differences in light transmittance and in the physical properties of the litter under beech trees.
The above results should be taken into consideration by forest managers, especially when managing forests in protected areas.
Acknowledgments
This research was funded by a grant (no. LEK-19/2010) from the Research Council of Lithuania. We are thankful to the two anonymous referees for their valuable comments.
References
Gscholar
Gscholar
Gscholar
Gscholar
Gscholar
Gscholar
Gscholar
Gscholar
Gscholar
Gscholar
Gscholar
Gscholar
Gscholar
Gscholar
Gscholar
Gscholar
Gscholar
Gscholar
Gscholar
Gscholar
Authors’ Info
Authors’ Affiliation
Algirdas Augustaitis
Almantas Kliucius
Mantas Pilkauskas
Faculty of Forestry and Ecology, Aleksandras Stulginskis University, Studentu 11, Akademija, LT-53361 Kaunas distr. (Lithuania)
Institute of Forestry, Lithuanian Research Centre for Agriculture and Forestry (LRCAF), Liepu 1, Girionys, LT-53101 Kaunas distr. (Lithuania)
Corresponding author
Paper Info
Citation
Marozas V, Augustaitis A, Armolaitis K, Kliucius A, Pilkauskas M (2014). Effects of planted European beech on the understory in Scots pine forests of Lithuania. iForest 7: 12-18. - doi: 10.3832/ifor0695-007
Academic Editor
Renzo Motta
Paper history
Received: Jul 20, 2012
Accepted: May 17, 2013
First online: Oct 07, 2013
Publication Date: Feb 03, 2014
Publication Time: 4.77 months
Copyright Information
© SISEF - The Italian Society of Silviculture and Forest Ecology 2014
Open Access
This article is distributed under the terms of the Creative Commons Attribution-Non Commercial 4.0 International (https://creativecommons.org/licenses/by-nc/4.0/), which permits unrestricted use, distribution, and reproduction in any medium, provided you give appropriate credit to the original author(s) and the source, provide a link to the Creative Commons license, and indicate if changes were made.
Web Metrics
Breakdown by View Type
Article Usage
Total Article Views: 54339
(from publication date up to now)
Breakdown by View Type
HTML Page Views: 45252
Abstract Page Views: 2778
PDF Downloads: 4593
Citation/Reference Downloads: 20
XML Downloads: 1696
Web Metrics
Days since publication: 4499
Overall contacts: 54339
Avg. contacts per week: 84.55
Article Citations
Article citations are based on data periodically collected from the Clarivate Web of Science web site
(last update: Mar 2025)
Total number of cites (since 2014): 7
Average cites per year: 0.54
Publication Metrics
by Dimensions ©
Articles citing this article
List of the papers citing this article based on CrossRef Cited-by.
Related Contents
iForest Similar Articles
Research Articles
Effect of plant species on P cycle-related microorganisms associated with litter decomposition and P soil availability: implications for agroforestry management
vol. 9, pp. 294-302 (online: 05 October 2015)
Research Articles
Soil fauna communities and microbial activities response to litter and soil properties under degraded and restored forests of Hyrcania
vol. 14, pp. 490-498 (online: 11 November 2021)
Research Articles
Forest litter as the mulch improving growth and ectomycorrhizal diversity of bare-root Scots pine (Pinus sylvestris) seedlings
vol. 8, pp. 394-400 (online: 20 August 2014)
Research Articles
The manipulation of aboveground litter input affects soil CO2 efflux in a subtropical liquidambar forest in China
vol. 12, pp. 181-186 (online: 10 April 2019)
Short Communications
Biodiversity and ecosystem functioning: exploring large-scale patterns in mainland China
vol. 5, pp. 230-234 (online: 02 October 2012)
Research Articles
Patterns of genetic diversity in European beech (Fagus sylvatica L.) at the eastern margins of its distribution range
vol. 10, pp. 916-922 (online: 10 December 2017)
Research Articles
Assessment of hedge stand types as determinants of woody species richness in rural field margins
vol. 6, pp. 201-208 (online: 27 May 2013)
Research Articles
The effect of clear-cut age on soil organic carbon and nitrogen indices in Scots pine (Pinus sylvestris L.) stands
vol. 18, pp. 146-153 (online: 09 June 2025)
Research Articles
Influences of mature Pinus nigra plantations on the floristic-vegetational composition along an altitudinal gradient in the central Apennines, Italy
vol. 13, pp. 279-285 (online: 03 July 2020)
Research Articles
Investigating the effect of selective logging on tree biodiversity and structure of the tropical forests of Papua New Guinea
vol. 9, pp. 475-482 (online: 25 January 2016)
iForest Database Search
Search By Author
Search By Keyword
Google Scholar Search
Citing Articles
Search By Author
Search By Keywords
PubMed Search
Search By Author
Search By Keyword

