Web GIS-based simulation of water fluxes in the Miyun catchment area
iForest - Biogeosciences and Forestry, Volume 7, Issue 6, Pages 363-371 (2014)
doi: https://doi.org/10.3832/ifor1169-007
Published: May 19, 2014 - Copyright © 2014 SISEF
Research Articles
Collection/Special Issue: RegioResources21
Spatial information and participation of socio-ecological systems: experiences, tools and lessons learned for land-use planning
Guest Editors: Daniele La Rosa, Carsten Lorz, Hannes Jochen König, Christine Fürst
Abstract
Change of land use and agricultural management, combined with severe droughts during the last two decades, are the main reasons for a strong decrease of water quality and quantity in the Miyun reservoir (China). Due to semi-arid monsoon climate, episodic water fluxes have to be considered adequately in an integrated water resources management in the total catchment area. To get insight into runoff generation processes, sediment and nutrient source areas and transfer dynamics, a monitoring approach was established in the Miyun catchment area spanning from plot measurements with weighable gravitation lysimeters and in situ measurements to a subcatchment scale of approx. 10 km2. One of these subcatchments (Sheyuchuan) was selected to adapt the methodologies to the regional runoff pattern using the web GIS-based modeling tool STOFFBILANZ. Calibration of the daily runoff modeling is based on the lysimeter observations from Shixia station and runoff observations in Sheyuchuan subcatchment for the reference year 2011. Despite the fact that the climatic water balance in the region is negative, the precipitation event on 24 July 2011 with a rainfall of 107 mm caused a significant leachate at the lysimeter. The daily modeling for the lysimeter core by the FAO-ETc-adj approach showed a similar deep percolation and a similar distribution of evapotranspiration for the year considered. In the next step, the calibrated model was applied to the subcatchment Sheyuchuan to compare the results of direct runoff and groundwater runoff (deep percolation) with the runoff observations at the weir. Deep percolation was extremely small (1.7 mm yr-1), and direct runoff was 26.9 mm yr-1 in 2011. In comparison to the monitoring results at the weir, a disagreement in the quantity of runoff was found between the observation on the one hand and the simulation on the other hand, which can be explained by water storage in reservoirs for irrigation purposes. Additionally, the water fluxes in the total catchment area were simulated at meso-scale, obtaining a good correlation with observed values.
Keywords
Bottom-up, Direct Runoff, Lysimeter, Meso Scale, Miyun, Model, Percolation
Introduction
Miyun reservoir, located approximately 100 km northeast of the Beijing municipality, is one of the most important surface water supply sources for the 20 million people living in the metropolitan area. Change of land use and agricultural management during the last decades are the main reasons for the strong increase in sediment, nitrogen, and phosphorus input into the reservoir, causing water quality problems ([22], [21]). Long-term droughts, sediment delivery through debris flows as well as fish pond economy and tourism are additional stressors for water quality and quantity ([22], [23], [26], [2], [13]).
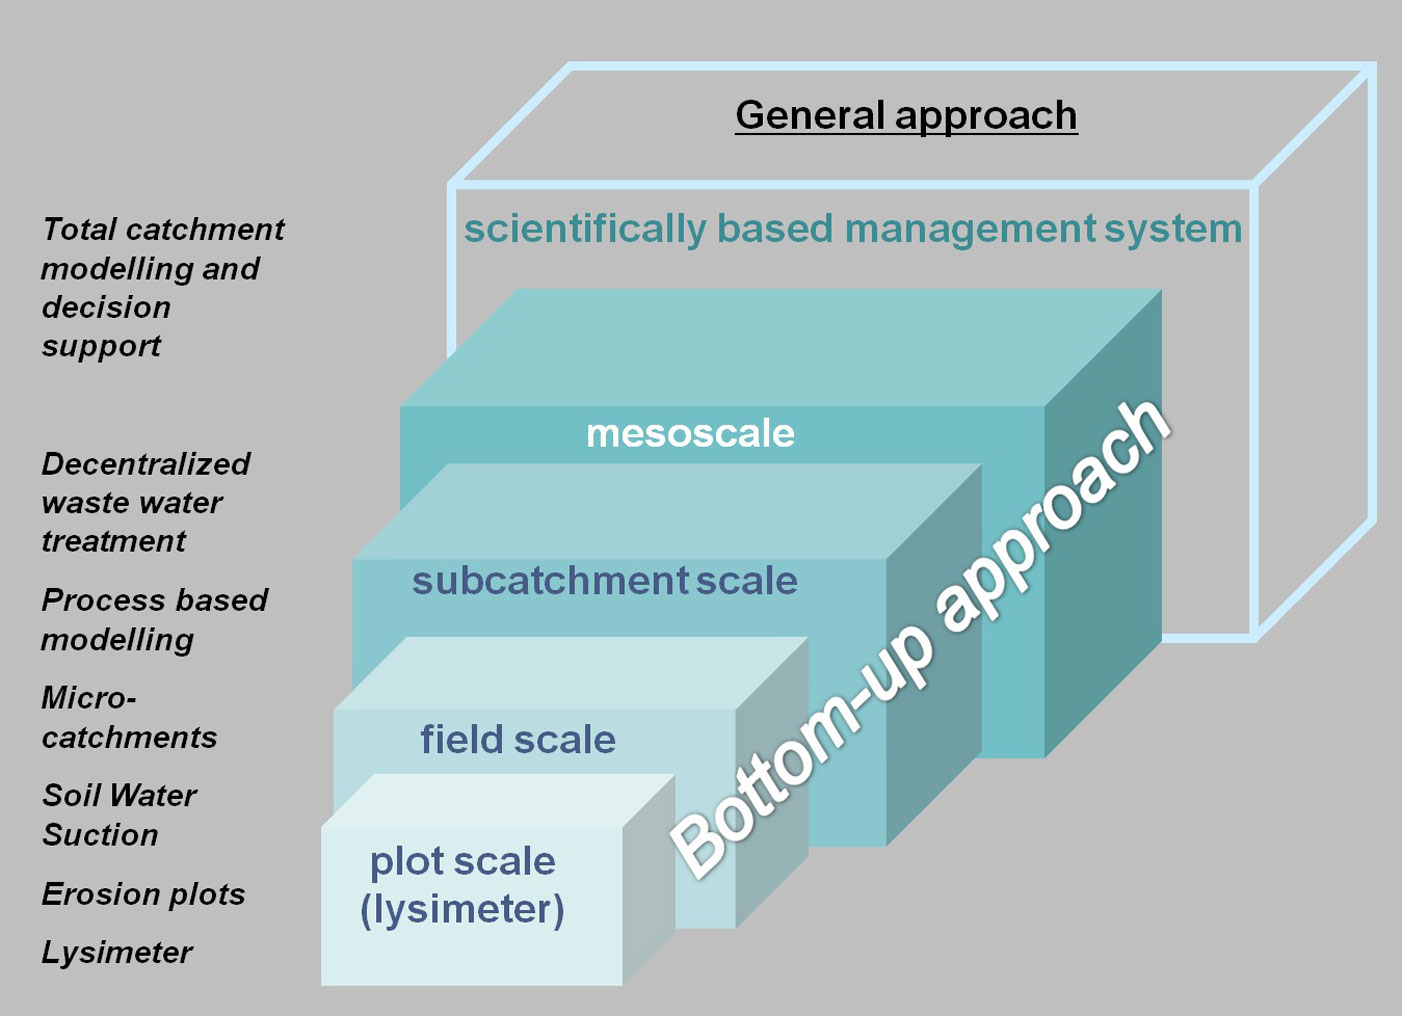
Mitigation options to reduce nitrogen and phosphorus pollution have to be strongly promoted on both, local and regional scale. To fulfill these requirements in the framework of the IWRM project “Development and implementation of a scientifically based management system for non-point source pollution control in the Miyun basin”, a scaled monitoring approach was installed to get insight into runoff generation processes and sediment and nutrient transfer dynamics, accomplished by a process-based modeling with the WaSim-ETH/IWAN approach ([19]) in small subcatchments ([16], [15]). Web GIS-based software STOFFBILANZ was used to simulate the runoff ([1], [18]), sediment ([11]), and the nutrient input in the whole catchment area (approx. 15654 km²) for the current situation, as well as to check the effectiveness of mitigation options. Decision support will be ensured by different simulations considering a selection of mitigation options in order to optimize future management in the catchment area. Point sources and pathways of waste-water were analyzed by an additional partner from the University of Rostock ([12]).
The objective of this paper are: (i) the calibration of our simulation of water fluxes at the plot scale (lysimeter); (ii) the testing of our modeling at subcatchment scale (Sheyuchuan); and (iii) the transfer of our approach to the meso-scale Miyun catchment area.
Study area and data
Total catchment area
The area of the Miyun catchment with a total extent of approx. 15 654 km² is part of the provinces Beijing and Hebei, bordering the Mongolian Plateau in the northern parts of China.
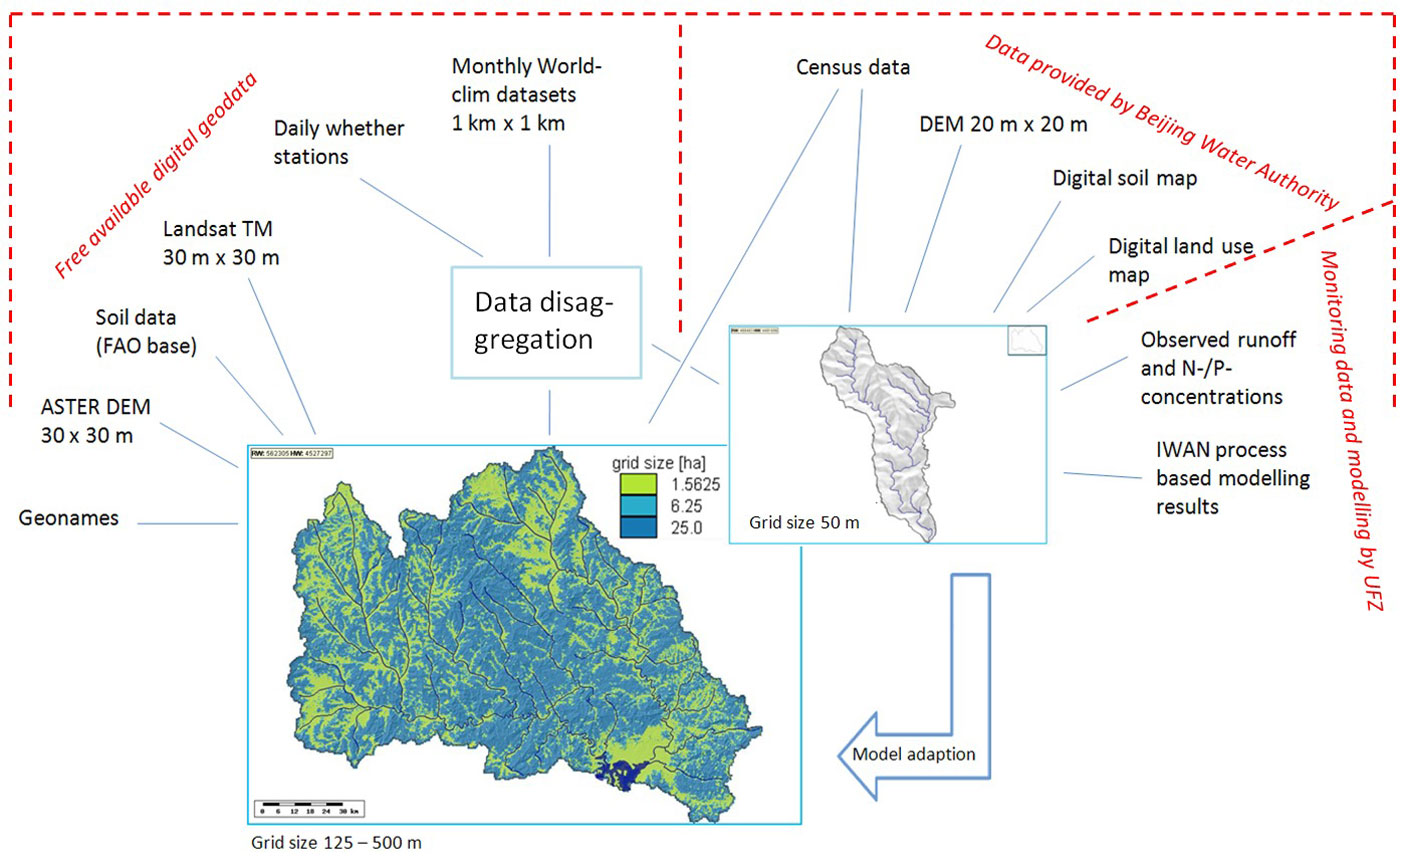
Due to limitations of data availability, free available spatial data (30 x 30 m ASTER DEM, 30 x 30 m Landsat TM, Harmonized World Soil Database ([6]) combined with a digital soil mapping procedure, were used to get information about the basic landscape pattern. Necessary daily meteorological and atmospheric data were disaggregated from mean monthly WorldClim datasets ([27] - Global climate data, 1000 x 1000 m) combined with daily information from selected weather stations for one particular year (2009). These data were integrated into a grid with variable cell size (125 x 125 m up to 500 x 500 m; approx. 366 000 grid cells) by using a QUADTREE procedure (Fig. 1). Cropland as well as residential areas got the highest resolution in order to optimize the indication of critical source areas.
Fig. 1 - Data sources for the meso-scale modeling approach in total Miyun catchment and subcatchment Sheyuchuan.
The major part of the Miyun catchment area is mountainous with steep inclinations with elevation ranging from 60 to 2200 m a.s.l. Annual average precipitation in the sub-humid continental monsoon climate is lower than 500 mm yr-1 and occurs mainly in summer, whereas winter and spring are extremely dry ([3]). Precipitation increases from east to west, annual average temperature increases from south-east to north-west, ranging from 6.3 to 10.9 °C. Land cover is dominated by rocky mountain forest (54.8%) with a smooth transition to shrubbery, heath and dry grassland (31.5%). Cropland (10.7%) can be found mainly in the valleys and intra-mountainous basins (Fig. 2), carrying fertile soils in Quaternary sediments (e.g., loess), but also on the dry bottoms of the Miyun reservoir with its continually decreasing water surface, caused by droughts in the last twenty years.
Fig. 2 - Land use in the total catchment area.
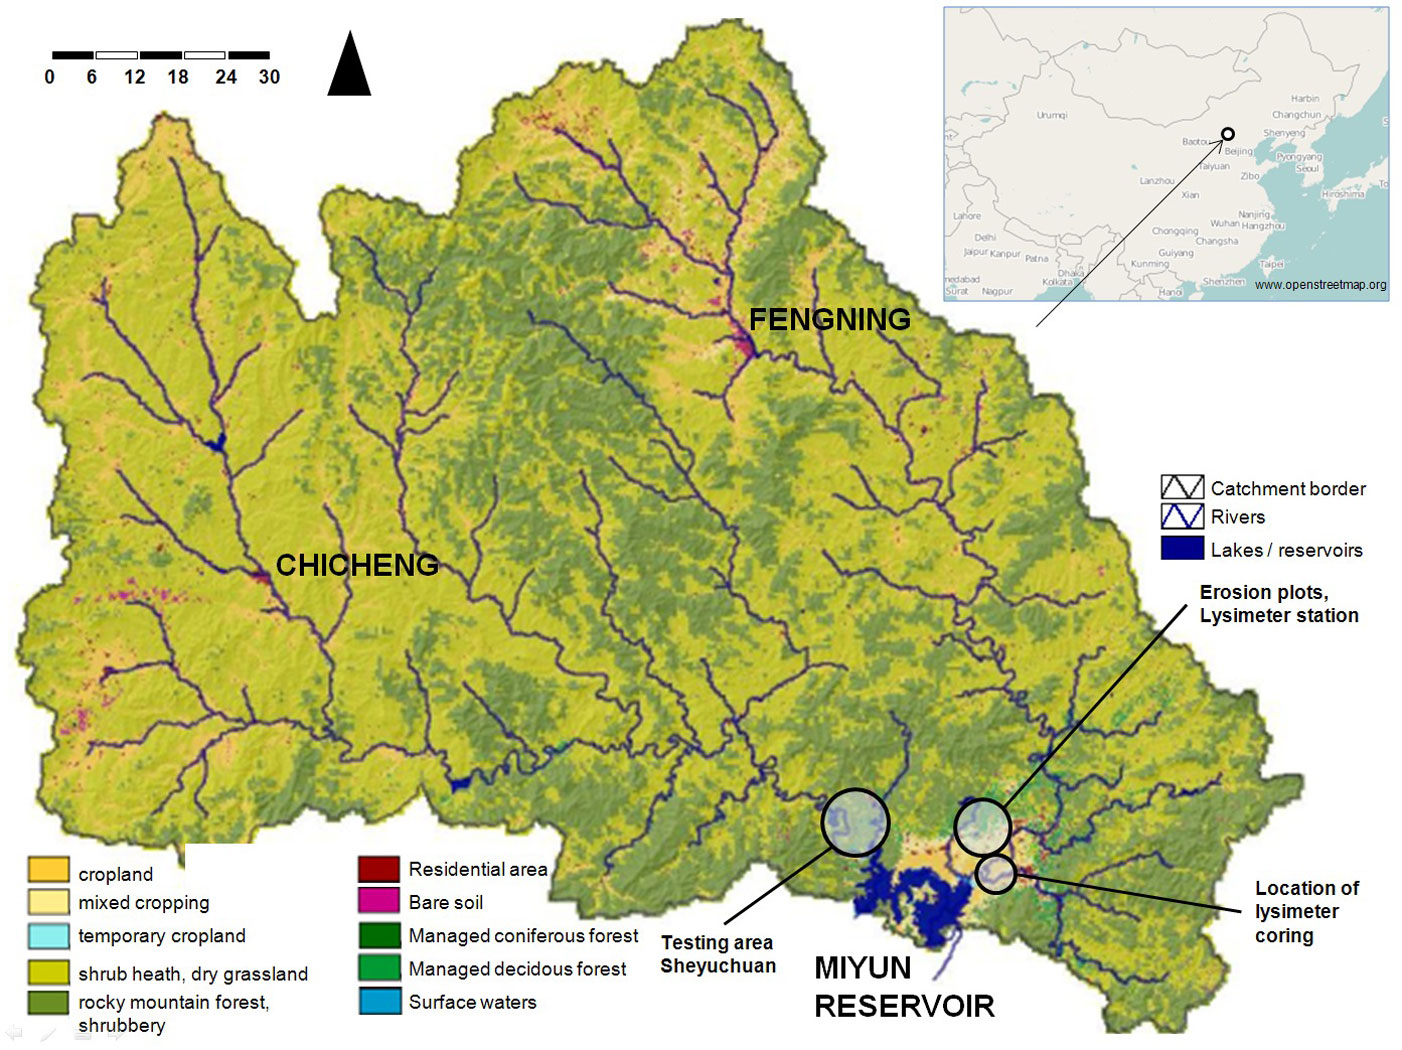
According to Zhou et al. ([29]) cropland in the counties Chicheng, Fengning and Luanping (reference year 2005) is about 8.1%, which is close to the 9.2% value obtained for the same region by processing the remote sensing in the study area. Residential areas have a share of 1%. Economic deciduous and coniferous forests have a share of approx. 1%. Bare soils and wasteland (mining areas) are about 0.1%, surface waters are about 0.5%. Parameters of agricultural management, livestock density and population density were taken from the China Statistical Yearbooks ([4], [5]). Census data were provided by the Chinese authorities, aggregated to the township level for both provinces Beijing and Hebei. Recently, major planted crop is corn (64% in Miyun County), followed by orchards (25% in Miyun County).
According to the typology of the Harmonized World Soil Database ([6]) there is a mixture of Fluvisols, Luvisols, Cambisols and Kastanozems/Greysems in flat or hilly areas, whereas the mountainous area is mainly covered by Leptosols. The soil information is based on the FAO soil map, combined with a terrain analyses to exclude natural vegetation areas, which are not significantly represented in the FAO map. Our experiences from the field trip showed that these areas are mainly covered by Leptosols.
Subcatchment Sheyuchuan
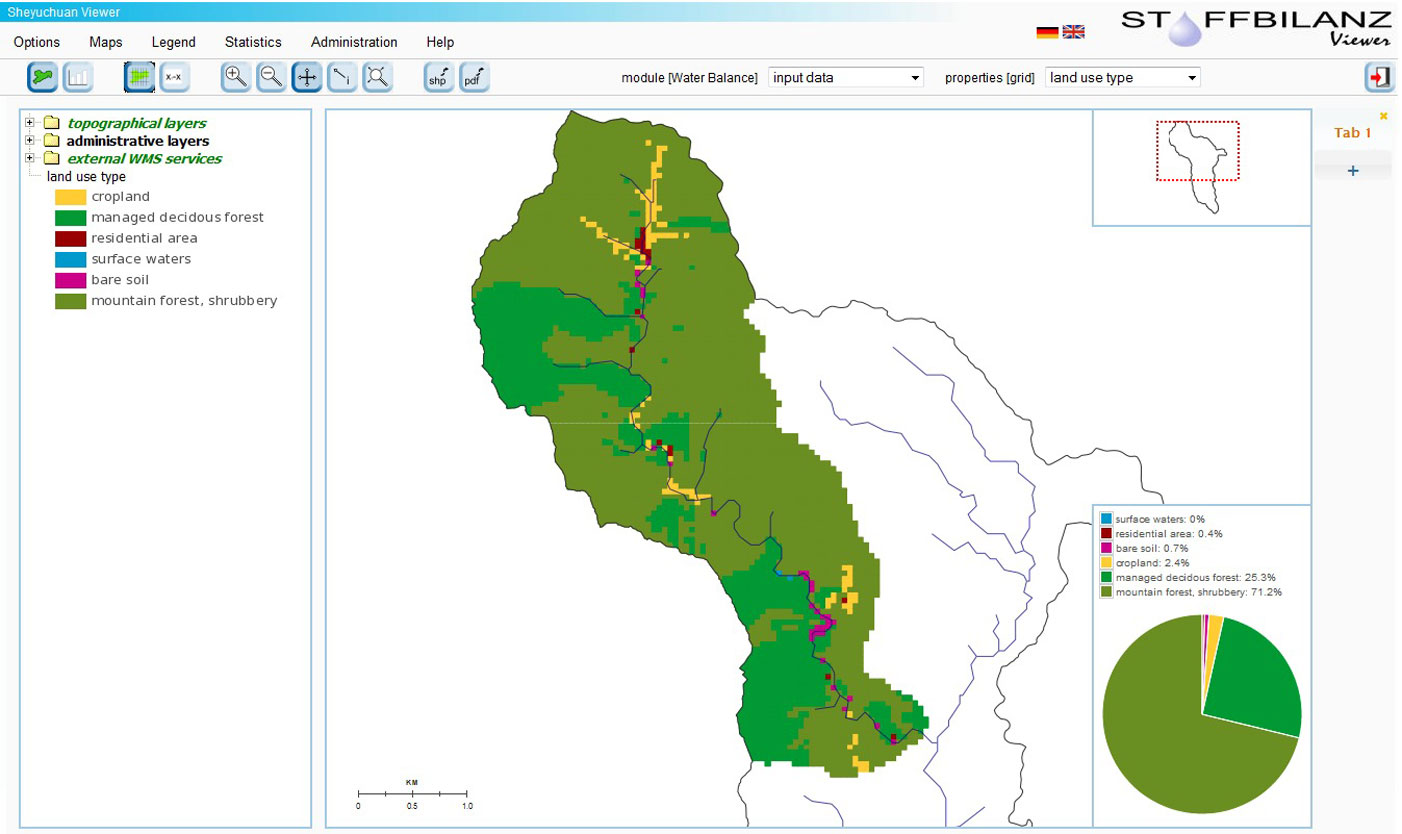
In contrast to the approach for the whole catchment, some digital spatial data regarding elevation, soil and land use in the Sheyuchuan subcatchment were provided by the Water Authority (BWA). Sheyuchuan is located in the north-west of Miyun reservoir with a total extent of approx. 10 km2. It is characterized by a regional specific land use pattern (Fig. 3) and a regional specific agricultural land use as well, with flat terraces in slope areas, covered by corn or orchards. Climate data are taken from the Shixia meteorological station (temperature, precipitation) for the reference year 2011.
Fig. 3 - Land use in the Sheyuchuan subcatchment.
Methodology and technology
The web GIS-based software STOFFBILANZ ([7], [8], [9]) was used to calculate runoff, sediment and nutrient input in the whole catchment area (variable grid size from 125 x 125 m up to 500 x 500 m), as well as in the subcatchment Sheyuchuan (fixed grid size of 50 x 50 m). The approach is suitable for modeling on regional scale and requires a minimum of parameters to run the model. Calibration of the modeling was done on the basis of a continual monitoring, established on the plot-, field and subcatchment scale ([15]). The subcatchment Sheyuchuan was used to link the process-based modeling by WaSim-ETH/IWAN with the web-based meso-scale modeling, using a higher spatial resolution, compared to the whole catchment modeling. The conceptual design of this nested modeling approach is shown in Fig. 4.
Fig. 4 - Conceptual design of the modeling approach.
Due to semiarid monsoon climate daily FAO dual crop evapotranspiration under soil water stress conditions was integrated into the modeling ([1]). Daily surface runoff was calculated according to the Curve number approach ([18]).
Meteorological data disaggregation for the total catchment area
Grid-based climate data were only given as monthly long-term average values from the WorlClim dataset (1960-1990, 1 km2). In order to generate a daily distribution of temperature and precipitation values, the monthly WorldClim data was combined with a daily distribution from a given meteorological station in the central part of Miyun catchment area for reference year 2009. Thus it was possible to consider the runoff events in a daily resolution, whenever the monthly sum of precipitation corresponds to the long-term WorldClim dataset. Daily meteorological data are the result of this disaggregation and do not correspond directly to observed values in detail. If real values were available in the future, they should be used instead of the modeled ones. Nevertheless, it was possible to simulate water fluxes based on these data, which give a typical impression of the recent situation of runoff in a daily resolution. From our point of view, this is absolutely necessary in the study area with its typical monsoon climate.
In subcatchment Sheyuchuan climate data from Shixia station were used for the year 2011.
Grid cell-based direct runoff QD was simulated on the daily based Curve Number approach (detailed description is given in [10]) as follows (eqn. 1, eqn. 2, eqn. 3):
where Ns is the storm rainfall event [mm], IA is an initial abstraction, representing the losses before runoff begins [mm], S is the potential maximum watershed water retention after runoff begins [mm], CN is the daily curve number dependent on land-use type hydrological soil group.
Evapotranspiration and percolation from root zone to groundwater table
The FAO Penman-Monteith equation determines the evapotranspiration from the hypothetical grass reference surface ET0 and provides a standard to which evapotranspiration in different periods of the year or in other regions can be compared and to which the evapotranspiration from other crops can be related (see [1] for more details). The modeling of daily crop evapotranspiration under non-standard conditions (ETc-adj) is based on the following equation ([1] - eqn. 4):
where ETc-adj is the adjusted crop evapotranspiration [mm d-1], KS is the water stress coefficient, Kcb is the basal crop coefficient, Ke is the soil evaporation coefficient, ET0 is the grass reference evapotranspiration.
Following heavy rain or irrigation, downward drainage (percolation) of water from the topsoil layer (DPe,i - percolation from the evaporating layer into the root zone) is calculated as (eqn. 5):
where De,i is the cumulative depth of evaporation (depletion) following complete wetting at the end of day i [mm], Pi is the precipitation on day i [mm], ROi is the precipitation runoff from the soil surface on day i [mm], Ii is the irrigation depth on day i that infiltrates into the soil [mm], fw is the fraction of soil surface wet by rain or irrigation.
As long as the soil water content in the evaporation layer is below field capacity (i.e., De,i > 0), the soil will not drain and DPe,i = 0. Following heavy rain or irrigation, the soil water content in the root zone might exceed field capacity, and DPi (daily deep percolation) may be calculated as follows (eqn. 6):
where DPi is the water loss out of the root zone by deep percolation on day i [mm] and Dr,i-1 is the water content in the root zone at the end of the previous day, i-1 [mm].
As long as the soil water content in the root zone is below field capacity (i.e., Dr, i > 0), the soil will not drain, and therefore DPi = 0.
A detailed description of the methodologies is given by Allen et al. ([1]).
Parametrization and testing in a nested approach
Calibration and testing of the meso-scale modeling approach was done on the basis of the continual monitoring of the UFZ ([15]) at the lysimeter station (plot scale) and in the small subcatchment Sheyuchuan (microscale).
Lysimeter observation and simulated deep percolation
The lysimeter data revealed a substantial amount of seepage water in July 2011, caused by a heavy rainfall of more than 100 mm d-1 ([15]). The monitoring results underline that the episodic character of the rainfall pattern and the processes which this sets into motion have to be modeled with a high resolution on the meso-scale in order to properly depict critical source areas, transport pathways and solute loads. The lysimeter observations were used to learn from the processes of runoff generation and to calibrate the ETc-adj and deep percolation simulation (Tab. 1). The lysimeter core was taken from an intensive field corn site near the reservoir ([16]).
Tab. 1 - Crop coefficients for the simulation of the lysimeter plot (2011).
| Coefficients “field corn” / soil properties | Values / description |
|---|---|
| Kcb ini | 0.15 |
| Kcb mid | 1.15 |
| Kcb end | 0.15 |
| Plant height [m] | 3.0 |
| Development stages [d] | Initial: 30, development: 40, mid: 50, late: 50 |
| Max. root depth [m] | 1.0-1.7 |
| Depletion fraction | 0.55 |
| Plant date | 5 May 2011 |
| Soil texture | Silt loam |
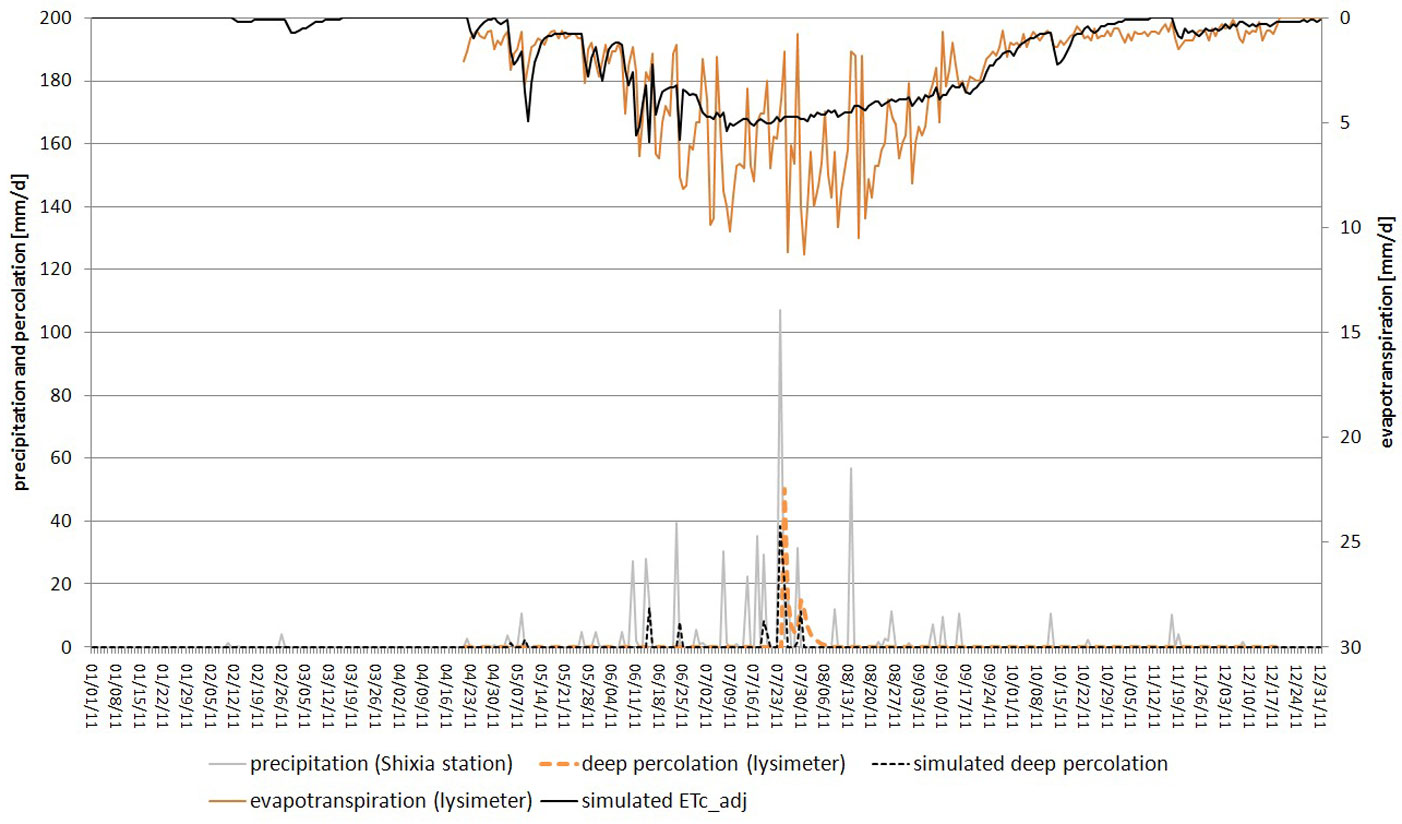
The difference between the observed rainfall at the lysimeter and the corrected rainfall at a meteorological station nearby (Hellmann rain gauge) underlines that there is a significant influence of the dewfall, especially at the plant-covered lysimeter plot in summer ([14]). To consider this additional water supply of approx. 60 mm during summertime, the observed “Hellmann”-rainfall was corrected by 1.15 on rainy days for June, July and August as the result of an iterative approach, based on the detailed analyses of the lysimeter data (UFZ). The increase of rainfall amount is about 61 mm. A further correction was made for the ET0 term, which meant a reduction for the same period of time by 0.90. This is due to the fact that evapotranspiration was supposedly overestimated during the summer period with rainfall and dewfall and very high air humidity on the crop site.
Fig. 5 depicts the result of this calibration. The simulation of evapotranspiration corresponds well with the observation. In summertime the amplitude of simulated evapotranspiration is much lower than that observed by the lysimeter. This is due to the fact that the simulated soil moisture and the evapotranspiration term as well remain at a constantly high (maximum) level in that period. Plant interception and the evaporation from the plant surface are not included in the modeling in an adequate way, because it is focusing on soil-water-plant-interactions. In contrast to that the lysimeter peaks give continual (every 10 min) information about the changes of mass, caused by the fluctuating evapotranspiration term. A positive peak appears after the rainfall event and shows, how much water is evaporated from the wet soil, but also from the wet plant surface. The observed evaporation by the lysimeter is therefore slightly higher compared to the simulated one. The simulated values were compared to the observed ones for average values of periods of seven days. The calculated Nash-Sutcliffe model efficiency coefficient is 0.78 ([17]). According to the soil-water-fluxes, which are more important from our point of view, the results of the simulated deep percolation correspond well with the observed one with a calculated Nash-Sutcliffe model efficiency coefficient of 0.75 for the same periods. A daily comparison was neglected, because flow distance and retention time is not included in the soil-water-budget of the ETc-adj approach and respectively in the Curve number approach.
Fig. 5 - Comparison of measured lysimeter data and model results for actual evapotranspiration and deep percolation for 2011.
Comparison of runoff monitoring and runoff simulation in subcatchment Sheyuchuan
Simulations in subcatchment Sheyuchuan were done for 2011 too, using the detailed information about the runoff situation at the automatic gauging station for this year. The runoff curve is based on the observation of the water level (h) in a five minute interval, combined with a h/q relationship. Observed total runoff is about 80 000 m3 y-1 and 7 mm y-1 respectively (Fig. 6).
Fig. 6 - Observed runoff at the downstream weir of Sheyuchuan (north-western part) in 2011.
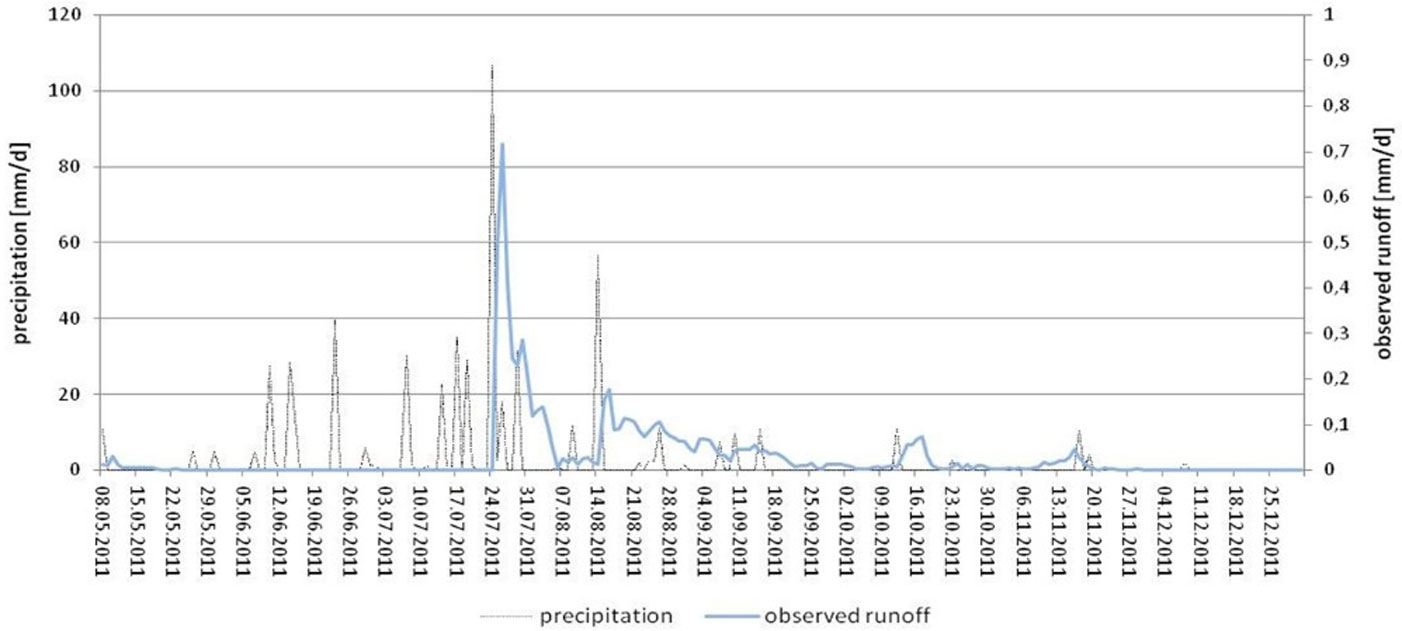
A first significant runoff peak appears on July 24, being the precipitation events before this time not relevant for the runoff at the weir. The sum of observed runoff in this subcatchment is rather small, in comparison to regional literature data. According to Ma et al. ([13]), there is an average total runoff of 41.8 mm yr-1 in the Miyun catchment area from 1984-2005, with an estimated water abstraction of 20% for irrigation purposes. For the period from 1998 up to 2005, total runoff is lower than 30 mm yr-1. Nearly half of this is abstracted for irrigation leading to a respective decrease of the inflow into the reservoir. This evaluation corresponds to the BWA data for the period 2000 to 2005 with average runoff values of 17.3 mm yr-1 (Bai River) and 15.4 mm yr-1 (Chao River in the more dry Western part) respectively, but also to UNEP ([25]) with an annual total runoff in the Miyun catchment area of 13 mm yr-1.
A closer look into subcatchment Sheyuchuan shows that there might be a large water abstraction too, which could exceed 100 000 m3 per year. For the biggest reservoir upstream from the weir an estimated storage capacity of approximately 40 000 m³ was constituted. It was completely filled with water in winter that was probably stored for water supply on cropland in spring time. It is supposed that there might be a large water abstraction in the following months too, to ensure irrigation on cropland during the vegetation period that has to be included in the discussion of monitoring and modeling results with the Chinese regional partners or the Chinese stakeholders in the region.
Simulated direct runoff for 2011 is about 27 mm yr-1 and presented in Fig. 7. Higher values were calculated on cropland, residential areas and bare soil, lower ones on areas with a natural or semi natural vegetation (mountain forest, shrubs).
Fig. 7 - Simulated direct runoff for Sheyuchuan subcatchment in 2011 (sums of daily values).
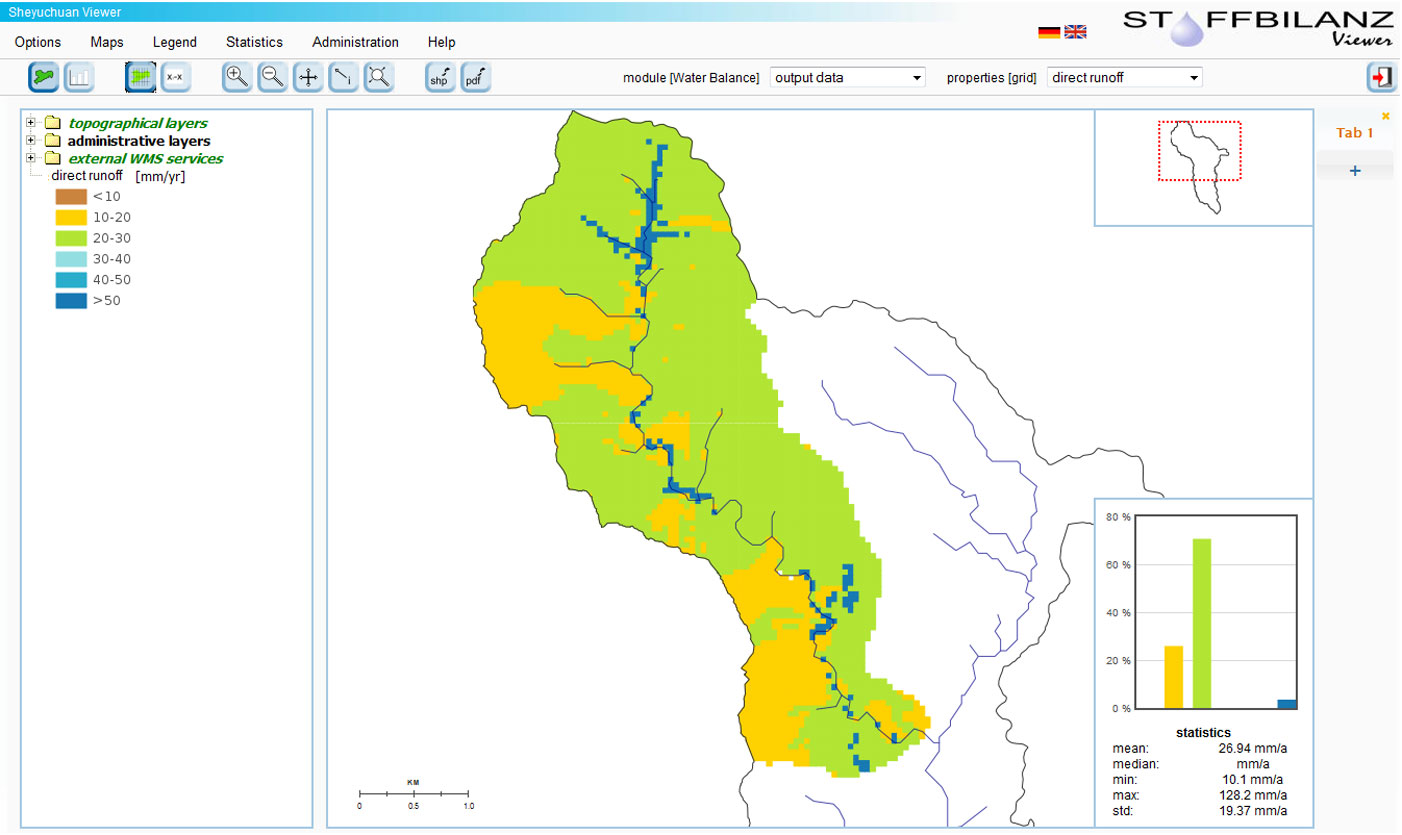
The results of the deep percolation modeling according to the ETc-adj-approach show higher percolation rates on cropland, residential areas and areas with bare soils. A significantly low percolation was simulated on sites with a natural or semi natural vegetation, because of the higher soil coverage by plants and the higher evapotranspiration rates. A comparison of measured and simulated runoff parameters for Sheyuchuan is shown in Fig. 8. Simulated water fluxes are absolutely dominated by direct runoff (26.9 mm yr-1), deep percolation is about 1.7 mm yr-1 only. Simulated total runoff is about 28.6 mm yr-1. The observed one is much lower with 7 mm yr-1. Calculated Nash-Sutcliffe model efficiency coefficient for average values of periods of seven days is 0.01, which is an expected low value ([17]). Comparing the simulation to observed values one has to be aware that the model is not able to record the time delay of groundwater runoff in general. Flow distances and retention time are not included in the soil-water-budget of the ETc-adj approach.
Fig. 8 - Comparison of observed and simulated runoff parameters for Sheyuchuan subcatchment in 2011.
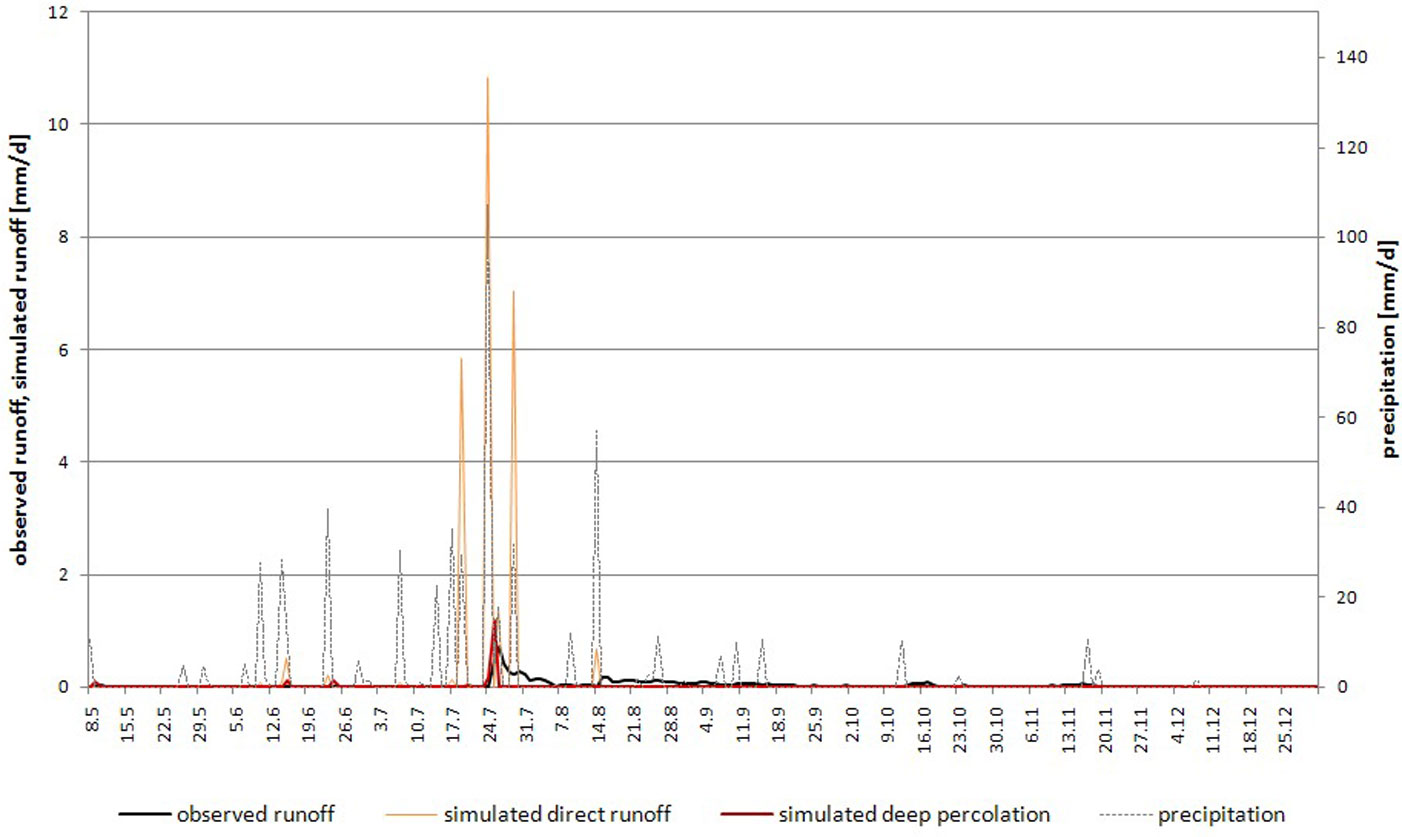
According to modeling, four big rainfall events are causing runoff events as well. Only three of four show a significant runoff peak at the weir. For the last rainfall event before the big rain on 24 July 2011 starts, the simulated peak is not confirmed by the weir observation. One possible reason for this phenomenon could simply be the fact that the runoff is stored in reservoirs upstream the weir. The runoff generation at the weir would then start after the storage capacity was exceeded. The first simulated runoff event is about 4 mm and corresponds to the estimated storage capacity of the biggest of these reservoirs. Additionally, it is worth to mention that the observed difference can be caused by uncertainty of the simulation as well. Secondly, it has to be considered that there is no meteorological station located in the subcatchment to give detailed site-specific information about the events. Therefore Shixia station was used, which is about 20 km far away from Sheyuchuan.
Finally, we can state that the main events in the simulation are described well from the chronological point of view. The differences in runoff amounts can be explained by the estimated water abstraction. However, secure information about the amount of such water withdrawal is missing at the moment. The results were also compared with the WaSiM-ETH-simulation ([15]). The simulation of the total runoff for reference year 2011 of Sheyuchuan (45.8 mm yr-1) support the hypothesis of a large water abstraction upstream the weir. The simulation by the STOFFBILANZ software also corresponds well to average values given in literature (see the discussion above). In summary it should be able to give sufficient information about runoff generation and water fluxes at the meso-scale too.
Simulation in the Miyun catchment area
After the successful calibration at the lysimeter station and the testing in Sheyuchuan subcatchment, the knowledge on the local process generation was transferred into the total catchment area of Miyun. According to the meteorological dataset, all calculations are based on the climate data pool of 1960 to 1990, combined with the event-based daily meteorological data for the year 2009 from the central Shixia meteorological station at Miyun catchment area. Thus it was not possible to validate the results for a particular year, but only by long-term observations of total runoff.
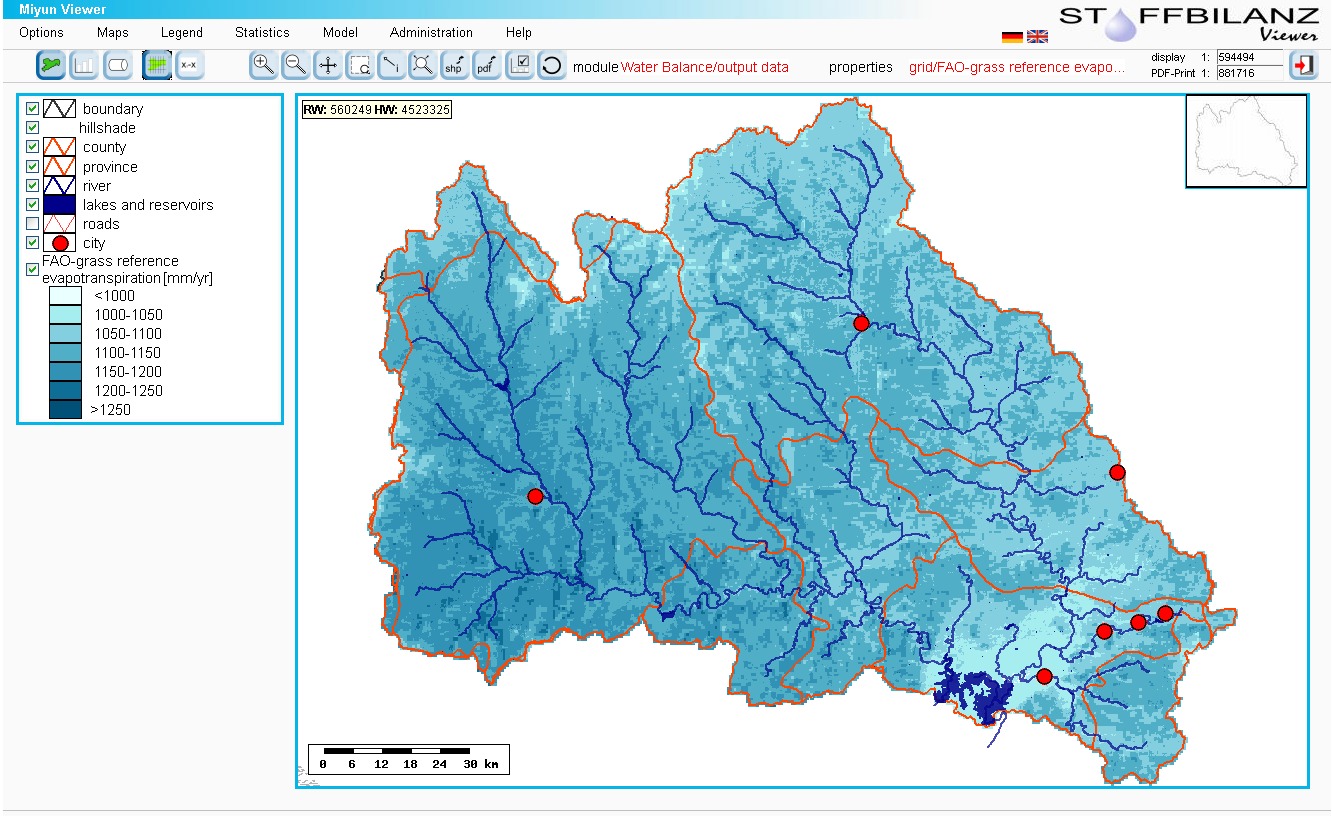
Fig. 9 shows the results of the FAO-grass reference evapotranspiration modeling, ranging from 970 mm yr-1 in the south-eastern part to 1.293 mm yr-1 in the north-western part.
Fig. 9 - Simulation of FAO-grass reference evapotranspiration in the Miyun catchment area (reference year 2009).
The simulation of direct runoff is presented in Fig. 10. The average value for the total catchment area is about 11.7 mm yr-1. Percolation from the evaporating layer into the root zone was calculated by the ETc-adj-approach with an average value of 132.5 mm yr-1 for the total catchment (Fig. 11). Percolation from the root zone into groundwater is about 3.1 mm yr-1 (Fig. 12). Average values for direct runoff, percolation into the root zone, deep percolation and total runoff are reported in Tab. 2 on the county level (administrative units forming the whole Miyun catchment).
Fig. 10 - Simulation of direct runoff in the Miyun catchment area (reference year 2009).
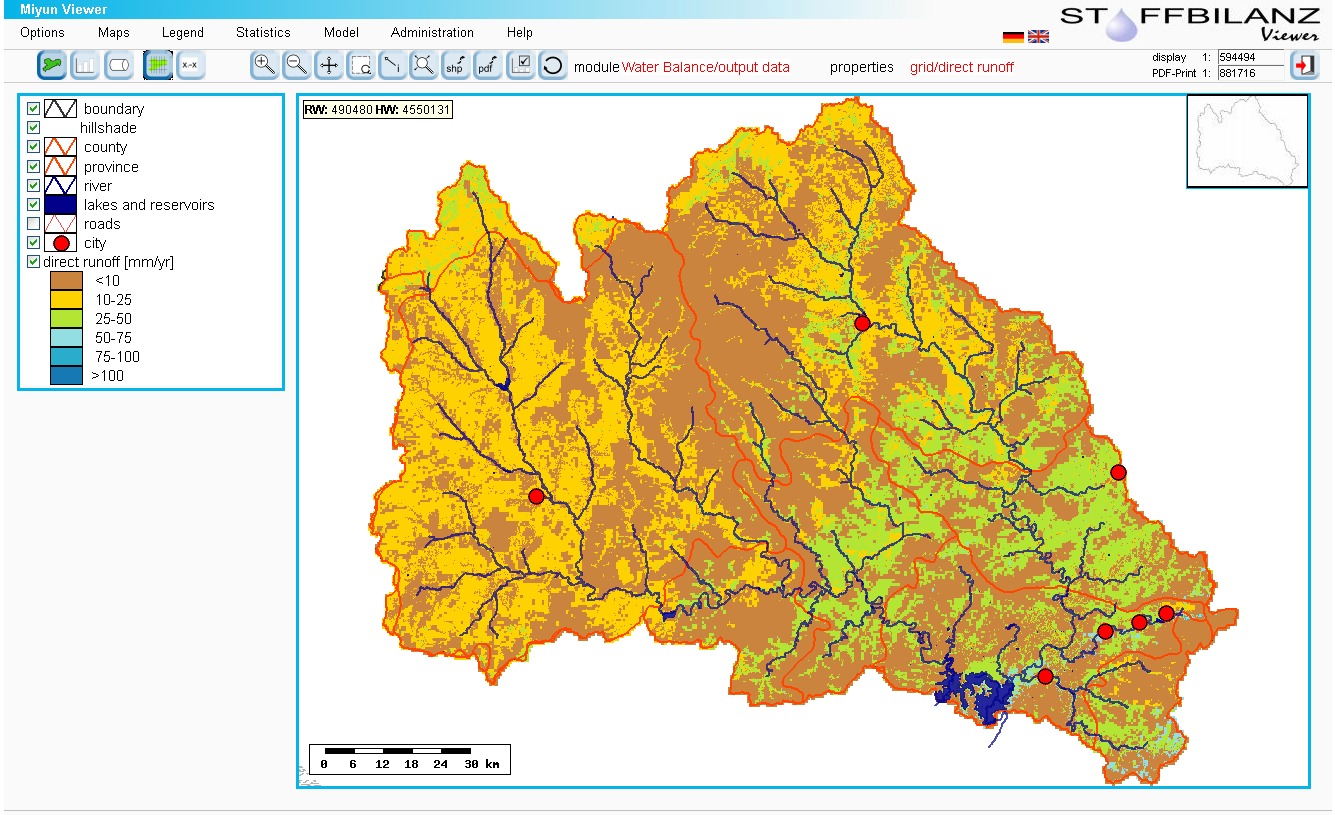
Fig. 11 - Simulation of the percolation from the evaporating layer into the root zone in the Miyun catchment area (reference year 2009).
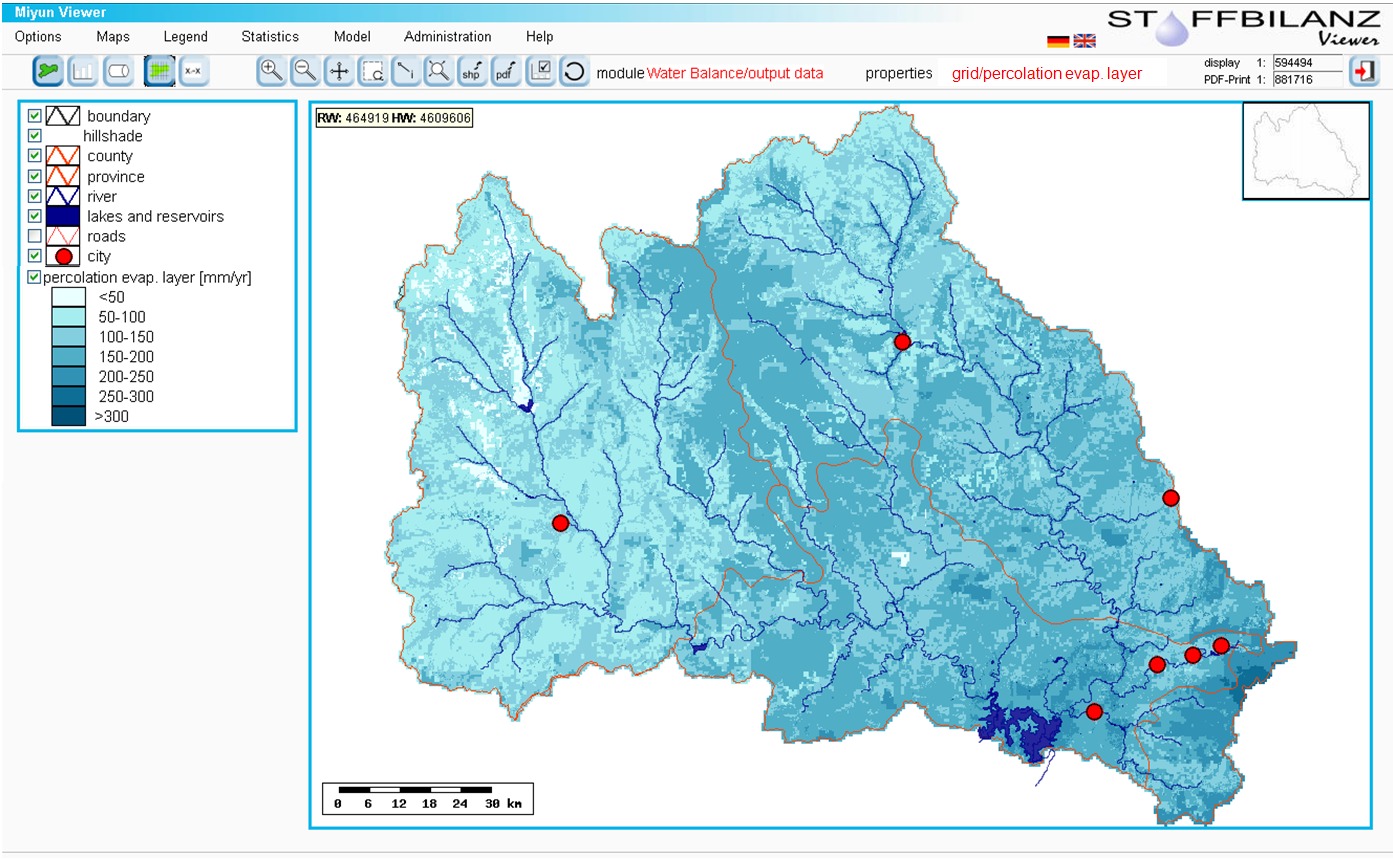
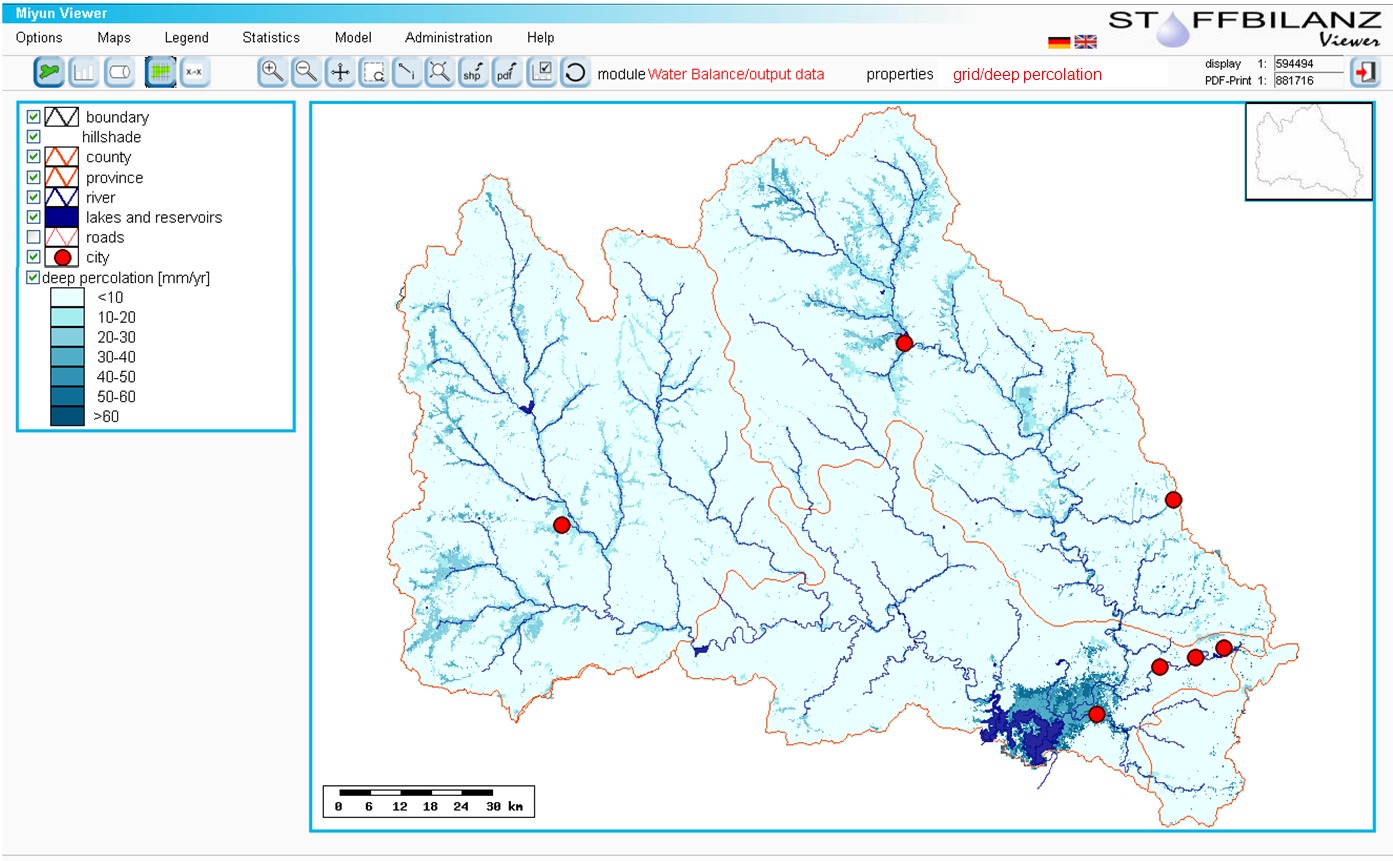
Fig. 12 - Simulation of deep percolation (groundwater runoff) in the Miyun catchment area (reference year 2009)
Tab. 2 - Average values for direct runoff, deep percolation and total runoff in counties for the reference year 2009.
| County | direct runoff [mm yr-1] |
deep percolation [mm yr-1] |
total runoff [mm yr-1] |
|---|---|---|---|
| Chengde Xiàn | 0.9 | 0.6 | 1.5 |
| Chicheng | 9.2 | 2.7 | 11.9 |
| Chongli | 13.0 | 4.6 | 17.5 |
| Fengning Manchu | 11.5 | 3.3 | 14.8 |
| Guyuan | 15.5 | 2.3 | 17.8 |
| Huailai | 10.9 | 1.4 | 12.4 |
| Huairou | 12.9 | 0.7 | 13.6 |
| Luanping | 17.5 | 2.8 | 20.2 |
| Miyun | 13.3 | 7.9 | 21.2 |
| Xinglong | 15.3 | 1.3 | 16.6 |
| Xuanhua | 12.1 | 3.4 | 15.5 |
| Yanqing | 8.3 | 0.8 | 9.1 |
According to UNEP ([25]), the annual water inflow into the Miyun reservoir is about 200 000 000 m3, corresponding to a total runoff of 13 mm yr-1. BWA confirmed these data for the period 2000 to 2005, with average runoff values of 17.3 mm yr-1 (Bai river) and 15.4 mm yr-1 (Chao river), respectively, and a range from 7.4 to 31 mm yr-1 (Bai river). Water abstractions, which can be estimated as 20% of the total runoff in the minimum ([13]), have to be added to compare the observed values with the simulated total runoff in the Miyun basin of 15 mm yr-1. According to these estimations, the simulation results are in good agreement with the range reported in the literature and with data from monitoring. Nevertheless, the simulation tends to give values slightly too low. Maybe this is due to the fact that there is an underestimation of the cropland share ([28]) by the remote sensing survey. Cropland and residential areas are the most important land use types for runoff generation.
Conclusions and outlook
So far, different studies have dealt with the problems of water quality and water quantity in the Miyun catchment area ([21], [28], [3], [13], [24]). Nevertheless, there is a lack of regional specific knowledge about the processes of runoff generation and sediment and nutrient dynamic. Quantification of water, sediment and nutrient fluxes and identification of relevant processes is difficult and yet not accomplished so far. Ongley et al. ([20]) compared primary methods used for non-point source (NPS) estimation in China with their use in America. They postulate, that an “empirical research is limited and does not provide an adequate basis for calibrating models...” and that “the Chinese agricultural situation is so different from that of the United States that empirical data produced in America, as a basis for applying estimation techniques to rural NPS in China, often do not apply”. First monitoring results emphasize the necessity to learn from the processes first and then to parametrize the modeling tools in order to consider the specific regional situation of climate, relief and management ([15]).
In the current project it was possible to get insight into these processes by a scaled monitoring approach which formed the basis for modeling and demonstration projects on different scales up to the meso-scale modeling in the total catchment area.
Calibration of the runoff model was done with the help of the lysimeter and runoff observation in Sheyuchuan subcatchment, respectively. The simulated runoff was validated using values from runoff and sediment stations (2000-2005) for Chao River and Bai River. In general, a good agreement of simulated and observed values was found, but we have also to state that this kind of validation is very rough. This was due to the fact that the availability of spatial and monitoring data (runoff, nutrient loads and concentrations) was extremely limited. The high uncertainty of data should be reduced in future water resources management by the responsible water authorities in order to increase the reliability of the simulation results. On the other hand, it was possible to get insight into the processes of runoff by the bottom-up approach, which provided absolutely necessary data to calibrate the model. By using this knowledge a scientific basis to integrate the modules to simulate water and nutrient fluxes as well as to test mitigation options was built up. This is a very important first step to come to an integrated river basin management. The STOFFBILANZ Viewer can be used as an instrument for planning purposes that should be further improved and adapted to the special issues in the region in cooperation with the developer team from GALF bR. The current version is free for use at ⇒ http://www.stoffbilanz.viewer.de (password protected) for the Beijing Water Authority (BWA), that was consequently integrated into the development of methodology and technology, and received the necessary training to use the software for decision support in the future. BWA has representatives in rural communities and is a multiplier for knowledge transfer and implementation of project results. Due to comparably big problems of water pollution in various parts of China as well as in many other Asian countries, we took into consideration that modeling and decision support should be easily transferable to any other region with similar issues.
Acknowledgements
This study is sponsored by the German Federal Ministry of Education and Research (BMBF, FKZ 02WM 1047/1048/1049). We would like to thank all colleagues from the Chinese and German partner institutions for their cooperation, support and the providing of data on agriculture, hydrology, soil and climate.
References
Gscholar
Gscholar
Gscholar
Online | Gscholar
Online | Gscholar
Gscholar
Gscholar
Gscholar
Authors’ Info
Authors’ Affiliation
Stefan Halbfass
Gesellschaft für Angewandte Landschaftsforschung (GALF) bR, Am Ende 14, D-01277 Dresden (Germany)
Jens Hagenau
Helmholtz-Centre for Environmental Research - UFZ, Department Soil Physics, Lysimeter station, Dorfstr. 55, D-39615 Falkenberg (Germany)
Beijing Soil and Water Conservation Center, No.5 Yunuantan South Road, Haidian District, 100038 Beijing (China)
Corresponding author
Paper Info
Citation
Gebel M, Meissner R, Halbfass S, Hagenau J, Duan S (2014). Web GIS-based simulation of water fluxes in the Miyun catchment area. iForest 7: 363-371. - doi: 10.3832/ifor1169-007
Academic Editor
Marco Borghetti
Paper history
Received: Oct 31, 2013
Accepted: Nov 20, 2013
First online: May 19, 2014
Publication Date: Dec 01, 2014
Publication Time: 6.00 months
Copyright Information
© SISEF - The Italian Society of Silviculture and Forest Ecology 2014
Open Access
This article is distributed under the terms of the Creative Commons Attribution-Non Commercial 4.0 International (https://creativecommons.org/licenses/by-nc/4.0/), which permits unrestricted use, distribution, and reproduction in any medium, provided you give appropriate credit to the original author(s) and the source, provide a link to the Creative Commons license, and indicate if changes were made.

Web Metrics
Breakdown by View Type
Article Usage
Total Article Views: 58491
(from publication date up to now)
Breakdown by View Type
HTML Page Views: 48419
Abstract Page Views: 3876
PDF Downloads: 4671
Citation/Reference Downloads: 19
XML Downloads: 1506
Web Metrics
Days since publication: 4440
Overall contacts: 58491
Avg. contacts per week: 92.22
Article Citations
Article citations are based on data periodically collected from the Clarivate Web of Science web site
(last update: Mar 2025)
Total number of cites (since 2014): 5
Average cites per year: 0.42
Publication Metrics
by Dimensions ©
Articles citing this article
List of the papers citing this article based on CrossRef Cited-by.
Related Contents
iForest Similar Articles
Research Articles
Slope shape effect on runoff and soil erosion under natural rainfall conditions
vol. 7, pp. 110-114 (online: 18 December 2013)
Research Articles
Distribution factors of the epiphytic lichen Lobaria pulmonaria (L.) Hoffm. at local and regional spatial scales in the Caucasus: combining species distribution modelling and ecological niche theory
vol. 17, pp. 120-131 (online: 30 April 2024)
Research Articles
Local ecological niche modelling to provide suitability maps for 27 forest tree species in edge conditions
vol. 13, pp. 230-237 (online: 19 June 2020)
Research Articles
Fire occurrence zoning from local to global scale in the European Mediterranean basin: implications for multi-scale fire management and policy
vol. 9, pp. 195-204 (online: 12 November 2015)
Research Articles
Modelling the carbon budget of intensive forest monitoring sites in Germany using the simulation model BIOME-BGC
vol. 2, pp. 7-10 (online: 21 January 2009)
Research Articles
Spatio-temporal modelling of forest monitoring data: modelling German tree defoliation data collected between 1989 and 2015 for trend estimation and survey grid examination using GAMMs
vol. 12, pp. 338-348 (online: 05 July 2019)
Technical Reports
Effects of wildfires on peak discharges in watersheds
vol. 8, pp. 302-307 (online: 03 September 2014)
Research Articles
Reforestation and land use change in a drainage basin of southern Italy
vol. 6, pp. 175-182 (online: 08 May 2013)
Research Articles
Incorporating management history into forest growth modelling
vol. 4, pp. 212-217 (online: 03 November 2011)
Short Communications
Dynamic modelling of target loads of acidifying deposition for forest ecosystems in Flanders (Belgium)
vol. 2, pp. 30-33 (online: 21 January 2009)
iForest Database Search
Search By Author
Search By Keyword
Google Scholar Search
Citing Articles
Search By Author
Search By Keywords
PubMed Search
Search By Author
Search By Keyword


