
Estimating the sensitivity to desertification of Italian forests
iForest - Biogeosciences and Forestry, Volume 8, Issue 3, Pages 287-294 (2015)
doi: https://doi.org/10.3832/ifor1111-008
Published: Aug 26, 2014 - Copyright © 2015 SISEF
Research Articles
Abstract
The present study assesses the level of sensitivity to desertification of forest types in Italy between 2000 and 2010 on a fine resolution scale using the Environmental Sensitive Area (ESA) scheme. The proposed methodology identifies and ranks the level of sensitivity of fourteen forest types and quantifies the changes in their level of sensitivity over time as a contribution to understanding of complex landscape-forest interactions in Mediterranean ecosystems. Only few forest types showed a relatively high sensitivity level, suggesting that forests may positively contribute to the mitigation of land degradation processes in the Mediterranean region. Forest types showing the highest sensitivity are native types mostly adapted to dry Mediterranean landscapes, introduced vegetation types and highly-fragmented and heterogeneous forest types. Results suggest that: (i) high-quality and biodiversity-rich forest types (e.g., beech, mountain pine forests) may act as vegetation buffer mitigating the increase of land sensitivity to desertification at the landscape scale; and (ii) the remaining forest types (especially highly fragmented, low-quality or low-biodiversity classes in areas with severe soil and climate conditions) may undergo increases in land sensitivity to desertification and should be protected through specific management measures as also implemented in the framework of the National Action Plans to Combat Desertification.
Keywords
Environmental Indicators, ESAI, Desertification, Forests, Mediterranean Basin, Climate, Soil
Introduction
Global warming, economic development, social disparities and population growth are considered key drivers of Land Degradation (LD) over large areas. Desertification is a worldwide LD process which affects about 40 per cent of the Earth’s surface, including large regions in developed countries such as United States, Australia and Europe ([22]). Climate aridity, soil degradation, decreasing quality of the vegetation cover, along with the increasing anthropogenic pressure on land, are regarded critical factors for the intensification of LD processes especially in southern Europe ([33]). In the Mediterranean region, specifically anthropogenic stressors and biophysical factors usually go hand in hand in the development of LD phenomena ([15], [14], [35]).
The Annex IV of the United Nations Convention to Combat Desertification, specifically dealing with the Mediterranean region, highlights the two-fold position of forests as a land cover (i) potentially mitigating the severity of specific processes of land degradation, like soil erosion, and (ii) experiencing cumulative pressures that may lead to LD due to forest fires, overgrazing and wood overexploitation and climate change ([11], [36]). As a matter of fact, forest land in the Mediterranean basin is, to a large extent, confined to remote and steep soils with low organic matter and low levels of aggregate stability; this produces a high risk of soil erosion when vegetation cover is scarce and water is a limiting factor, especially in dry climate regimes with intense rainfalls ([42]). Moreover, the rapid rate of current climate change has the potential to render many plant species unable to track variations in climate quality ([23]); this is particularly true for tree species, as their long life-span does not allow for local adaptation to rapid environmental changes ([24]).
Despite extensive research on LD and desertification in the Mediterranean basin, studies specifically addressing variability in sensitivity to desertification within large forest regions are lacking. In this regard, Italy is an interesting case, as nearly 52% of the territory is regarded to be at potential risk of desertification ([14]), and over one-third is covered by forests and Other Wooded Lands (OWL, mainly represented by Mediterranean sclerophyllous shrubland - [21]). Furthermore, like other southern European countries such as Spain and Greece, Italy shows large socioeconomic disparities and, accordingly, displays different levels of anthropogenic pressure and forest management quality on a regional scale ([32]). Also differences in carbon accumulation and primary production are very high, both among and intra different forest types ([29], [27], [30]). Thus, a combination of a great variety of biophysical conditions and of socioeconomic factors makes Italy a kaleidoscopic case study to analyze patterns of sensitivity to LD in areas covered by forests and OWL and their dynamics over time ([9], [35]).
Building on these premises, the present study is aimed at assessing the level of sensitivity to desertification of lands covered by forests and sclerophyllous vegetation in Italy at two points in time (early-2000s and late-2000s) using the Environmental Sensitive Area (ESA) methodology. Stratification of this target land cover class by fourteen vegetation types allows to deeply explore patterns of sensitivity to LD across space and time.
Material and methods
Study area
Due to its geographical position in the middle of the Mediterranean, Italy is characterized by a variety of climate regimes ranging from the Mediterranean dry climate to humid and wet continental regimes. However, climate is generally mild with dry and hot summers and relatively wet winters in most of the country. The amount of precipitation generally increases with elevation (ranging from an average of 400 mm per year in southern Italy to over 3000 mm in the Alpine mountain ranges), while temperature regimes follow the reverse pattern ([33]). The physiognomy and spatial distribution of native forest vegetation is mainly determined by this temperature/precipitation gradient; xerophytic pinewoods dominate in the coasts and lowlands (Mediterranean pines) and in dry mountain sites (mountain pines), while in wet high elevations of Alpine and Apennine mountain ranges coniferous forest are dominated by spruce (Picea abies (L.) Karst.), fir (Abies alba Mill.), larch (Larix decidua Mill.) and arolla pine (Pinus cembra L.). Likewise, shrublands (high and low maquis), evergreen oaks and thermophilous deciduos species (oaks, chestnut) grow in vegetation belts under the influence of Mediterranean climate (thermo- to supramediterranean), while beech (Fagus sylvatica L.) and mixed mesophytic deciduous forest are found in mountainous areas with temperate climates.
Data and variables
The Environmentally Sensitive Area (ESA) approach is a widely applied methodology to evaluate and map the sensitivity of land to desertification ([25], [3]). The main advantages of the ESA are the flexibility in the use of the input variables and the robustness of the approach to quantify the sensitivity of land to desertification. The outcome of the ESA model is a composite index of environmental quality called ESAI (Environmental Sensitive Area Index). ESAI ranges from 1 (the lowest land sensitivity to degradation) to 2 (the highest sensitivity to degradation). Different classification systems are commonly used to map land sensitivity to degradation ([5]). In the present study we adopted the classification provided by European Environment Agency ([16]) for descriptive purposes: (i) non affected areas or very low sensitive areas to LD (ESAI < 1.2); (ii) low sensitive areas to LD (1.2 < ESAI < 1.3); (iii) medium sensitive areas to LD (1.3 < ESAI < 1.4); and (iv) sensitive areas to LD (ESAI > 1.4). Efforts to prevent or mitigate land degradation should be targeted to medium-sensitive and sensitive areas respectively: the former being lands in which any change in the delicate balance of biophysical conditions and human activity is likely to bring about desertification, while the latter being already degraded through past misuse ([25]).
The ESA method has been extensively validated at several sites in southern Europe ([25], [6], [1], [37], [38]), in middle and far East ([40], [19]) and in Africa, also for climate change analysing ([41], [20]); a regional assessment ([26]), based on heterogeneous geographical datasets with different reliability, indicates the ESAI as a proxy for land degradation processes and identifies correlations with a number of indicators of soil degradation. Ferrara et al. ([17]) evaluated the stability of the ESAI using statistical analysis and the sensitivity to changes in the composing indicators. Results of this statistical exercise indicate that the ESAI is a stable and reliable composite index, poorly affected by spatial and temporal heterogeneity in the composing indicators ([35]). A complete reference list of all recent ESA methodology applications can be found in Ferrara et al. ([18]).
Following the ESA methodology, the indicators selected to analyze sensitivity to LD in areas covered by forest and sclerophyllous vegetation in Italy refer to four themes (Tab. 1): climate quality, soil quality, vegetation and land-use quality, and human pressure on land (e.g., based on population density and growth over time and land-use intensity) as a proxy for land management quality ([33]). We covered a time period encompassing the last decade between the early 2000s and the late 2000s. To our knowledge, the selected data sources are the most reliable and updated for regional and country level assessments of the ESAI in Mediterranean countries (see also [32] for a discussion on supply-demand of statistical data in desertification matters). Indicators of land sensitivity were obtained by applying a standard weighting system (ranging from 1 to 2 - see [33] for the full table of weights) to each considered variable. The scoring system was based on the known relationship between each factor and land degradation processes ([25], [5], [6], [1], [2], [17], [26]). The ESAI was estimated in each spatial unit and year as the geometric mean of the variables described above. The spatial resolution of ESAI maps is 1 km2 ([32]), according to Basso et al. ([5]), and it is coherent with the resolution of the single layers.
Tab. 1 - Summary of the variables processed to map the ESAI in Italy in the reference period.
| Variable | Source | 2000 | 2010 |
|---|---|---|---|
| Average annual rainfall | Analysis from the National Agrometeorological Database |
1991-2000 | 2001-2010 |
| Average aridity index |
|||
| Slope aspect | ASTER GDEM | 20 m Digital Elevation Model of Italy |
20 m Digital Elevation Model of Italy |
| Soil Quality Index |
Joint Research Centre (Ispra), European Soil Bureau |
European Soil Database supplemented with national data sources | European Soil Database supplemented with national data sources |
| Land-use intensity | Italian Agency for Environmental Research and Protection (ISPRA) |
[7] | [8] |
| Vegetation Quality Index |
|||
| Population density | National Census of Population (ISTAT) |
2001 | 2011 |
| Population growth | 1991-2001 | 2001-2011 |
Statistical analysis
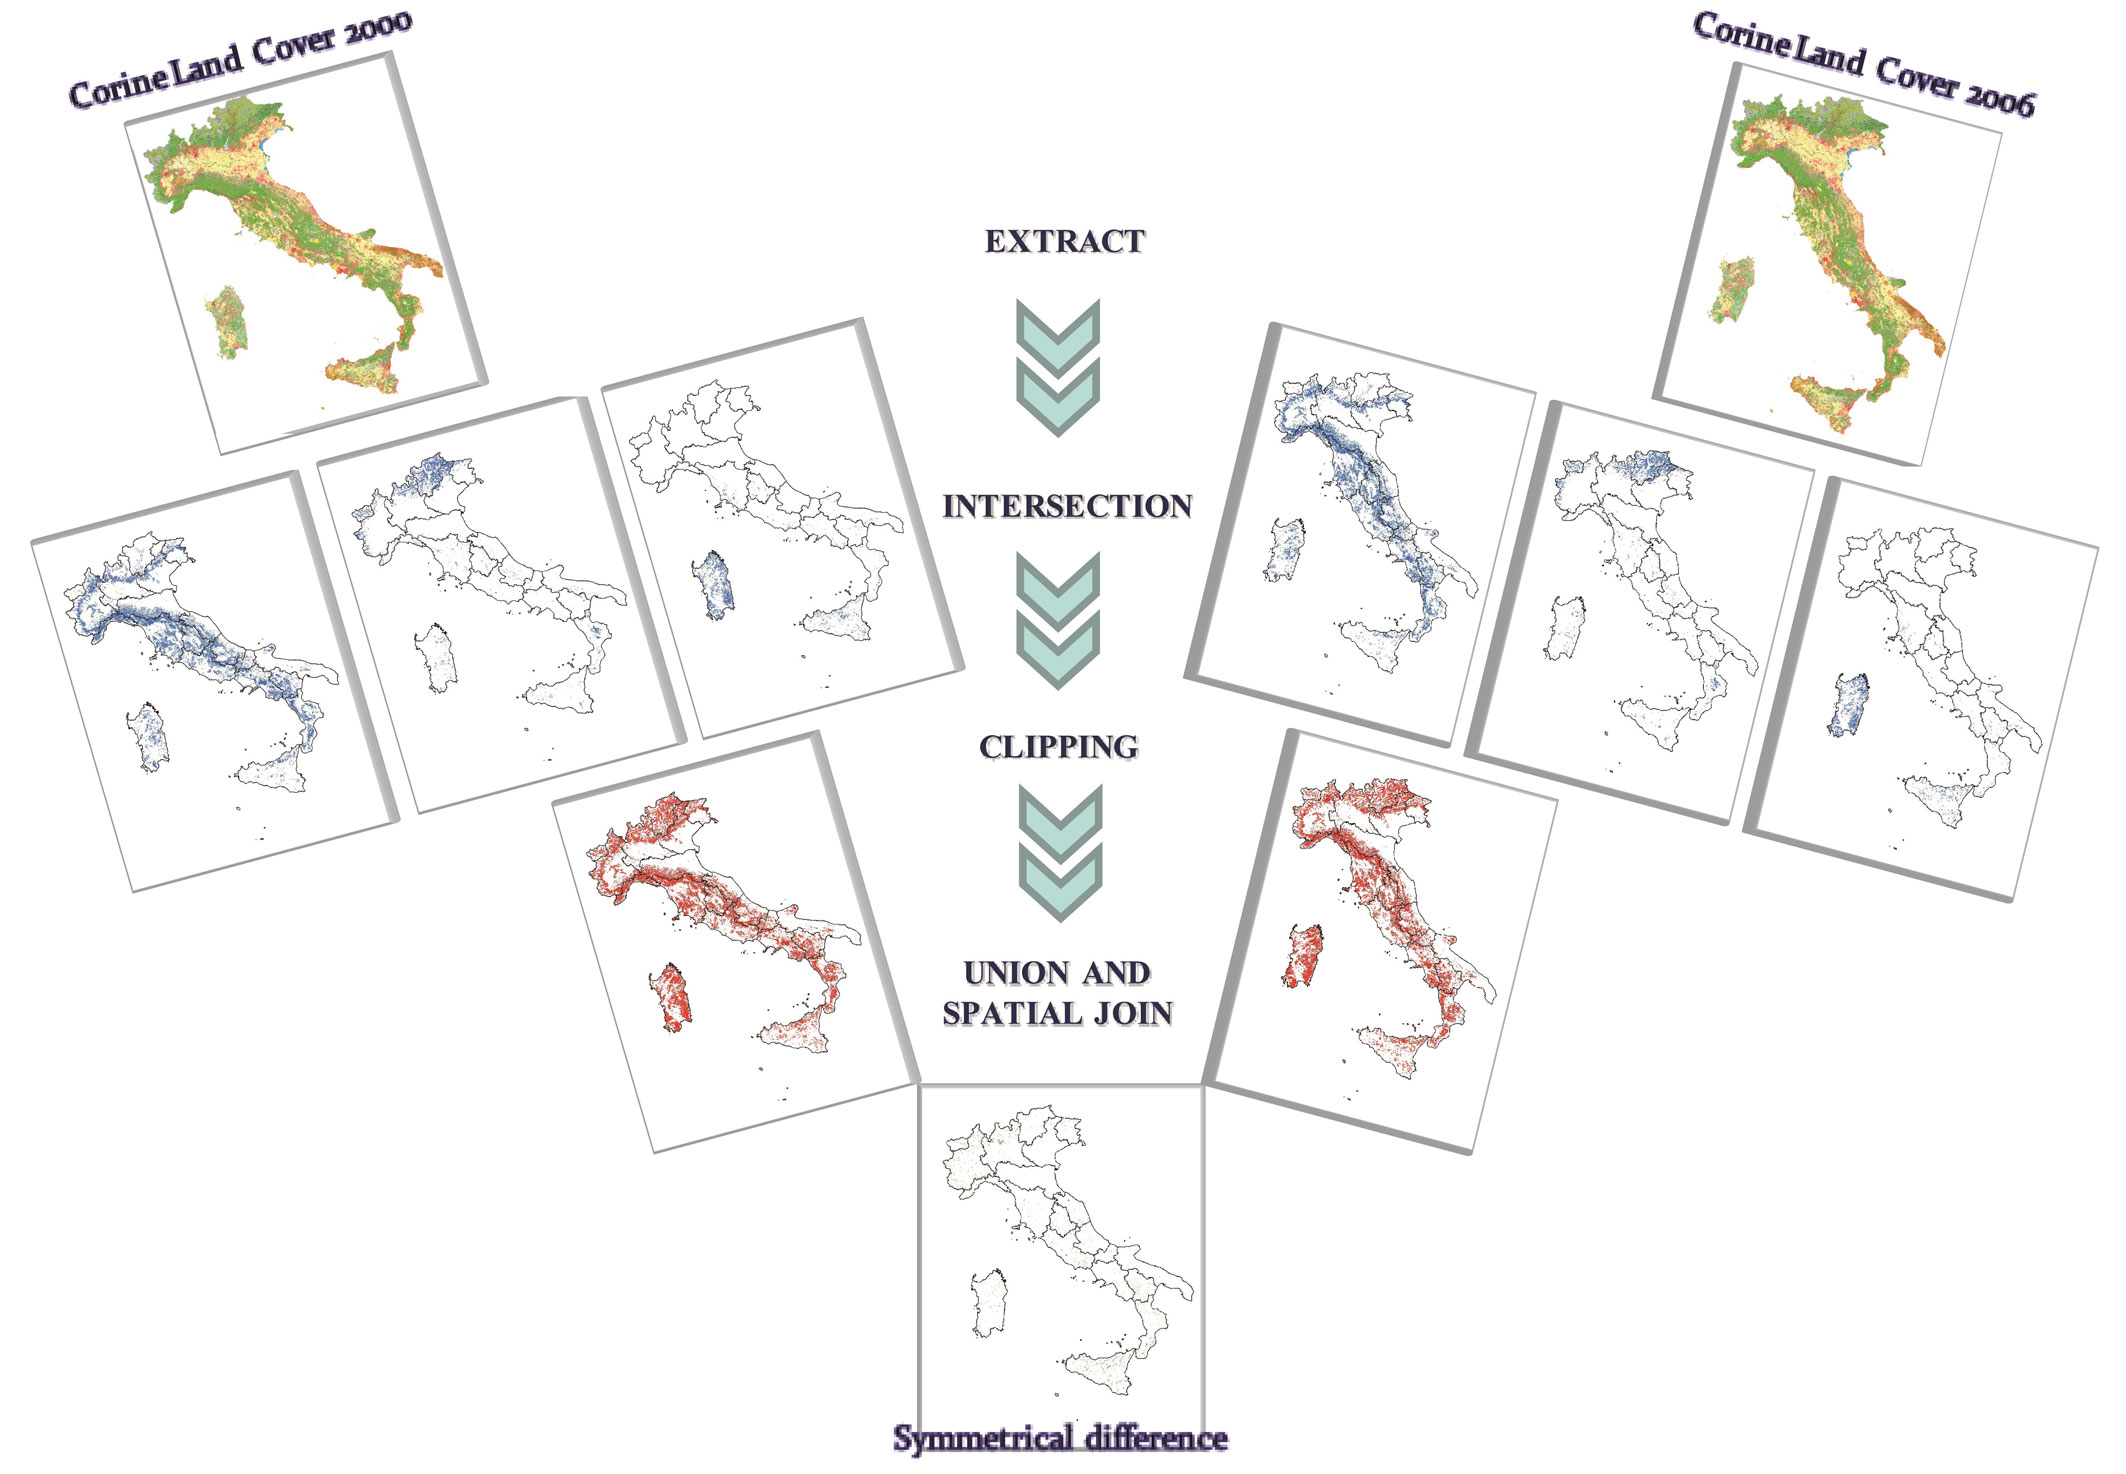
We used the [7] and [8] datasets available in Italy at the fourth hierarchical level (Tab. 2), to map into fourteen vegetation classes on a 1:100.000 scale (minimum mapping unit 25 ha) the land covered by forests and sclerophyllous vegetation in Italy (over 75 000 km2). Following Salvati et al. ([37], [38]), [7] and ESAI 2000 as well as [8] and ESAI 2010 maps were overlaid (Fig. 1) to derive a descriptive statistics for ESAI (mean, range and maximum score) for different spatial units, using the “zonal statistics” tool provided with the ArcGIS software (ESRI, Inc., Redwoods, USA). This procedure computes a surface-weighted average of the ESAI values (i.e., recorded on each elementary pixel) belonging to the analyzed spatial unit. Selected spatial units were: whole Italian territory, main geographical divisions of the country (north, center and south), and the spatial coverage of each single class of forest and shrubland types mapped by CLC. The three descriptive statistics reported above were selected to provide a comprehensive picture of the sensitivity level of each forest/shrubland type. The average ESAI value tracks the general pattern of land sensitivity to degradation, over the area covered by a given vegetation type at a given point in time, while the maximum ESAI identifies the highest degree of sensitivity; the range in the ESAI scores estimates the overall variability in the sensitivity level by class and year ([38]).
Tab. 2 - Corine Land Cover fourth-level nomenclature for forest and sclerophyllous vegetation.
| Level 1 | Level 2 | Level 3 | Level 4 |
|---|---|---|---|
| 3. Forests and semi- natural areas |
3.1. Forests | 3.1.1. Broad-leaved forest | 3.1.1.1. Evergreen oaks forest 3.1.1.2. Deciduous oaks forest 3.1.1.3. Mesophytic deciduous mixed forest 3.1.1.4. Chestnut forest 3.1.1.5. Beech forest 3.1.1.6. Hygrophilous riparian forest 3.1.1.7. Non-native broadleaves forest and/or plantation |
| 3.1.2. Coniferous forest | 3.1.2.1. Mediterranean pines forest 3.1.2.2. Mountain pines forest 3.1.2.3. Fir forest 3.1.2.4. Larch and/or arolla pine forest 3.1.2.5. Non-native conifer forest and/or plantation |
||
| 3.2.3. Sclerophyllous vegetation | 3.2.3.1. High shrublands 3.2.3.2. Low shrublands and garrigues |
Fig. 1 - The spatial analysis procedure developed to assess sensitivity to desertification of the different forest types occurring in Italy during the investigated time period.
The analysis of short-term (2000-2010) changes of the ESAI is justified by an intensification of environmental conditions leading to LD observed in the last decade (see [33] and references therein). Significant changes over time in land sensitivity to degradation were checked by using non-parametric inference (Mann-Whitney U test) testing at p < 0.001 after Bonferroni’s correction for multiple comparisons when appropriate. Effectiveness of the applied method has been also shown by Salvati et al. ([37]).
The analysis was carried out in four steps: (i) evaluating the degree and short-term changes of land sensitivity to degradation over the whole Italian territory; (ii) ranking the lands covered by the fourteen classes of forest and shrubland vegetation according to the ESAI score processed for different levels of spatial aggregation (national and by geographical divisions); (iii) estimating absolute and percent changes of ESAI by vegetation class along the study period; and (iv) comparing changes in forest sensitivity to degradation (i.e., changes in the ESAI by class) along the study period with changes in the level of sensitivity to degradation measured at the country/regional scale (see point i). A score difference (ESAIsc) was computed by subtracting the ratio of each class ESAI (ESAIc) to the average ESAI measured on a country scale (ESAIn) in 2010 with that calculated in 2000 (eqn. 1):
Results
Evaluating the degree and short-term changes of land sensitivity to degradation at national scale
The average ESAI score for the whole Italian territory has been stable around 1.36 between 2000 and 2010, corresponding to a medium level of sensitivity (Tab. 3). In southern Italy the average ESAI score reached sensitive areas levels: 1.4 in 2000 slightly decreasing to 1.382 in 2010, with local peaks of maximum ESAI reaching 1.7. The average ESAI score of northern and central Italy ranked these geographical divisions as medium-sensitive areas, in the investigated period, but increased at a higher rate compared with southern Italy, especially in northern Italy (+0.14%). Sensitive areas expanded between 2000 and 2010 in northern and central Italy, as tracked by the changes in maximum ESAI score (+ 0.10% and 0.13%, respectively). Finally, the widest ESAI range was found in southern Italy (0.573 in 2000 increasing to 0.588 in 2010), indicating the highest variability in the environmental conditions on a regional scale. Northern and central Italy showed a similar ESAI range in 2000 and comparable increase in the index during 2000-2010. Changes in the distribution of the ESAI scores were found significant in northern, central and southern Italy (Mann Whitney U test, p < 0.05), but not significant on a national scale (Mann Whitney U test, p > 0.10).
Tab. 3 - ESAI statistics in Italy by geographical region and year.
| Scores | Year | North | Center | South | Italy |
|---|---|---|---|---|---|
| Average ESAI score |
2000 | 1.329 | 1.345 | 1.4 | 1.362 |
| 2010 | 1.347 | 1.355 | 1.382 | 1.363 | |
| Annual change (%) | 0.14 | 0.07 | -0.13 | 0.01 | |
| Maximum ESAI score |
2000 | 1.615 | 1.626 | 1.713 | 1.713 |
| 2010 | 1.631 | 1.647 | 1.713 | 1.713 | |
| Annual change (%) | 0.1 | 0.13 | 0 | 0 | |
| ESAI range |
2000 | 0.507 | 0.501 | 0.573 | 0.605 |
| 2010 | 0.522 | 0.522 | 0.588 | 0.605 | |
| Annual change (%) | 0.3 | 0.42 | 0.26 | 0 |
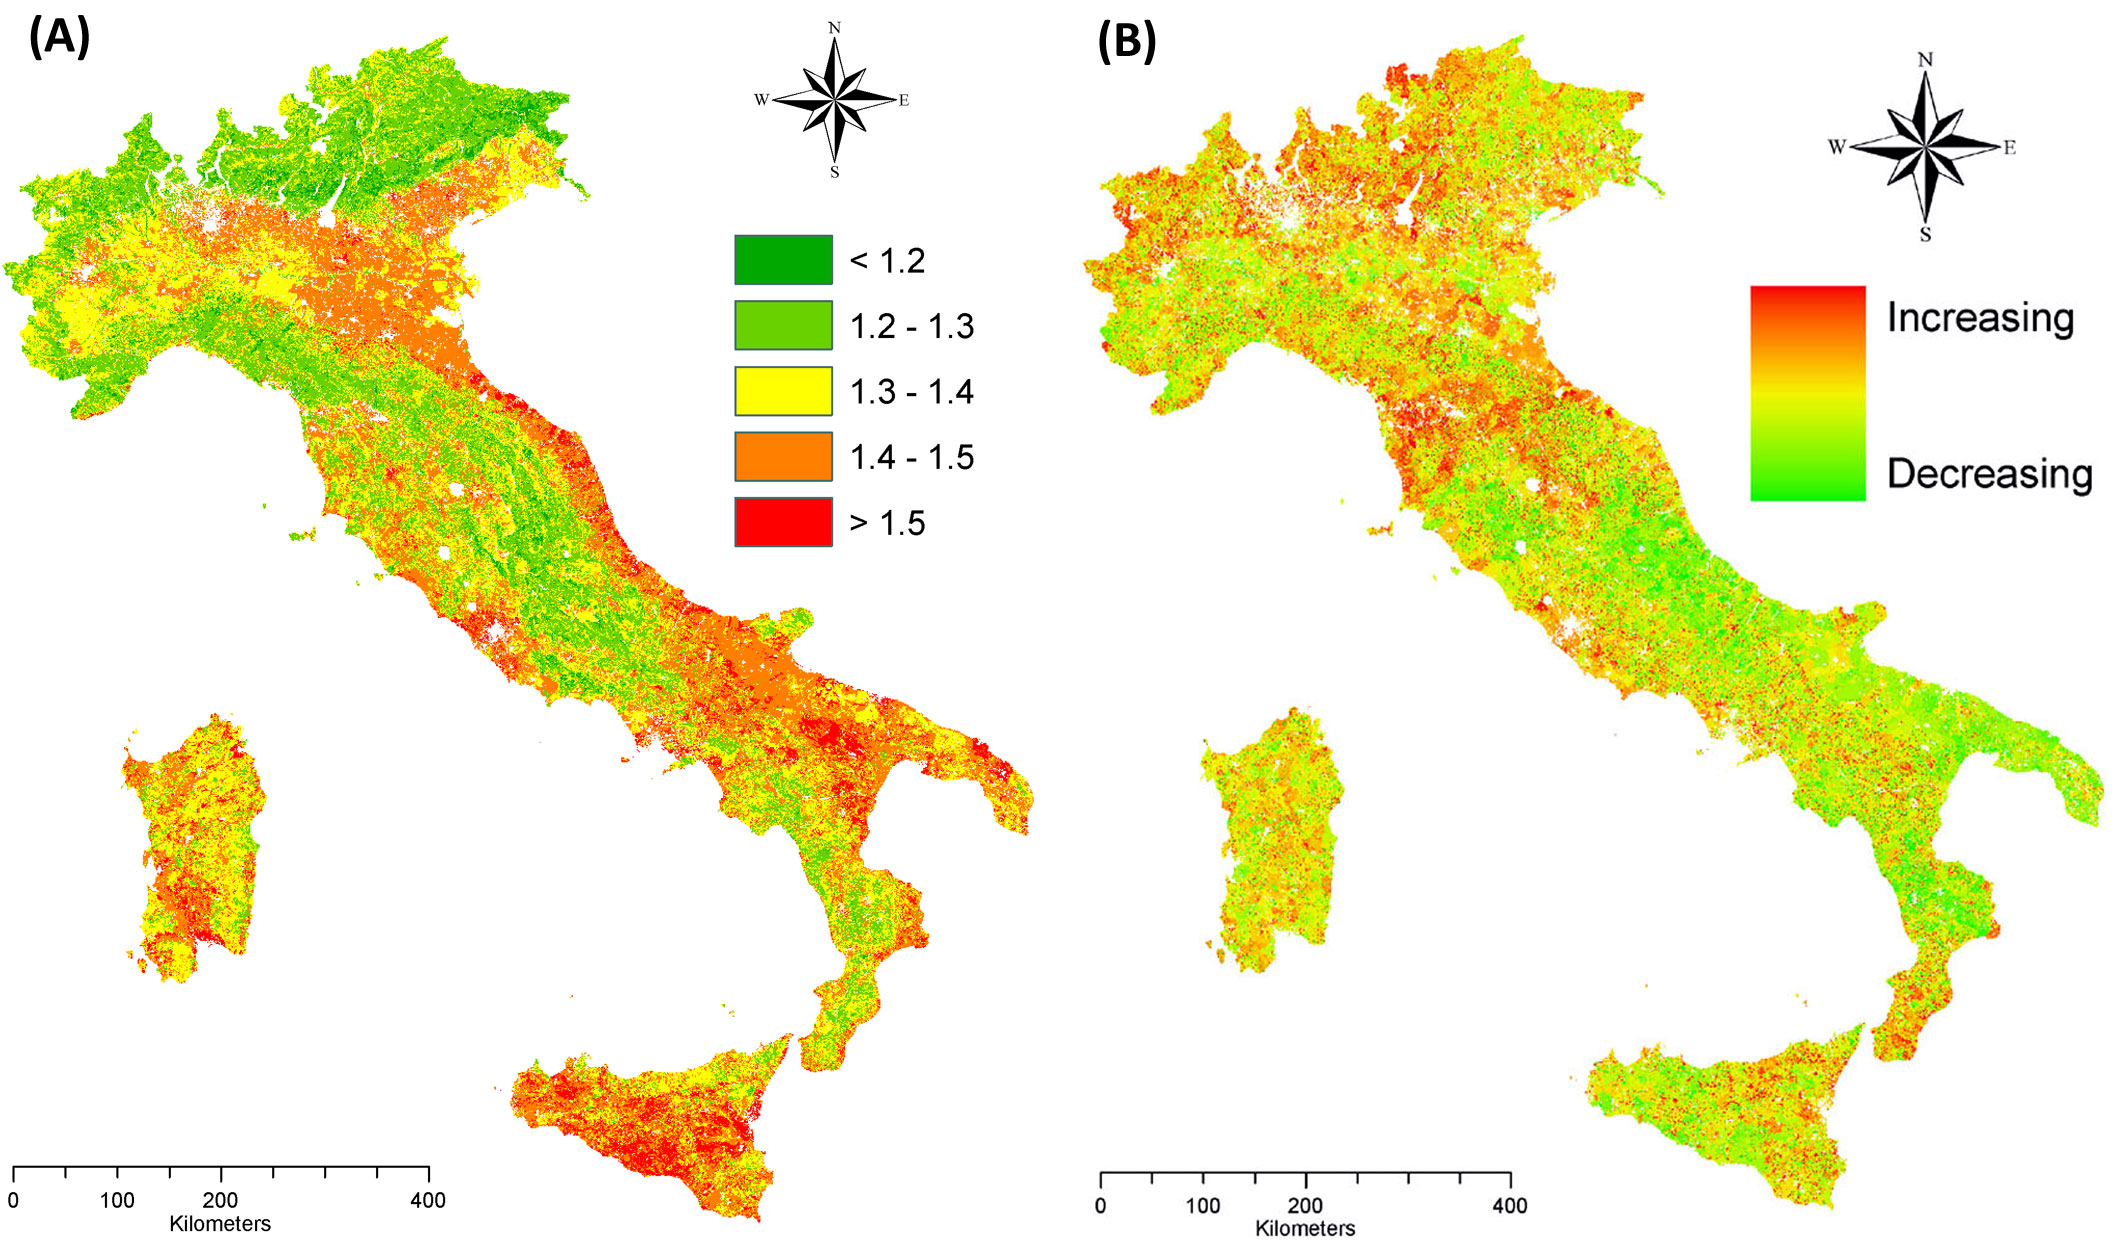
The spatial distribution of the ESAI in 2000 and changes during 2000-2010 are mapped in Fig. 2, which shows a certain contagion effect (sensu [31]). Overall results indicate that the most sensitive areas are located in southern Italy (Apulia, Sicily, flat areas in Basilicata and Sardinia), together with local areas in central Italy (flat and coastal areas along both the Adriatic and the Tyrrhenian sea) and northern Italy (a large part of the Po plain). The short-term increase in the ESAI showed a rather fragmented and heterogeneous spatial pattern with the highest increase along the Apennine mountains, Adige valley in Trentino Alto-Adige and flat areas of Veneto, Emilia Romagna and Tuscany, in Campania as well as in southern Calabria and northern Sicily.
Fig. 2 - Maps illustrating the spatial distribution of the ESAI in Italy (A: year 2000) and its change over time (B: ESAI trend 2000-2010).
Ranking sensitivity to land degradation under different forest and shrubland types (2000-2010)
The ESAI average values for all the classes of forest and sclerophyllous vegetation are lower than the national average score (1.36) both in 2000 and 2010 (Tab. 4). The highest observed degree of sensitivity (ESAI average > 1.30) is found in lands covered by six classes (in decreasing order): Mediterranean pine forests, low shrublands and garrigues, hygrophilous riparian forest, high shrublands, plantations of non-native species and evergreen oak forest. The maximum ESAI reflects the occurrence of sensitive areas in all forest types, with low shrublands and garrigues and evergreen oaks forest reaching locally the highest level of sensitivity to land degradation observed at national level (maximum ESAI ≥ 1.70). The widest variability in the ESAI scores (ESAI range > 0.6) is also found in low shrublands and garrigues. The ESAI score significantly increased from 2000 to 2010 in all examined vegetation classes (Mann Whitney U test, p < 0.05), except those dominated by native and non-native conifer species (Mann Whitney U test, p > 0.10).
Tab. 4 - Descriptive statistics of the ESAI by year and forest/shrubland type in Italy. (Max): Maximum value; (Range): difference between the maximum and the minimum ESAI score; (Mean): average ESAI score.
| Forest/shrubland type | ESAI 2000 | ESAI 2010 | ||||||
|---|---|---|---|---|---|---|---|---|
| Area (km2) |
Max | Range | Mean | Area (km2) |
Max | Range | Mean | |
| Beech forest | 9356 | 1.57 | 0.46 | 1.22 | 9103 | 1.58 | 0.48 | 1.23 |
| Larch and/or arolla pine forest | 2504 | 1.49 | 0.36 | 1.23 | 2423 | 1.44 | 0.31 | 1.23 |
| Fir forest | 6135 | 1.53 | 0.42 | 1.23 | 6028 | 1.53 | 0.41 | 1.24 |
| Mesophytic decidous mixed forest | 8239 | 1.60 | 0.50 | 1.25 | 8178 | 1.61 | 0.50 | 1.26 |
| Chesnut forest | 7165 | 1.63 | 0.52 | 1.26 | 7498 | 1.66 | 0.55 | 1.27 |
| Mountain pines forest | 2139 | 1.62 | 0.51 | 1.26 | 2094 | 1.61 | 0.50 | 1.27 |
| Decidous oaks forest | 20087 | 1.66 | 0.55 | 1.27 | 19841 | 1.69 | 0.57 | 1.28 |
| Evergreen oaks forest | 7351 | 1.68 | 0.55 | 1.30 | 7153 | 1.70 | 0.56 | 1.30 |
| Non-native conifer forest and/or plantation | 80 | 1.49 | 0.32 | 1.31 | 84 | 1.55 | 0.36 | 1.31 |
| Non-native broadleaves forest and/or plantation | 1462 | 1.69 | 0.58 | 1.31 | 1476 | 1.69 | 0.56 | 1.32 |
| High shrublands | 2689 | 1.64 | 0.49 | 1.32 | 2548 | 1.64 | 0.49 | 1.33 |
| Hygrophylous riparian forest | 697 | 1.62 | 0.49 | 1.32 | 673 | 1.65 | 0.51 | 1.34 |
| Low shrublands and garrigues | 6487 | 1.74 | 0.61 | 1.33 | 6818 | 1.80 | 0.67 | 1.34 |
| Mediterranean pines forest | 1785 | 1.66 | 0.55 | 1.34 | 1768 | 1.68 | 0.55 | 1.34 |
Disaggregation of ESAI statistics by the three geographical divisions of Italy provides further insights on spatial patterns of sensitivity to LD in areas covered by forests and shrublands and their dynamics over time (Tab. 5). The pool of “sensitive” vegetation types includes the six “sensitive” classes mentioned above in southern and in northern Italy, but only Mediterranean pine forests and hygrophilous riparian forest in central Italy. Interestingly, the average ESAI score of lands covered by shrublands in northern Italy reached in 2010 the range of sensitive areas. However, the highest level of sensitivity to LD observed at national level in areas covered by low shrublands and garrigues and evergreen oaks forests (maximum ESAI ≥ 1.70) is localized in southern Italy.
Tab. 5 - Descriptive statistics of the ESAI by geographical division, year and forest/shrubland type. (Max): Maximum value; (Range): difference between the maximum and the minimum ESAI score; (Mean): average ESAI score.
| Area | Forest/shrubland type | ESAI 2000 | ESAI 2010 | ||||||
|---|---|---|---|---|---|---|---|---|---|
| Evaluated area (km2) |
Max | Range | Mean | Evaluated area (km2) |
Max | Range | Mean | ||
| Northern Italy |
Beech forest | 4151 | 1.54 | 0.43 | 1.22 | 4114 | 1.56 | 0.45 | 1.23 |
| Larch and/or arolla pine forest | 2504 | 1.49 | 0.36 | 1.23 | 2422 | 1.44 | 0.31 | 1.23 | |
| Fir forest | 6029 | 1.53 | 0.42 | 1.23 | 5951 | 1.53 | 0.41 | 1.24 | |
| Mesophytic decidous mixed forest | 5527 | 1.60 | 0.50 | 1.25 | 5238 | 1.61 | 0.50 | 1.27 | |
| Mountain pines forest | 1091 | 1.62 | 0.51 | 1.26 | 1017 | 1.61 | 0.50 | 1.26 | |
| Chesnut forest | 3778 | 1.60 | 0.50 | 1.26 | 3820 | 1.62 | 0.52 | 1.27 | |
| Decidous oaks forest | 3869 | 1.65 | 0.54 | 1.27 | 3764 | 1.69 | 0.57 | 1.27 | |
| Non-native conifer forest and/or plantation | 6 | 1.40 | 0.22 | 1.27 | 4 | 1.42 | 0.20 | 1.34 | |
| Non-native broadleaves forest and/or plantation | 1080 | 1.65 | 0.54 | 1.30 | 1077 | 1.65 | 0.52 | 1.31 | |
| Evergreen oaks forest | 113 | 1.54 | 0.37 | 1.31 | 108 | 1.54 | 0.37 | 1.33 | |
| Hygrophylous riparian forest | 227 | 1.62 | 0.46 | 1.32 | 214 | 1.62 | 0.46 | 1.33 | |
| Mediterranean pines forest | 144 | 1.62 | 0.51 | 1.34 | 107 | 1.61 | 0.44 | 1.34 | |
| High shrublands | 14 | 1.56 | 0.40 | 1.35 | 40 | 1.59 | 0.44 | 1.39 | |
| Low shrublands and garrigues | 80 | 1.65 | 0.50 | 1.37 | 99 | 1.69 | 0.53 | 1.40 | |
| Central Italy |
Beech forest | 1984 | 1.46 | 0.35 | 1.22 | 1898 | 1.46 | 0.33 | 1.23 |
| Mesophytic decidous mixed forest | 1609 | 1.56 | 0.45 | 1.23 | 1794 | 1.55 | 0.42 | 1.24 | |
| Fir forest | 41 | 1.30 | 0.15 | 1.24 | 41 | 1.30 | 0.15 | 1.24 | |
| Mountain pines forest | 224 | 1.47 | 0.35 | 1.25 | 228 | 1.47 | 0.34 | 1.26 | |
| Chesnut forest | 2169 | 1.63 | 0.51 | 1.25 | 2336 | 1.66 | 0.52 | 1.26 | |
| Decidous oaks forest | 8591 | 1.64 | 0.51 | 1.26 | 8594 | 1.69 | 0.57 | 1.27 | |
| Non-native broadleaves forest and/or plantation | 104 | 1.56 | 0.42 | 1.26 | 104 | 1.56 | 0.40 | 1.28 | |
| Evergreen oaks forest | 2040 | 1.56 | 0.43 | 1.27 | 2025 | 1.56 | 0.43 | 1.27 | |
| High shrublands | 288 | 1.55 | 0.40 | 1.27 | 231 | 1.56 | 0.42 | 1.28 | |
| Non-native conifer forest and/or plantation | 9 | 1.37 | 0.17 | 1.27 | 11 | 1.55 | 0.33 | 1.32 | |
| Low shrublands and garrigues | 368 | 1.60 | 0.47 | 1.29 | 294 | 1.60 | 0.47 | 1.29 | |
| Hygrophylous riparian forest | 238 | 1.53 | 0.41 | 1.31 | 163 | 1.55 | 0.40 | 1.31 | |
| Mediterranean pines forest | 334 | 1.60 | 0.47 | 1.31 | 326 | 1.60 | 0.47 | 1.31 | |
| Southern Italy |
Beech forest | 3221 | 1.57 | 0.45 | 1.23 | 3091 | 1.58 | 0.46 | 1.24 |
| Mesophytic decidous mixed forest | 1103 | 1.59 | 0.47 | 1.25 | 1146 | 1.59 | 0.47 | 1.26 | |
| Fir forest | 65 | 1.38 | 0.22 | 1.26 | 36 | 1.37 | 0.21 | 1.27 | |
| Chesnut forest | 1218 | 1.60 | 0.45 | 1.27 | 1342 | 1.64 | 0.49 | 1.29 | |
| Mountain pines forest | 824 | 1.57 | 0.45 | 1.28 | 849 | 1.59 | 0.46 | 1.29 | |
| Decidous oaks forest | 7627 | 1.66 | 0.54 | 1.28 | 7483 | 1.68 | 0.56 | 1.29 | |
| Non-native conifer forest and/or plantation | 65 | 1.49 | 0.30 | 1.31 | 69 | 1.49 | 0.31 | 1.31 | |
| Evergreen oaks forest | 5198 | 1.68 | 0.55 | 1.31 | 5020 | 1.70 | 0.56 | 1.32 | |
| High shrublands | 2387 | 1.64 | 0.48 | 1.33 | 2277 | 1.64 | 0.47 | 1.34 | |
| Low shrublands and garrigues | 6039 | 1.74 | 0.58 | 1.33 | 6425 | 1.80 | 0.66 | 1.34 | |
| Mediterranean pines forest | 1307 | 1.66 | 0.51 | 1.34 | 1335 | 1.68 | 0.53 | 1.35 | |
| Hygrophylous riparian forest | 232 | 1.60 | 0.47 | 1.34 | 296 | 1.65 | 0.51 | 1.37 | |
| Non-native broadleaves forest and/or plantation | 278 | 1.69 | 0.50 | 1.36 | 295 | 1.69 | 0.51 | 1.36 | |
Changes in the distribution of the ESAI score between 2000 and 2010 show also differences across the country; significant increases were found for all the forest types (Mann Whitney U test, p < 0.05) except for (Mann Whitney U test, p > 0.10):
- forests dominated by native conifers in northern Italy;
- evergreen oaks forests, hygrophilous riparian forests, Mediterranean pines, fir forests and low shrublands and garrigues in central Italy;
- non-native broadleaved and conifer forest and plantations in southern Italy.
Comparing changes in forest sensitivity to degradation with changes in sensitivity to degradation at the regional scale
Fig. 3 illustrates a change detection analysis (2000-2010) for the ESAI score observed for each forest type compared with the same score dynamics observed on a national/regional level. This analysis indicates that various forest types experienced lower increases in the ESAI compared to the respective values observed for the whole landscape, but with a heterogeneous pattern observed at the regional scale. The classes experiencing a higher rate of increase of the ESAI than that observed in the landscape are:
Fig. 3 - Normalized score difference (2000-2010) between forest class ESAI and landscape ESAI calculated for each forest type and geographical division. (A): northern Italy; (B): central Italy; (C): southern Italy.
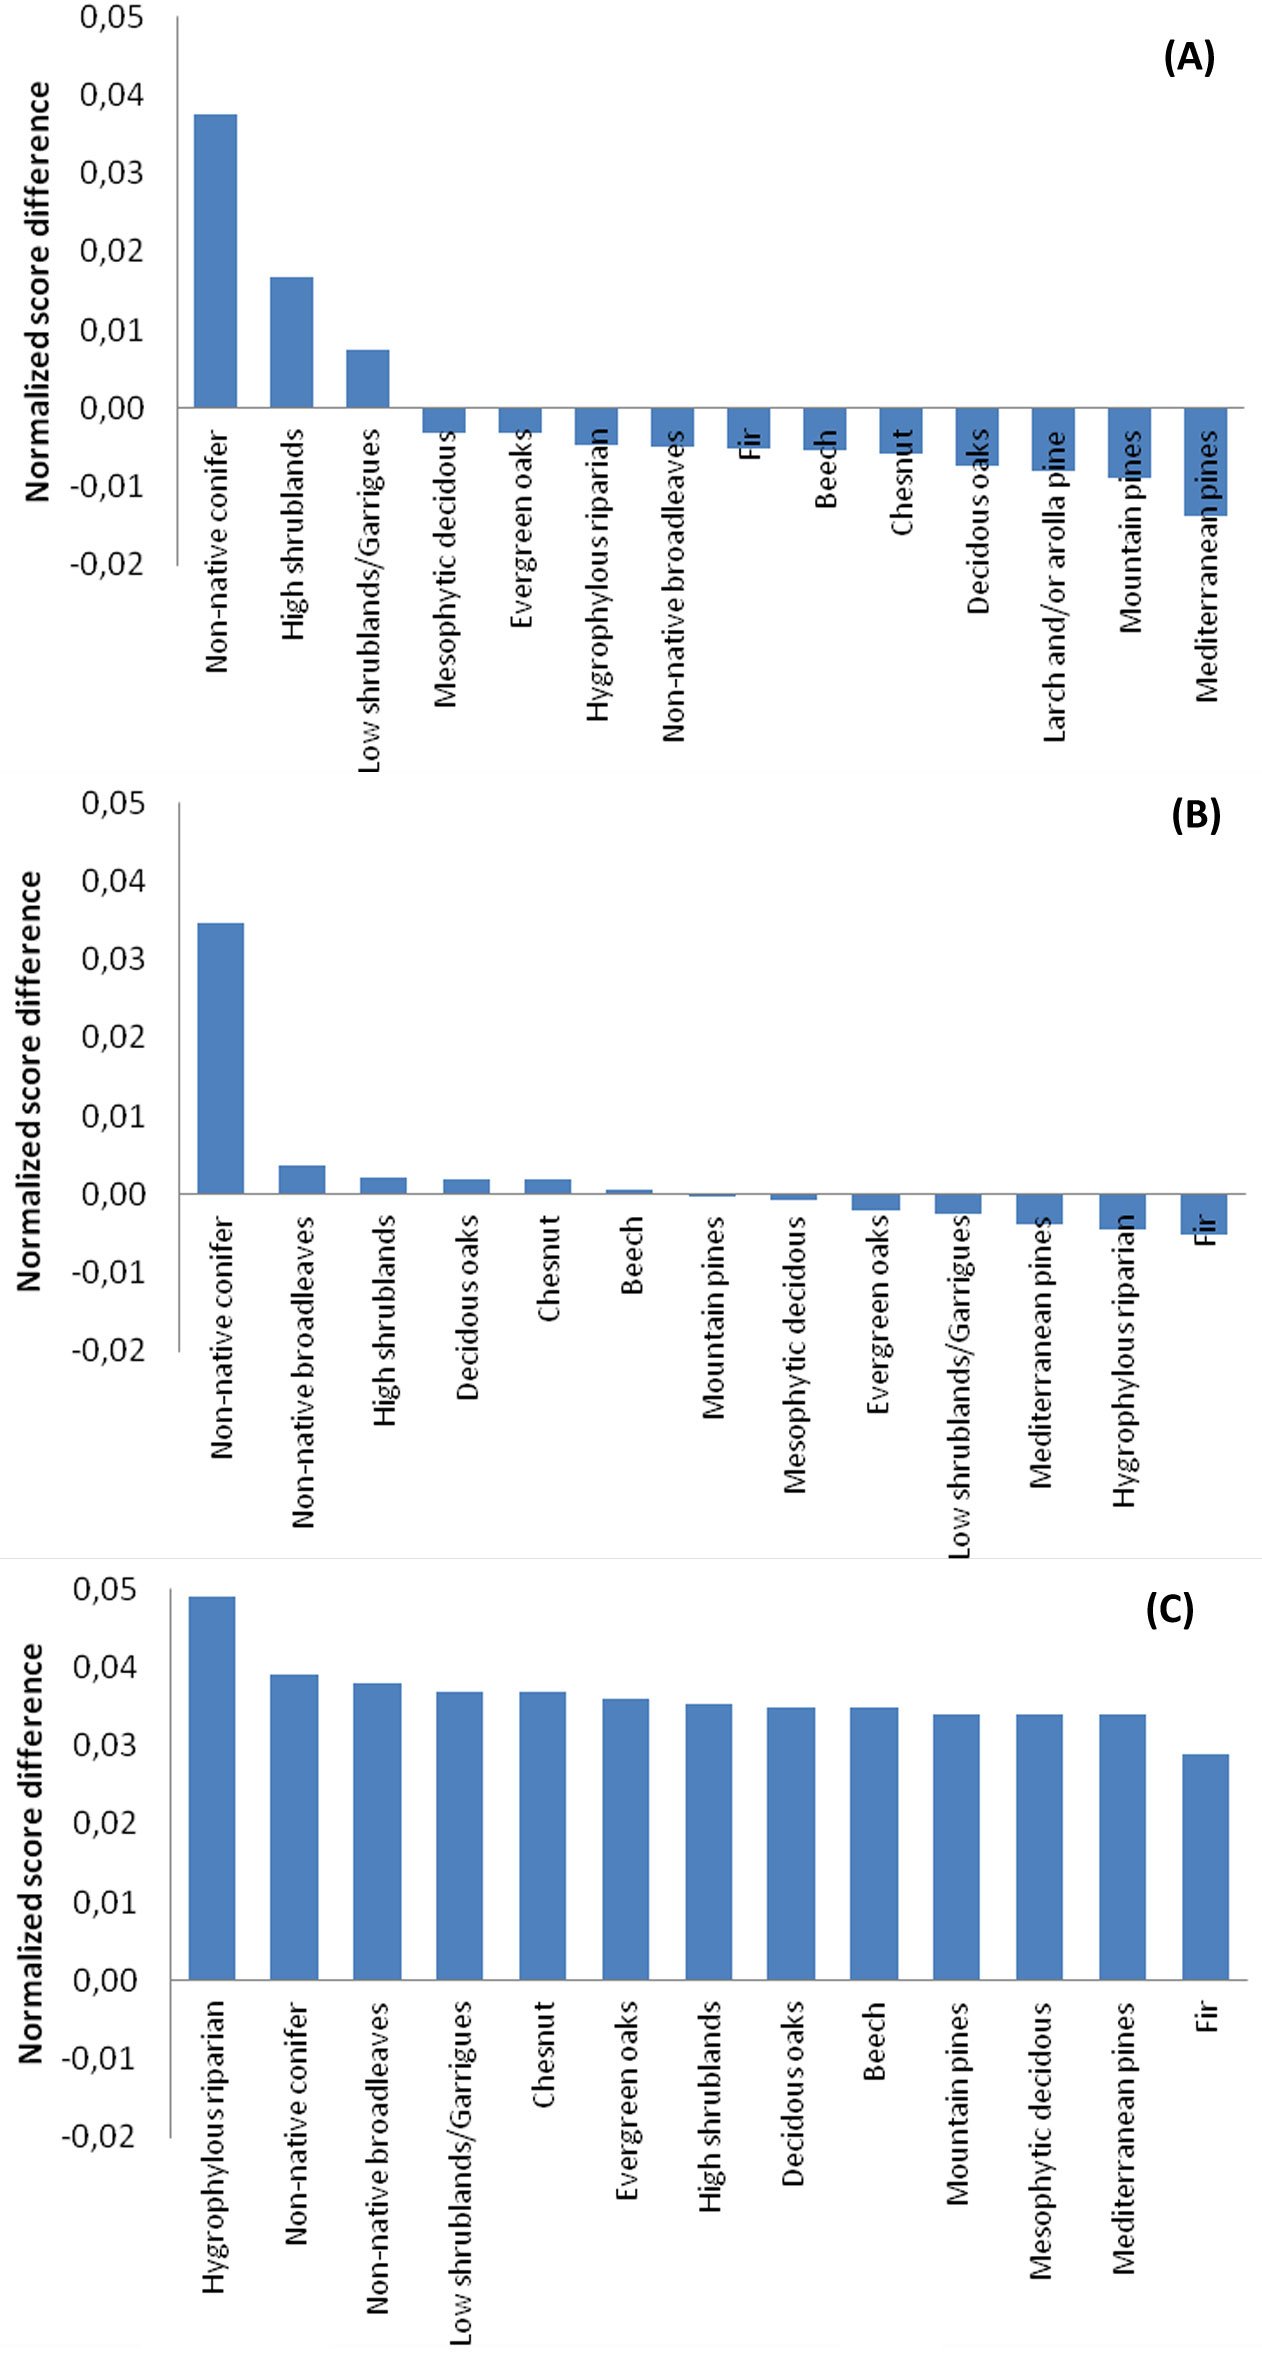
- in northern Italy: non-native conifers, high/ low shrublands and garrigues;
- in central Italy: non-native forests, high shrublands, deciduous oaks forests and chestnut forests;
- in southern Italy: all classes, with the highest normalized score difference found for hygrophylous riparian forests, non-native forests.
Discussion
Prevention or mitigation of land degradation is a crucial issue for the sustainable management of forest and OWL in dryland regions of Italy ([10], [11], [13]). The present study proposed a methodology to map and rank sensitivity to LD of areas covered by forests and shrublands in Italy. It also seeks out to assess variation in sensitivity levels over time as a contribution to understanding of complex landscape-forest interactions in Mediterranean dry ecosystems, possibly leading to LD processes. Although the geographical distribution of sensitive areas has been recently expanding in Italy (Fig. 2), it seems clear that areas covered by forest and shrublands are, to a large extent, ranked as medium sensitivity areas. This finding confirms the positive role of forest and other wooded lands for preventing LD in the Mediterranean region ([11]), but at the same time is an early warning indicator for forest and rangeland management. Taken together, results indicate a clear picture where the most sensitive lands are covered by native vegetation types adapted to dry climates and low-quality soils (e.g., low and high shrublands, Mediterranean pines and evergreen oaks forests) or forest and plantations of non-native species and riparian vegetation located in flat and internal lowland areas exposed to anthropogenic stressors (e.g., land-use change, pollution, high population density).
Not surprisingly, critical areas are associated to low shrublands and garrigues that are, most likely, degraded successional stages of former Mediterranean forest types, like evergreen oak forests and Mediterranean pine forests. Prevention from further degradation in these Mediterranean forests must nowadays cope with cumulative disturbances, like short-term wildfire recurrence ([4]).
Another interesting finding is the convergence of the six “sensitive” vegetation classes in northern and southern Italy. This result might be explained by the substantial increase of the average ESAI in northern Italy, due to the reduction of rainfall amounts and increasing population density ([33]); conversely in southern Italy, slight improvements in the ESAI conditions have been occurring in the last years ([37]), in turn linked with natural forestation ([13], [28]) and a slowly declining human pressure on land (e.g., reduced population density due to land abandonment) in marginal rural districts ([34]).
As far as increases in the ESAI are concerned, forest dominated by native coniferous species appear, on a national scale, less affected than other vegetation types. On the other hand, worsening of the climatic and socioeconomic driving factors leading to LD, which occurred in coastal and flat areas of northern and central Italy and in scattered areas of southern Italy (Fig. 2), might explain the disproportionately high increase of the ESAI score between 2000 and 2010, especially for plantations of non-native species and shrublands (Fig. 3).
Conclusions
The ESAI approach is considered one of the most reliable proxy to map areas that are (or might be) affected by LD processes and should be protected through dedicated management measures implemented in the framework of the National Action Plans to combat desertification. The Mediterranean area is recognized as an especially vulnerable region to land degradation and global climate change and that this issue cannot be underestimated by the scientific and policy making community ([26], [33], [39]).
In order to target preventive and mitigation measures in forest and shrublands, however, field-based indicators of land degradation should be collected to validate ESAI assessments ([11]), eventually combined with remotely sensed monitoring of forest conditions ([12]). LD monitoring would be particularly crucial in areas experiencing rapid changes in climate quality (e.g., reduced precipitation rates over a relatively short time or recurrent drought episodes, intense rainfall events, continuous increase in summer temperatures causing vegetation stress, etc.) and cumulative environmental pressures (e.g., repeated burning, fragmentation of forest land at the urban-wildland interface). Specific prevention and mitigation strategies should be implemented according to local socioeconomic and environmental contexts, e.g., by identifying homogeneous local districts as suggested by Salvati & Zitti ([34]).
The diverging results derived from the analysis carried out in the three Italian regions corroborate this finding. The implementation of Regional Action Plans (actually enforced in law in some Italian administrative regions) could definitely address the urgent need for context-based policies ([32]). Preventing the fragmentation of forest land, protection of forest from mega-fires or repeated burning and overgrazing and the conversion from coppice to high stands are all potentially effective measures for the mitigation of LD processes and should be considered in Regional Action Plans as a contribution to sustainable land management practices.
Acknowledgments
This work was partially carried out under the research project “Development of innovative models for multi-scale monitoring of ecosystem services indicators in Mediterranean forests”, funded by the FIRB2012 program of the Italian Ministry of University and Research (project coordinator: F. Lombardi). The Authors are deeply grateful to two anonymous reviewers who helped to significantly improve the manuscript.
References
CrossRef | Gscholar
Gscholar
Gscholar
Gscholar
CrossRef | Gscholar
Gscholar
CrossRef | Gscholar
Online | Gscholar
Online | Gscholar
Gscholar
Online | Gscholar
Authors’ Info
Authors’ Affiliation
Anna Barbati
Department for Innovation in Biological, Agro-food and Forest Systems, University of Tuscia, v. S. Camillo de Lellis, I-01100 Viterbo (Italy)
Consiglio per la Ricerca e la sperimentazione in Agricoltura, Center for the Study of Plant-Soil Interactions (CRA-RPS), v. della Navicella 2-4, I-00184 Rome (Italy)
Consiglio per la Ricerca e la sperimentazione in Agricoltura, Forestry Research Centre (CRA-SEL), v.le S. Margherita 80, I-52100 Arezzo (Italy)
School of Agricultural, Forest, Food and Environmental Sciences, University of Basilicata, v. dell’Ateneo Lucano 10, I-85100 Potenza (Italy)
Corresponding author
Paper Info
Citation
Salvati R, Salvati L, Corona P, Barbati A, Ferrara A (2015). Estimating the sensitivity to desertification of Italian forests. iForest 8: 287-294. - doi: 10.3832/ifor1111-008
Academic Editor
Emanuele Lingua
Paper history
Received: Aug 22, 2013
Accepted: May 06, 2014
First online: Aug 26, 2014
Publication Date: Jun 01, 2015
Publication Time: 3.73 months
Copyright Information
© SISEF - The Italian Society of Silviculture and Forest Ecology 2015
Open Access
This article is distributed under the terms of the Creative Commons Attribution-Non Commercial 4.0 International (https://creativecommons.org/licenses/by-nc/4.0/), which permits unrestricted use, distribution, and reproduction in any medium, provided you give appropriate credit to the original author(s) and the source, provide a link to the Creative Commons license, and indicate if changes were made.

Web Metrics
Breakdown by View Type
Article Usage
Total Article Views: 63209
(from publication date up to now)
Breakdown by View Type
HTML Page Views: 53600
Abstract Page Views: 3414
PDF Downloads: 4754
Citation/Reference Downloads: 34
XML Downloads: 1407
Web Metrics
Days since publication: 4278
Overall contacts: 63209
Avg. contacts per week: 103.43
Article Citations
Article citations are based on data periodically collected from the Clarivate Web of Science web site
(last update: Mar 2025)
Total number of cites (since 2015): 10
Average cites per year: 0.91
Publication Metrics
by Dimensions ©
Articles citing this article
List of the papers citing this article based on CrossRef Cited-by.
Related Contents
iForest Similar Articles
Research Articles
Classification and mapping of Spanish Mediterranean mixed forests
vol. 12, pp. 480-487 (online: 14 October 2019)
Research Articles
Establishment of a planted field with Mediterranean shrubs in Sardinia and its evaluation for climate mitigation and to combat desertification in semi-arid regions
vol. 2, pp. 77-84 (online: 10 June 2009)
Technical Reports
Hot spot maps of forest presence in the Mediterranean basin
vol. 9, pp. 766-774 (online: 13 June 2016)
Review Papers
Climate change impacts on spatial distribution, tree-ring growth, and water use of stone pine (Pinus pinea L.) forests in the Mediterranean region and silvicultural practices to limit those impacts
vol. 14, pp. 104-112 (online: 01 March 2021)
Research Articles
Availability and evaluation of European forest soil monitoring data in the study on the effects of air pollution on forests
vol. 4, pp. 205-211 (online: 03 November 2011)
Research Articles
Factors of soil CO2 emission in boreal forests: evidence from Central Siberia
vol. 16, pp. 86-94 (online: 19 March 2023)
Research Articles
Evergreen species response to Mediterranean climate stress factors
vol. 9, pp. 946-953 (online: 07 July 2016)
Research Articles
Perceptions of forest experts on climate change and fire management in European Mediterranean forests
vol. 7, pp. 33-41 (online: 14 October 2013)
Research Articles
Soil fauna communities and microbial activities response to litter and soil properties under degraded and restored forests of Hyrcania
vol. 14, pp. 490-498 (online: 11 November 2021)
Research Articles
Application of indicators network analysis to support local forest management plan development: a case study in Molise, Italy
vol. 5, pp. 31-37 (online: 27 February 2012)
iForest Database Search
Search By Author
Search By Keyword
Google Scholar Search
Citing Articles
Search By Author
Search By Keywords
PubMed Search
Search By Author
Search By Keyword


