Monitoring of damage from cedar shoot moth Dichelia cedricola Diakonoff (Lep.: Tortricidae) by multi-temporal Landsat imagery
iForest - Biogeosciences and Forestry, Volume 7, Issue 2, Pages 126-131 (2014)
doi: https://doi.org/10.3832/ifor1014-007
Published: Jan 13, 2014 - Copyright © 2014 SISEF
Research Articles
Abstract
In this study defoliation damage in Taurus cedar (Cedrus libani A. Rich) stands in Turkey (Isparta region) caused by cedar shoot moth (Dichelia cedricola Diakonoff - Lep.: Tortricidae) was examined using multi-temporal Landsat data. Undamaged, low-damaged and heavily-damaged areas were located by assessing the variation of the Normalized Difference Vegetation Index derived from satellite imagery. Threshold boundaries for different damage levels were defined using mean NDVI values obtained from sub-areas spanning over the whole range of NDVI values. The reliability of the classification based on damages was statistically tested by comparing mean annual ring widths measured on increment cores extracted from sample trees exposed to different damage levels. Significant differences were found in mean annual ring widths among different areas previously classified based on NDVI data. Mean annual ring width in 2001 (an outbreak year) was 1.64 mm for undamaged area, 1.04 mm for low-damaged area, and 0.54 mm for heavily-damaged area. These findings indicate that damage mapping and monitoring mass damage caused by insect defoliation in Taurus cedar stands can be performed remotely by using NDVI values and Landsat TM data.
Keywords
Insect Defoliation, Remote Sensing, Dichelia cedricola, Landsat
Introduction
Taurus cedar (Cedrus libani A. Rich) is economically and ecologically one of the most important tree species in Turkey, occurring in both naturally regenerated stands and plantations ([6]). This species has reached its largest natural distribution in the Mediterranean region of Anatolia, covering a large area on the Taurus Mountains and providing significant environmental and social benefits as well as high-quality timber and other forest products. Taurus cedar forests cover a total area of 417 188 ha in Turkey, with a current standing volume of approximately 27.4 million m3 and an annual growth of almost 600 000 m3 ([2]). Hughes et al. ([15]) indicated that precipitation is the most important limiting factor on the growth of Taurus cedar trees in the Mediterranean region.
The most common pests of Taurus cedar forests in Turkey are the cedar leaf moth, Acleris undulana Walsingham (Lep.: Tortricidae), and the cedar bark beetle, Orthotomicus tridentatus Egger (Col.: Curculionidae). Another important pest is the cedar shoot moth, Dichelia cedricola Diakonoff (Lep.: Tortricidae), an insect spread all over the western Mediterranean region that can cause significant outbreaks - albeit rarely - in some cedar forests of this area ([3], [4], [5]). D. cedricola is a monovoltine species with adults flying in mid-June ([3]). Initially the larvae feed on needles but then sprouts are also remarkably damaged. The larvae hatch in July and reach their maximum activity in two periods: (a) in summer until November (autumn feeding period); and (b) between April and May (spring feeding period). In the latter period, insects may affect trees more seriously, and especially during the outbreaks trees may be completely defoliated by late May / June.
We monitored the population dynamics of D. cedricola since 1998, when it was first discovered in Kapidag cedar forest, which is also the area studied in this investigation. The infestation area was surveyed regularly in May and June every year, recording population density of the moth, outbreak status and conditions of the infested stands. For 4 consecutive years, between 1998 and 2001, the moth caused outbreaks of varying intensity, whereas the population reached a steady state in 2003. In 2001, when the most intense outbreak occurred, some parts of the forest showed heavily-damaged stands with totally defoliated trees. However, low-damaged and undamaged stands were also detected in the same forest. In the following years, the insects continued to affect the same areas - though to a lesser extent - also during non-epidemic periods.
During an outbreak, larvae feed on tree needles and sprouts making possible to analyse the impact of defoliation using remote sensing data. Severe damage to leaf tissues or total defoliation significantly decrease the reflectance rate in the near-infrared region of the electromagnetic spectrum ([17]). Furthermore, it is possible to identify the mass damage in the stand by means of the Landsat Thematic Mapper (TM), which has a medium spatial resolution ([20], [12], [22], [13], [9]). Besides, the multispectral satellite data such as Spot HRV (High Resolution Visible - [19], [26]) and Modis ([11]), hyperspectral and high spatial resolution remote sensing data such as Compact Airborne Spectrographic Imager (CASI-2 - [25]), and aerial photographs ([28], [1]) were also used in scientific studies for insect damage analysis.
In this study, defoliation damage caused by D. cedricola in cedar forests was examined by using multi-temporal Landsat data. Undamaged, low-damaged and heavily-damaged areas were located by assessing the variation of the Normalized Difference Vegetation Index (NDVI) derived from satellite data. The reliability of the classification based on damages was statistically tested by comparing mean annual ring widths measured on increment cores extracted from sample trees exposed to different damage levels.
Material and Methods
Study area
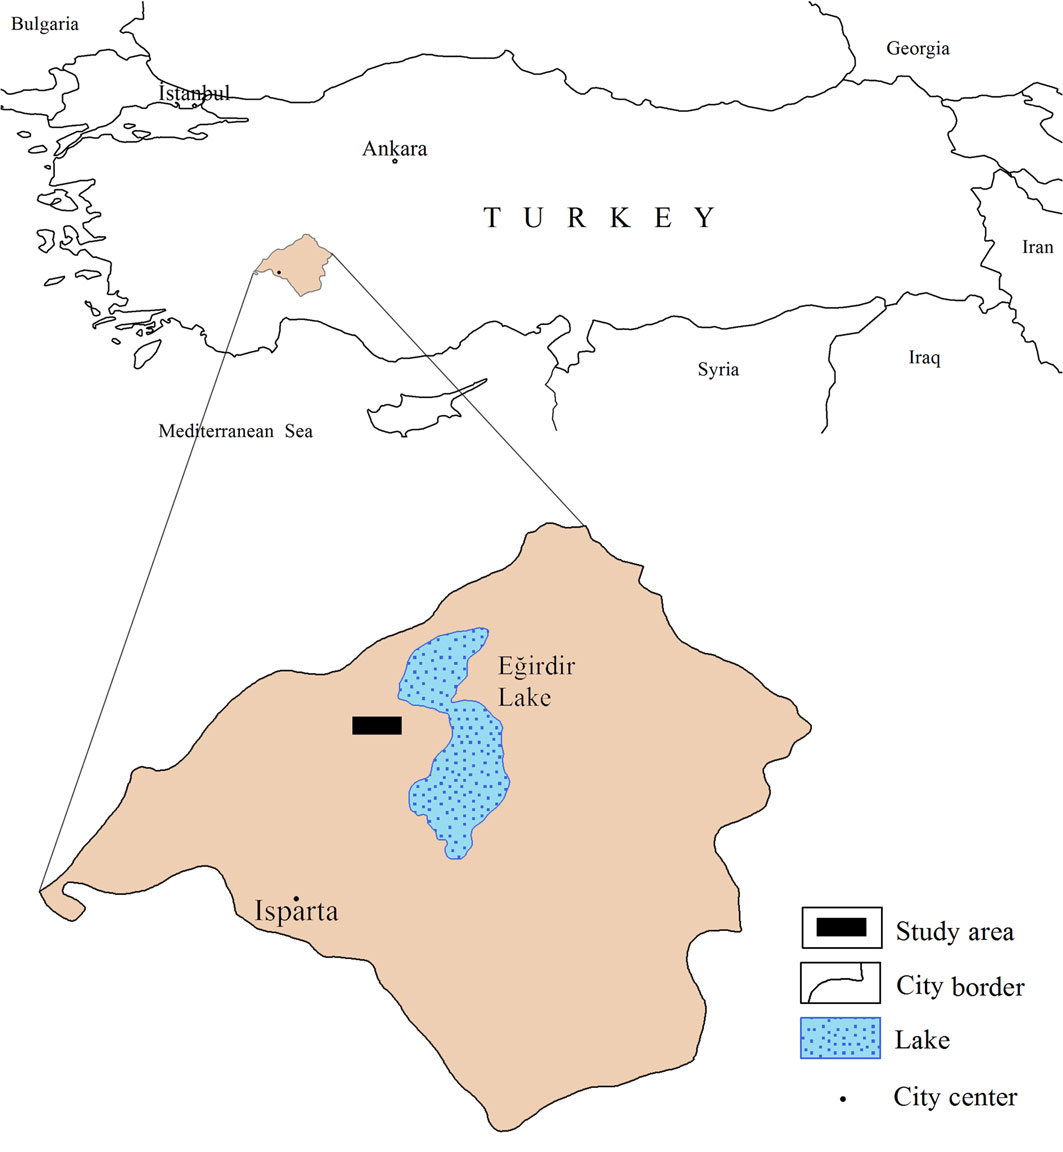
The study was carried out in the Kapidag cedar forest, a protected natural area located 70 km from Isparta province (38.08°-38.10° N, 30.67°- 30.75° E), west of Egirdir Lake (Fig. 1). The forest grows between 1300-1900 m a.s.l., mainly north-faced, with a mean slope of about 40%. The total area of the forest, excluding the masked area, was 580 hectares. Taurus cedar is the dominant tree species in the study area. Pure cedar stands have a crown closure of at least 70%.
Fig. 1 - Location of the study area.
Dataset
Multi-temporal Landsat dataset downloaded from United States Geological Survey website (⇒ http://earthexplorer.usgs.gov) and forest inventory data were used. Such inventory data consists of graphical layers (e.g., stand boundaries, forest roads and rivers, and attributes such as tree species, period of development, and crown closure) re-presenting the forest status in 1997. Dataset, was available in a digital format fully compatible with the ArcGIS software.
The Landsat7-ETM+ (Enhanced Thematic Mapper) image (Path 178, Row 34) dated 5 June 2001 (when the outbreak occurred) was corrected geometrically with the root-mean square error (RMSE) value less than 0.3 pixels using a 1/25 000 scale topographic map. The Erdas Imagine software (version 2011) was used to process raster data such as satellite image. Based on the corrected image, Landsat4-TM (01 June 1988) and Landsat5-TM (19 June 2009) images were georeferenced using the image-to-image registration technique. In order to analyze the vegetation dynamics, NDVI data were used. Song et al. ([24]) suggested to apply the atmospheric correction algorithm to reduce the atmospheric effects on the NDVI signals. Atmospheric dispersion had a non-linear impact with high effect on visible bands and low effect on infra-red bands. In order to minimize the atmospheric effects, the improved Image-Based DOS (Dark Object Subtraction) Model was applied to the image dated 5 June 2001. Using this method the digital information of the image may be converted to surface reflectance values with high accuracy ([8], [18]). “Multiple-date Image Normalization Using Regression” method was applied for the radiometric synchronization between the atmospherically corrected image and the other image data ([16]).
The NDVI data were obtained by using the red (band 3rd) and near-infrared (band 4th) bands of the radiometrically corrected images ([21]). Healthy green plants usually reflect 40-50% of the infra-red wavelengths (0.7-1.1 μm), while plant chlorophyll absorbs approximately 80-90% of the energy in the visible (0.4-0.7 μm) part of the electromagnetic spectrum. The reflectance values fall down in the infrared region if the plants either have partially-damaged green tissues or are dead ([16]). By using NDVI such reflectance variations of the plants may be detected more easily.
A subset of NDVI data, which was large enough to cover the study area, was considered. In the subset images, open areas such as roads, streams and rocks and mixed stands were masked using the stand type and topographic maps.
Image data processing
Stands damaged by the insect outbreak were clearly detectable from the NDVI data (NDVI5) obtained from the image dated 5 June 2001 (Fig. 2). Pixels representing the damaged areas are indicated by near-black gray because the NDVI values fell down. Moreover, a transition zone was observed between the undamaged and the heavily- damaged areas. Based on field observation, insect population started to increase in 1998 and reached its peak in 2001. It was also observed that during the outbreak stands were affected to varying extents.
Fig. 2 - NDVI5 sub-areas and sample points where the increment cores were extracted.
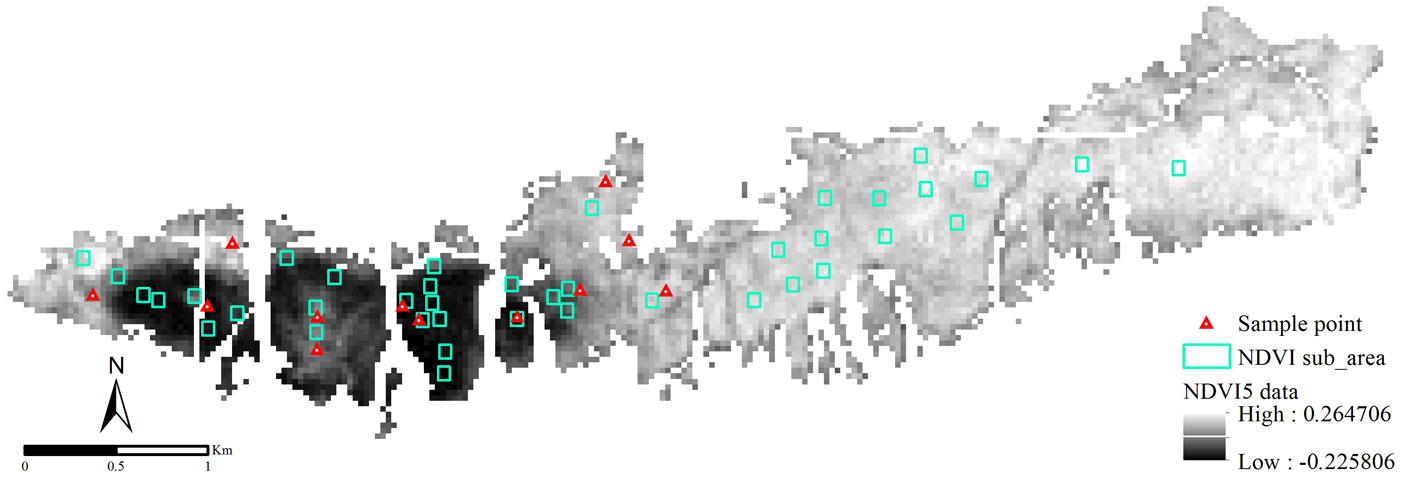
Based on ground-truth and NDVI data, stands in the study area were classified into three categories: undamaged (UD), low-damaged (LD) and heavily-damaged (HD) areas. Damage-level thresholds were set as follows: the NDVI5 data that had pixel values ranging from 0.26 to -0.23 was divided into three groups: greater that 0; from 0 to -0.115; and from -0.115 to -0.23 (see Fig. 3). Some 40 points were randomly selected over the studied area, with a minimum of 10 points in each group. For each point, an NDVI sub-area covering a total of 9 pixels was considered, including the selected point and its 8 surrounding pixels (Fig. 2). The mean NDVI values were calculated for the NDVI sub-areas in the ArcGIS environment. At that stage, some points were displaced manually in order to keep the NDVI sub-areas within the same pixel groups. The NDVI sub-areas identified on NDVI5 were transferred onto the other NDVI data used in this study. Changes occurring in the green vegetation of trees exposed to the outbreak were also analyzed (Fig. 3).
Fig. 3 - Mean NDVI values of the NDVI sub-areas and threshold boundaries for different damage levels.
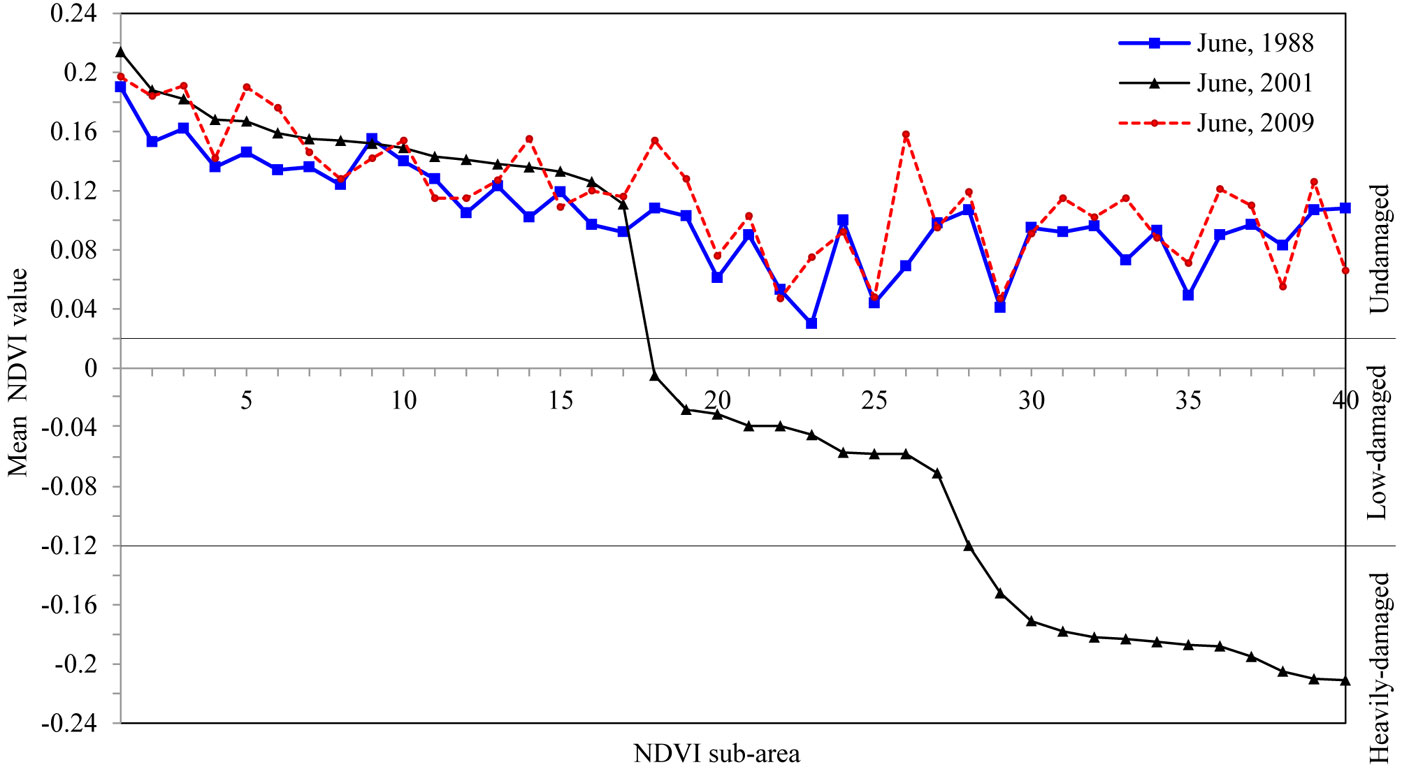
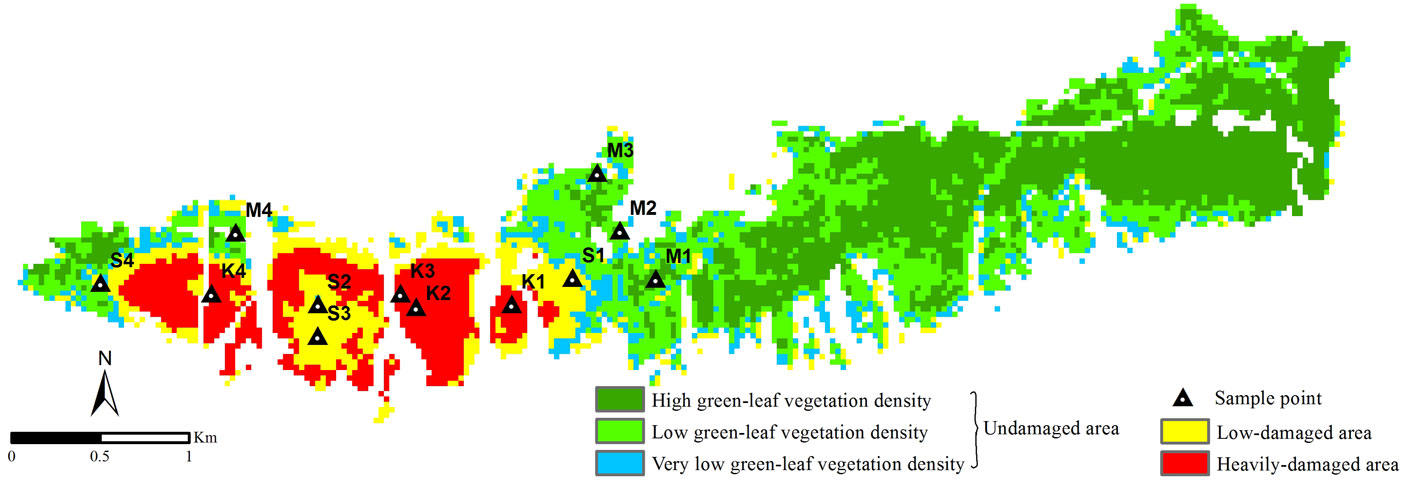
The NDVI data varied depending on the density of the green-leaf vegetation in the stand. Holben ([14]) stated that high and low-density changes affect the NDVI data similarly. Based on a similar approach, we classified the pixels in the range 0.13-0.26 as high green-leaf vegetation density, and pixels in the range 0.06-0.13 as low green-leaf vegetation density. As some of the values lower than 0.06 still belonged to the green-leaf vegetation, various thresholds were tested with an interval of 0.01. At that stage, the categories classified according to each threshold were overlapped with the inventory data, the NDVI data from other years without an outbreak (1988 and 2009) and the high spatial resolution images on Google Earth®, and then they were checked. Furthermore, information obtained from ground observations was also assessed. In summary, it was found that the range from 0.06 to 0.02 consisted of the pixels that had very low green-leaf vegetation density. The pixels were adjacent to the masked roadside and streamside as well as the open areas such as the bare soil and rocks. The rest of the NDVI5 values were mostly negative. As the study was carried out only on pixels representing the totally green-leaf vegetation, it was assumed that pixels with negative values were exposed to the insect outbreak. For that reason, the NDVI values’ range from 0.02 to -0.23 was divided into two parts: the range from 0.02 to -0.12 represented the low-damaged area (LD), the range from -0.12 to -0.23 represented the heavily-damaged area (HD), while the range from 0.26 to 0.02 represented the undamaged areas (UD). According to that classification, the mean NDVI values of the non-epidemic years 1988 and 2009 fell in the undamaged level (Fig. 3). NDVI5 values for year 2001 were re-coded according to the above thresholds and all the pixels were consequently classified in the above categories.
Four different sample plots were randomly distributed in each damage class. The coordinates of sample plots were installed in the Garmin GPSMAP® 62s hand-held GPS (Global Positioning System) receiver.
Field and laboratory studies
In autumn 2012, an increment core was extracted at breast height from each of ten cedar trees sampled in each sample plot. Cores were labeled and sealed in plastic bags to preserve moisture and prevent shrinkage.
Habitat characteristics of the chosen sample plots were assumed to be similar. As suggested by Carus & Avci ([7]), if non-host and host areas responded in a similar manner to climatic variations, then the differences between standardized ring chronologies of non-host and host trees would primarily reflect non-climatic environmental variations, such as the effects of the insect damage.
Plots were arbitrarily selected over the whole studied area in order to span the whole range of variation of cedar in terms of age, stand density and site characteristics. Sample trees were selected within each plot from both dominant and co-dominant crown class. Trees having multiple stems, broken tops, cankers or crooked boles were excluded from sampling. Total height of each sampled tree was measured to the nearest 0.05 m. Diameter outside bark (dob) at breast height (1.3 m) was measured and recorded to the nearest 0.3 cm. Descriptive statistics for sampled trees in sample plots are reported in Tab. 1.
Tab. 1 - Descriptive statistics for sampled trees. (SD): standard deviation; (dob): diameter outside bark.
| Damage level | Measured properties | Mean | SD | Min. | Max. |
|---|---|---|---|---|---|
| Undamaged | Diameter (D - dob, cm) | 28.06 | 5.61 | 20.1 | 43.9 |
| Total height (H, m) | 11.72 | 4.42 | 8.5 | 13.5 | |
| Age (years) | 56 | 7.89 | 40 | 71 | |
| Low-damaged | Diameter (D - dob, cm) | 24.58 | 4.2 | 17.2 | 33.8 |
| Total height (H, m) | 11.45 | 5.01 | 7.5 | 13 | |
| Age (years) | 56 | 5.36 | 44 | 69 | |
| Heavily-damaged | Diameter (D - dob, cm) | 23.99 | 4.21 | 16.9 | 36.6 |
| Total height (H, m) | 10.85 | 4.46 | 8 | 12 | |
| Age (years) | 57 | 4.68 | 45 | 67 |
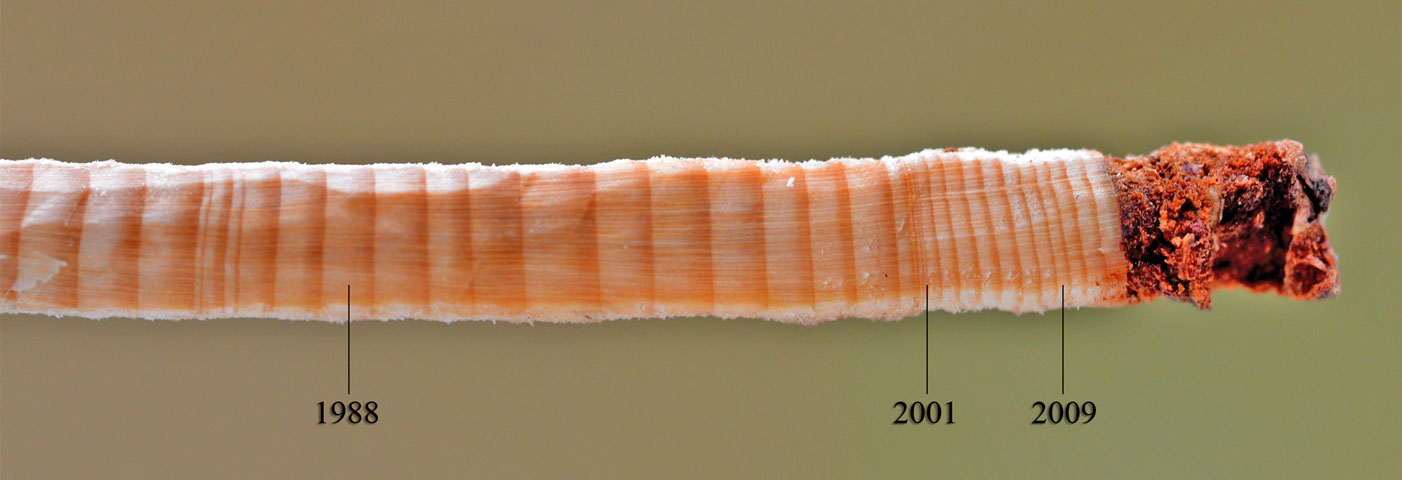
Annual ring widths of 40 increment cores extracted from 4 sample plots for each damage level identified on the NDVI5 image were measured to the nearest 0.01 mm using a stereomicroscope (Fig. 4). Overall, 120 increment cores were measured for the three different damage classes. All cores consisted of approximately 40 annual growth rings, the most reliable chronologies spanning over the period 1970-2012. In this study, only the mean annual ring widths in the year 2001 were taken into consideration.
Fig. 4 - Annual rings on increment core from heavily-damaged sample plot. Ring width was extremely narrow for the year 2001.
Differences among defoliation classes in annual ring widths in 2001 were tested by one-way analysis of variance. Mean values were compared using the Tukey’s range test (α = 0.05) to detect possible differences between different defoliation levels and non-defoliation group. All statistical analyses were performed using the software package SPSS® version 11.0.
Results
Image pixels of the studied area were classified as the undamaged, low-damaged and heavily-damaged classes according to the prefixed thresholds based on NDVI data (Fig. 5). In summary, 73% of the forest was found to be undamaged, 14% to be low-damaged, while 13% was found to be heavily-damaged. Misclassification was observed for some pixels belonging to the low-damaged area, previously classified as undamaged. Combining the visual interpretation of images and ground-level information data, misclassified pixels were located near high rocky slopes without vegetation, where the stand crown closure was poor and the soil exposed to erosion because of steep inclination. The above pixels had a total surface area of 18 hectares, representing about 23% of the pixels classified in this category. The error rate of the heavily-damaged area was approx. 0.2%.
Fig. 5 - NDVI5 data classified according to the density of the insect damage. (M): undamaged; (S): low-damaged; (K): heavily-damaged sample plots.
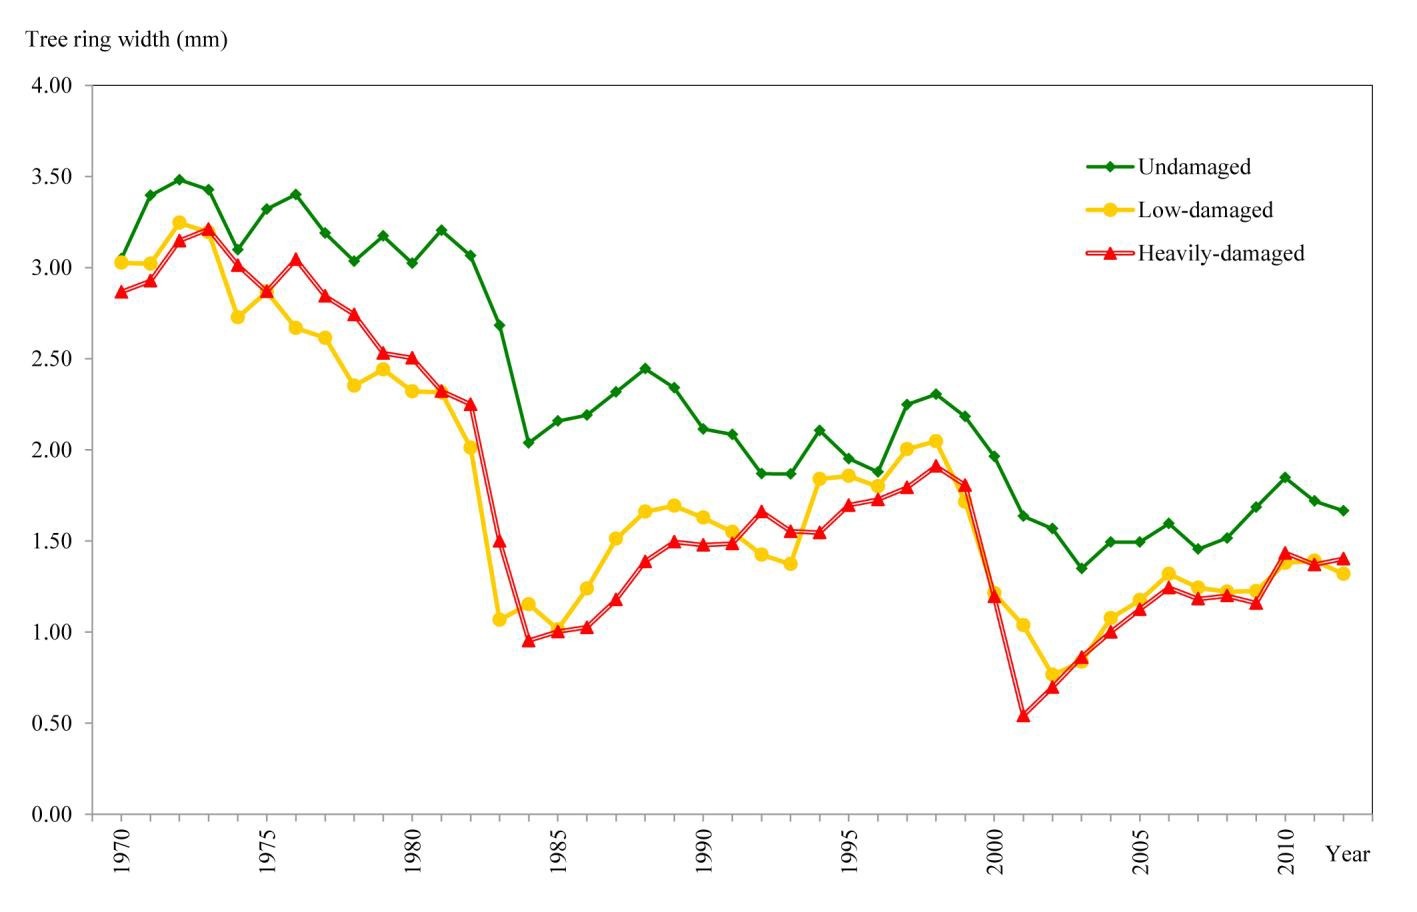
The effect of the insect defoliation on wood increments before, during and after the outbreak is shown in Fig. 6. Mean annual ring widths were 0.54 mm for heavily-damaged areas, 1.04 mm for low-damaged areas and 1.64 mm for undamaged areas (Tab. 2). The above mean values are fairly in accordance to the degree of tree defoliation inferred from satellite images.
Fig. 6 - Mean values of annual tree ring width calculated from 40 trees at each damage level.
Tab. 2 - Summary statistics and comparison of severity of defoliation for radial growth. (SD): Standard deviation; (df): degree of freedom.
| Summary statistics | |||||
|---|---|---|---|---|---|
| Groups | Sample size |
Sum | Mean (mm) |
SD (mm) |
Variance (mm) |
| Undamaged (1) | 40 | 65.411 | 1.6353 | 0.586 | 0.343 |
| Low-damaged (2) | 40 | 41.496 | 1.0374 | 0.404 | 0.163 |
| Heavily-damaged (3) | 40 | 21.679 | 0.5420 | 0.327 | 0.107 |
| ANOVA | |||||
| Source of variance | Sum of square |
df | Mean square |
F | p-value |
| Among Groups | 23.976 | 2 | 11.988 | 58.596 | <0.001 |
| Within Groups | 23.936 | 117 | 0.205 | - | - |
| Total | 47.912 | 119 | - | - | - |
| Tukey’s range test | |||||
| Group comparisons | Difference | Confidence limits (95%) |
p-value | ||
| 1-2 | 0.5978 | 0.3976-0.7982 | <0.05 | ||
| 1-3 | 1.0933 | 0.8930-1.2936 | <0.05 | ||
| 2-3 | 0.4954 | 0.2553-0.7355 | <0.05 | ||
Significant differences in mean annual ring width among the three defoliation classes (UD, LD, HD) were found after ANOVA (p<0.001 - Tab. 2). As expected, defoliated cedar trees showed the greatest decreases in growth.
When compared with the year 2001, the mean annual ring widths of the consecutive 11 years increased by 14% in the low-damaged trees and by 112% in the heavily-damaged trees and decreased by 3% in the undamaged trees.
Discussion
Damage caused by the D. cedricola outbreak in Taurus cedar stands in Turkey was identified by means of the Landsat TM bands. According to the NDVI data obtained from the satellite image of 2001, defoliation of the stands was analyzed by classifying the pixels into three different categories. The slight decrease in the mean annual ring widths of the undamaged trees in 11 years after defoliation may be due to an age-related decrease in the increment, as well as to changes in the climatic conditions. On the other hand, increased growth as the insect population diminished was observed especially for trees that were more heavily affected by the outbreak. However, considering that the general ecological and climate conditions affected the entire study area in the same way, such changes should also affect the increment rates of the damaged stands. Between 1970 and 2012 the wood increment in the damaged stands was always lower than those of the undamaged stands; this may be due to the presence of insect populations in these areas.
Extensive damages to forest trees caused by insects have been previously assessed using Landsat TM data ([20], [22]). In this study, the accuracy of classification based on NDVI5 data diminished in isolated locations and in mixed forests. High spatial resolution and hyperspectral data can also help in locating isolated damaged areas, as well as increase the accuracy of damage classification ([25]).
Previous studies used vegetation indexes or other measures to examine canopy defoliation caused by a variety of insects ([13], [1]). Landsat multi-temporal images have been proven to help in the detection of actual insect defoliation, although their use in mixed stands still present some uncertainty. Heterogeneity of forest tree species also limits the ability of medium resolution remote sensors in determining insect damage ([27], [23], [10]). Nevertheless, in this study Landsat images provided detailed and accurate information of the insect epidemic occurring in the monitored homogenous forest. In general, high spatial resolution data, such as QuickBird, WorldviewII etc, are preferred for the identification of small clusters of defoliated trees. However, the relative costs, availability and processing requirements of the various data sources are all important considerations for the end-user ([27]). Indeed, the use of Landsat data is more cost-effective and less time-consuming than other conventional methods.
In conclusion, the use of Landsat bands may be considered a useful and reliable tool to map and monitor insect damage occurring in cedar stands. With respect to specific thresholds to map insect damage, we found that pixels representing damaged areas had NDVI values lower than 0. Based on the analysis of the increment cores, significant differences between the annual ring widths of trees exposed to different damage levels were observed. These findings indicate that damage mapping can be performed remotely by using NDVI values.
Acknowledgments
We thank Selçuk Kütük and Umut Akbulut, students of Süleyman Demirel University Faculty of Forestry, for providing assistance during the field studies; and master’s students Serdar Göktepe and Mustafa Önder Ersin. We have been indebted to Prof. M. Dogan Kantarci (Faculty of Forestry, Istanbul University) for his valuable recommendations.
References
Gscholar
Gscholar
Gscholar
Gscholar
Gscholar
Gscholar
Gscholar
Online | Gscholar
CrossRef | Gscholar
Authors’ Info
Authors’ Affiliation
Ramazan Özçelik
Mustafa Avci
Faculty of Forestry, Süleyman Demirel University, East Campus, 32260, Isparta (Turkey)
Corresponding author
Paper Info
Citation
Çoban HO, Özçelik R, Avci M (2014). Monitoring of damage from cedar shoot moth Dichelia cedricola Diakonoff (Lep.: Tortricidae) by multi-temporal Landsat imagery. iForest 7: 126-131. - doi: 10.3832/ifor1014-007
Academic Editor
Massimo Faccoli
Paper history
Received: Apr 22, 2013
Accepted: Oct 13, 2013
First online: Jan 13, 2014
Publication Date: Apr 02, 2014
Publication Time: 3.07 months
Copyright Information
© SISEF - The Italian Society of Silviculture and Forest Ecology 2014
Open Access
This article is distributed under the terms of the Creative Commons Attribution-Non Commercial 4.0 International (https://creativecommons.org/licenses/by-nc/4.0/), which permits unrestricted use, distribution, and reproduction in any medium, provided you give appropriate credit to the original author(s) and the source, provide a link to the Creative Commons license, and indicate if changes were made.

Web Metrics
Breakdown by View Type
Article Usage
Total Article Views: 55263
(from publication date up to now)
Breakdown by View Type
HTML Page Views: 46252
Abstract Page Views: 2971
PDF Downloads: 4299
Citation/Reference Downloads: 70
XML Downloads: 1671
Web Metrics
Days since publication: 4537
Overall contacts: 55263
Avg. contacts per week: 85.26
Article Citations
Article citations are based on data periodically collected from the Clarivate Web of Science web site
(last update: Mar 2025)
Total number of cites (since 2014): 4
Average cites per year: 0.33
Publication Metrics
by Dimensions ©
Articles citing this article
List of the papers citing this article based on CrossRef Cited-by.
Related Contents
iForest Similar Articles
Research Articles
Afforestation monitoring through automatic analysis of 36-years Landsat Best Available Composites
vol. 15, pp. 220-228 (online: 12 July 2022)
Review Papers
Remote sensing-supported vegetation parameters for regional climate models: a brief review
vol. 3, pp. 98-101 (online: 15 July 2010)
Review Papers
Accuracy of determining specific parameters of the urban forest using remote sensing
vol. 12, pp. 498-510 (online: 02 December 2019)
Research Articles
Effects of artificial defoliation and simulated insect damage on the growth of Betula pendula saplings
vol. 9, pp. 95-100 (online: 15 July 2015)
Research Articles
Assessing water quality by remote sensing in small lakes: the case study of Monticchio lakes in southern Italy
vol. 2, pp. 154-161 (online: 30 July 2009)
Research Articles
Sensitivity analysis of RapidEye spectral bands and derived vegetation indices for insect defoliation detection in pure Scots pine stands
vol. 10, pp. 659-668 (online: 11 July 2017)
Review Papers
Remote sensing of selective logging in tropical forests: current state and future directions
vol. 13, pp. 286-300 (online: 10 July 2020)
Research Articles
Influence of soil and topography on defoliation intensity during an extended outbreak of the common pine sawfly (Diprion pini L.)
vol. 10, pp. 164-171 (online: 19 November 2016)
Research Articles
Estimation of aboveground forest biomass in Galicia (NW Spain) by the combined use of LiDAR, LANDSAT ETM+ and National Forest Inventory data
vol. 10, pp. 590-596 (online: 15 May 2017)
Technical Reports
Detecting tree water deficit by very low altitude remote sensing
vol. 10, pp. 215-219 (online: 11 February 2017)
iForest Database Search
Search By Author
Search By Keyword
Google Scholar Search
Citing Articles
Search By Author
Search By Keywords
PubMed Search
Search By Author
Search By Keyword


