Influence of soil and topography on defoliation intensity during an extended outbreak of the common pine sawfly (Diprion pini L.)
iForest - Biogeosciences and Forestry, Volume 10, Issue 1, Pages 164-171 (2016)
doi: https://doi.org/10.3832/ifor2069-009
Published: Nov 19, 2016 - Copyright © 2016 SISEF
Research Articles
Abstract
Insect herbivore disturbances are likely to intensify as a consequence of climate change. In Finland, outbreaks of the common pine sawfly (Diprion pini L.), which feeds on Scots pine (Pinus sylvestris L.) needles, and resulting damage to forests have already increased. Although drivers of sawfly outbreak dynamics have been investigated, the effects of topography and soil fertility have not been fully elucidated. We studied the effect of elevation, slope and soil properties (carbon and nitrogen contents, C/N ratio, pH, texture and horizon thicknesses) on the defoliation intensity of 28 plots (227-531 m2), located in a 34.5 km2 forested area in eastern Finland suffering from an extended outbreak of D. pini. Plot elevation and slope (relative relief 35 m, maximum elevation 200 m a.s.l.) were derived from a digital elevation model and the soil properties from samples of the humus layer (Of+Oh), (Ah+)E and B horizons of podzol profiles. Defoliation was greater on the more fertile and flatter sites than on less fertile and steeper sites, but independent of elevation. The soil property most strongly correlated to plot mean defoliation was the C/N ratio of the humus layer (Spearman’s ρ = -0.68). However, logistic modelling showed that the thickness of the (Ah+)E-horizon had the highest classification accuracy in predicting the probability of a plot having moderate to severe (>20%) defoliation. Our study showed that forest damage caused by D. pini was related to topography and soil fertility. Taking these factors into account could help in understanding the population dynamics of D. pini, in modeling of insect outbreaks and in forest management planning.
Keywords
Introduction
Changes in climate have already been shown to affect the outbreak severity ([15]) and shift in the range of defoliating insects ([4]), and thereby alter the functioning of forest ecosystems. In addition to climate, defoliator populations are regulated by a range of biotic and abiotic factors, including natural enemies ([29]), topography ([27]) and soil ([38]). Their impacts and interactions with each other are, however, only partly known.
Forest defoliator damage and performance have been shown to be related to elevation, slope and aspect. Elevation not only acts as a physical boundary limiting the distribution of defoliators and host trees but it also affects local climatic conditions (temperature, precipitation, wind speed and radiation) and influences insect physiology and performance ([19]). Natural enemy abundance and host-species nutritional value and distribution can also vary with elevation and have an impact on defoliator tree damage and insect performance ([46], [39], [17], [27]). Steep, especially south to west-facing slopes, are generally drier, warmer and have more nutrient deficient conditions than other slopes, and can result in more stressed host trees and possibly more favorable local climates and habitats for defoliators ([44], [27]). However, damage by defoliators has also been found to be higher on flat areas compared to steeper slopes ([28]) and sapsucking insects have been shown to favor north-northwest-facing slopes ([25]).
Soil fertility affects the nutritional value of the foliage and production of defense compounds by host trees and therefore has an important indirect effect on defoliator performance and related tree damage. Several studies have suggested that trees growing on poorer sites are more prone to defoliator-caused damage compared to trees growing on more fertile sites ([33], [45]). Greater defoliator performance and higher damage intensity have been associated with coarser soil texture ([8], [38]) and thin soil A-horizons ([20]), both indicating poor soil fertility ([6]). Fertilization experiments have shown that an increase in soil fertility has a positive effect on defoliator performance ([43]). However, other fertilization experiments have shown a negative effect ([33]) or no effect ([5]) on defoliator performance. Tree foliage nitrogen (N) and carbon (C) contents relate to both their nutritional value ([34], [13]), which can benefit insect performance, and to the production of defense compounds such as C-based monoterpenes ([3]) and phenolics ([13]) and N-based alkaloids ([2]), which can repel insects. For example, Scots pine (Pinus sylvestris L.) needle N contents increase with soil N contents ([5], [50]), which have also been shown to affect the contents of secondary defense compounds ([5], [22]). In addition, predators and parasitoids of defoliators have been shown to be affected by site fertility ([14], [18]).
The common pine sawfly (Diprion pini L., Hymenoptera: Diprionidae) is distributed throughout Europe and northern Africa ([12]). Until the 1990’s the species caused only small-scale defoliation of P. sylvestris in Finland ([51]). In 1997, D. pini populations reached outbreak densities in western Finland and the outbreak started to spread eastwards ([51]). By 2001, this largest insect-driven forest damage in the Finnish forest health records, had spread over an area of ca. 500 000 ha ([36]). Consumption of all of the needle year-classes by D. pini reduces the photosynthesizing leaf area, leading to decreased tree growth ([37], [36]) and mortality if the needle consumption continues over many consecutive years ([37]). In Finland the economic losses of reduced tree growth and mortality related to D. pini has been estimated to be 93-530 US$ ha-1 depending on defoliation intensity ([36]). Overall, sawfly outbreaks seem to be more frequent and severe on monoculture, even-aged and plantation stands, compared to forests with several tree species, age classes and layers ([12], [40]). In Scandinavia, the performance of pine sawflies and the frequency, intensity and spatial extent of damage has been related to temperature ([30]) and host plant quality, especially needle carbohydrate and terpene concentrations ([32], [34], [30]). In addition, site and stand characteristics, such as site type and stand age ([33], [51], [45]), and natural enemies ([14], [29]) have been observed to modify sawfly performance and affect the level of tree damage. However, the effects of topography and soil properties on sawfly outbreaks have received little attention. A better understanding of the relationship between pine sawfly outbreak intensity and these abiotic factors would improve our ability to identify sites prone to pine sawfly outbreaks.
In this study we investigated the spatial variation in the severity of defoliation by D. pini in managed P. sylvestris stands in eastern Finland. The overall aim was to determine the extent to which the level of defoliation was related to topographical features (elevation and slope) and various chemical and physical properties of the surface organic layer and underlying mineral soil. Our specific objectives were: (1) to determine the variation in P. sylvestris defoliation by D. pini; (2) to determine a number of topographic parameters and soil physical and chemical properties; and (3) to investigate the relationships between these abiotic factors and defoliation. According to our knowledge, this is the first study investigating the effects of topographic characteristics and soil properties on D. pini related defoliation of P. sylvestris in Fennoscandian boreal forest ecosystems.
Material and methods
Research area
The study was carried out in Palokangas, a forested area of 34.5 km2 located in the municipality of Ilomantsi (62° 52′ N, 30° 56′ E), eastern Finland. D. pini has caused severe damage to the managed P. sylvestris dominated forests in the area since 1999. Although having a typical eruptive population dynamic, the local D. pini population has in some parts of the area adopted a chronic outbreak pattern with high population levels. At its most extensive range (beginning of 2000’s), the outbreak area covered ca. 10 000 ha ([23], [53]). Changes in the D. pini population and resulting tree damage intensity within the study area have been monitored annually since 2000 ([51]).
The soils in the study area are mainly podzols and developed in moraine and glaciofluvial deposits. The surface organic layer is a mor type. According to the Cajanderian site type classification ([42]), which describes site productivity and soil fertility, the area is dominated by rather poor Vaccinium type (VT) and poor Calluna type (CT) site types with the ground vegetation consisting mainly of lingonberry (Vaccinium vitis-idaea L.), heather (Calluna vulgaris L. Hull), blueberry (Vaccinium myrtillus L.), mosses, and occasional lichens. The mean annual temperature and precipitation for the study area in the period 1981-2010 were 2-3 °C and 650-700 mm, respectively ([47]).
Sample plots and stand inventory
The study was carried out on 28 circular sampling plots located throughout the study area. The radius of the plots varied between 8.5 and 13 m, resulting in an average of 24 trees on each plot. As part of a larger project ([23], [24], [53]), eleven of the plots were established in 2002 and 17 in 2007. The locations of the plots were chosen subjectively to ensure that the range in defoliation intensity levels within the study area was covered. The plots were established in even-aged P. sylvestris dominated stands, with occasional Norway spruce (Picea abies L.), silver birch (Betula pendula Roth), aspen (Populus tremula L.) and juniper (Juniperus communis L.) also present. Most (26) of the plots were located on poor CT site types and two plots on somewhat more fertile VT site types. Tree and plot-wise characteristics were inventoried in May and June 2010. The coordinates of the plot centers were determined using a Trimble Pro XH-GPS® device (Sunnyvale, CA, USA). All the trees on each plot were located by measuring distance and azimuth from the plot center and classified into hierarchy classes: dominant, co-dominant, or suppressed. The diameter at breast height (dbh) of all trees having a dbh > 5.6 cm was measured and tree height of every third tree and that of the median tree in each hierarchy class measured (7-8 sampling trees per plot).
The level of defoliation of all the P. sylvestris trees was visually estimated into percentage defoliation classes according to Eichhorn et al. ([9]), except we used 10% defoliation classes rather than 5% classes. Accordingly, the defoliation intensity of each tree was assessed by comparing the foliage density of the upper two thirds of the tree crown (i.e., that part of the crown not influenced by shading from other trees) to an imaginary healthy tree growing on the same site type and at the same canopy cover layer. Trees with 100% defoliation level corresponded to dead trees and trees with 0% defoliation had no symptoms of insect defoliation. The plot-wise mean defoliation intensity was calculated as the average defoliation level of the dominant and co-dominant trees on the plot. Suppressed trees were excluded because their defoliation may be due to shading and competition for nutrients. For logistic reasons the defoliation assessment of 17 of the plots was carried out in autumn 2009 and that of the remaining 11 plots in spring 2010. However, as the D. pini larvae feed in July-September, the defoliation situation of autumn 2009 corresponds to the situation in spring 2010. The complete history of tree defoliation is unknown as annual surveys of the tree defoliation on the study plots have only been carried out since plot establishment. The outbreak in the area started in 1999 and a peak in defoliation was reached in 2005, after which some of the plots have recovered to a healthier state. However, the pattern of defoliation among the plots has not greatly changed, although the overall level of defoliation has decreased after 2005.
Using the plot-wise mean defoliation levels, each plot was classified as having either “mild” (< 20% defoliation intensity) or “moderate to severe” defoliation (> 20% defoliation intensity). The 20% defoliation intensity value was used because defoliation exceeding 20% in the Nordic countries is generally considered harmful for tree growth ([52], [35], [36]). Of the plots, 21 (75%) were classified as having mild defoliation and 7 (25 %) as having moderate to severe defoliation in 2010.
Topography
Elevation and slope were derived from a high pulse density airborne scanning LiDAR (Light Detection and Ranging) data set. The LiDAR point cloud was acquired from the Palokangas area in July 2008 using an ALS50-II SN058® laser scanner (Leica Geosystem AG, Heerbrugg, Switzerland) as described by Kantola et al. ([23]). With the standard TerraScan approach ([1]), the data set was classified into ground or non-ground points and a high resolution (1 m) digital elevation model (DEM) was generated using classified ground points.
Elevation above the sea level (m a.s.l.) and slope were computed from the DEM for each plot using ArcMap® (ArcGis v. 9.3, ESRI, Redlands, CA). Plot mean values for elevation (m a.s.l.) were calculated from the point data. The slope layer was delineated according to the perimeter of each plot and the mean values of the pixels within the plot were used. Topographical data for two of the western-most sample plots could not be used due to a lack of information on the elevation on the plots.
Soil sampling and laboratory analysis
In June 2010, soil cores (n = 140) were collected from the center of each plot and at 5.3 m distance from the center in each cardinal direction in order to get a set of samples representative of each plot. A steel auger (diameter 58 mm) was used to take intact soil cores to a depth of ca. 0.5 m, unless limited by the bedrock. Each soil core was extracted from the auger, the surface litter layer (Ol) removed, and the thicknesses of the humus layer (Of+Oh), (Ah+)E, B and C-horizons measured to a precision of 0.1 cm. The C-horizon was missing from some cores as a consequence of the thin soil. Each soil core was then cut into the above horizons and each placed in a separate plastic bag and kept at 5 °C until analyzed in the laboratory. The plot-wise mean thickness of each horizon was calculated from the five samples from each plot with the exception of three plots where horizon thickness could not be measured due to the unclear interpretation of the horizons and their boundaries. As the (Ah+)E and C-horizon samples were not always sufficient for physical and chemical analysis, only the humus layer and B-horizon samples of each core were analyzed.
The soil samples were dried at 50 °C for 24 hours after which they were weighed. The humus layer samples were milled, passed through a 2 mm sieve and composited by plot. For the B-horizon samples, a 25 ml subsample from each dried sample was taken and composited by plot. The composited samples were passed through a 2 mm sieve and the weight of >2 mm and <2 mm fractions recorded. The <2 mm fraction was retained for analysis.
The particle size distribution of the <2 mm B-horizon soil was determined using laser fractionation (Coulter LS230®, Beckman Coulter Inc., Brea, CA, USA). The following texture classification was used: coarse sand (0.6-2 mm), medium sand (0.2-0.6 mm), fine sand (0.06-0.2 mm), coarse silt (0.02-0.06 mm), medium silt (0.006-0.02 mm), fine silt (0.002-0.006 mm), and clay (< 0.002 mm). Total organic C and total N contents were determined from the milled humus layer samples and <2 mm B-horizon samples using a VarioMax CN device (Elementar Analysensysteme GmbH, Hanau, Germany). The soil C/N ratio was calculated from the C and the N contents. Soil pH was determined from a suspension of the milled humus layer samples and 0.1 M calcium chloride solution (1:2), using a glass electrode.
Statistical analysis
Spearman’s rank correlation coefficients were used to describe the relationships between plot topographical features, soil properties and plot-wise mean defoliation intensity. The non-parametric Mann-Whitney U-test was used to test if there were significant differences in each predictor variable (topography and soil variables) between the mild defoliation (< 20% defoliation) and moderate to severe defoliation (> 20% defoliation) classes. Logistic regression was used to investigate the power of the topographical and soil variables to predict the probability of a plot belonging to the moderate to severe defoliation class. Predictor variables that were strongly correlated with each other were not added to the same model. This ensured the models were simple (only up to three predictors) and avoided possible over-fitting. The logistic regression was performed for several different combinations of predictor variables. Evaluation of the models was based on predictor variable p-values, overall classification accuracies, and Cohen’s Kappa-values ([31]). The R-statistical computing environment ([49]) and the “irr” package ([11]) were used to make the analysis.
Results
Characteristics of the study trees
Plot mean dbh and mean height were similar in the mild defoliation and moderate to severe defoliation classes (20.5 vs. 19.2 m, and 20.6 vs. 18.9 m, respectively - Tab. 1). The mean number of stems per hectare and mean basal area were higher in the mild defoliation class (565 stems ha-1, 18 m2 ha-1) than in the moderate to severe defoliation class (446 stems ha-1, 15 m2 ha-1). Mean defoliation in the mild defoliation class was 10% and 54% in the moderate to severe defoliation class (Tab. 1).
Tab. 1 - Forest characteristics (mean, median, minimum, maximum, and standard deviation - STD) of the study plots by defoliation class mild (<20% defoliation) and moderate to severe (>20 % defoliation). (dbh): diameter at breast height; (h): tree height; (N): number of stems per hectare; (BA): basal area.
| Defoliation | Statistics | dbh (cm) |
h (m) |
N (stems ha-1) |
BA (m2 ha-1) |
Defoliation (%) |
|---|---|---|---|---|---|---|
| Mild (n=21) |
Mean | 20.5 | 19.2 | 565 | 18 | 10 |
| Median | 20.5 | 19.3 | 526 | 19 | 10 | |
| Min | 16.5 | 16.4 | 320 | 10 | 1 | |
| Max | 24.0 | 21.6 | 1057 | 29 | 19 | |
| STD | 2.1 | 1.4 | 184 | 5 | 6 | |
| Moderate to severe (n=7) |
Mean | 20.6 | 18.9 | 446 | 15 | 54 |
| Median | 20.8 | 18.3 | 464 | 16 | 51 | |
| Min | 16.4 | 15.4 | 283 | 9 | 26 | |
| Max | 24.1 | 23.1 | 575 | 21 | 77 | |
| STD | 2.5 | 2.4 | 90 | 4 | 22 |
Topographical characteristics and soil properties
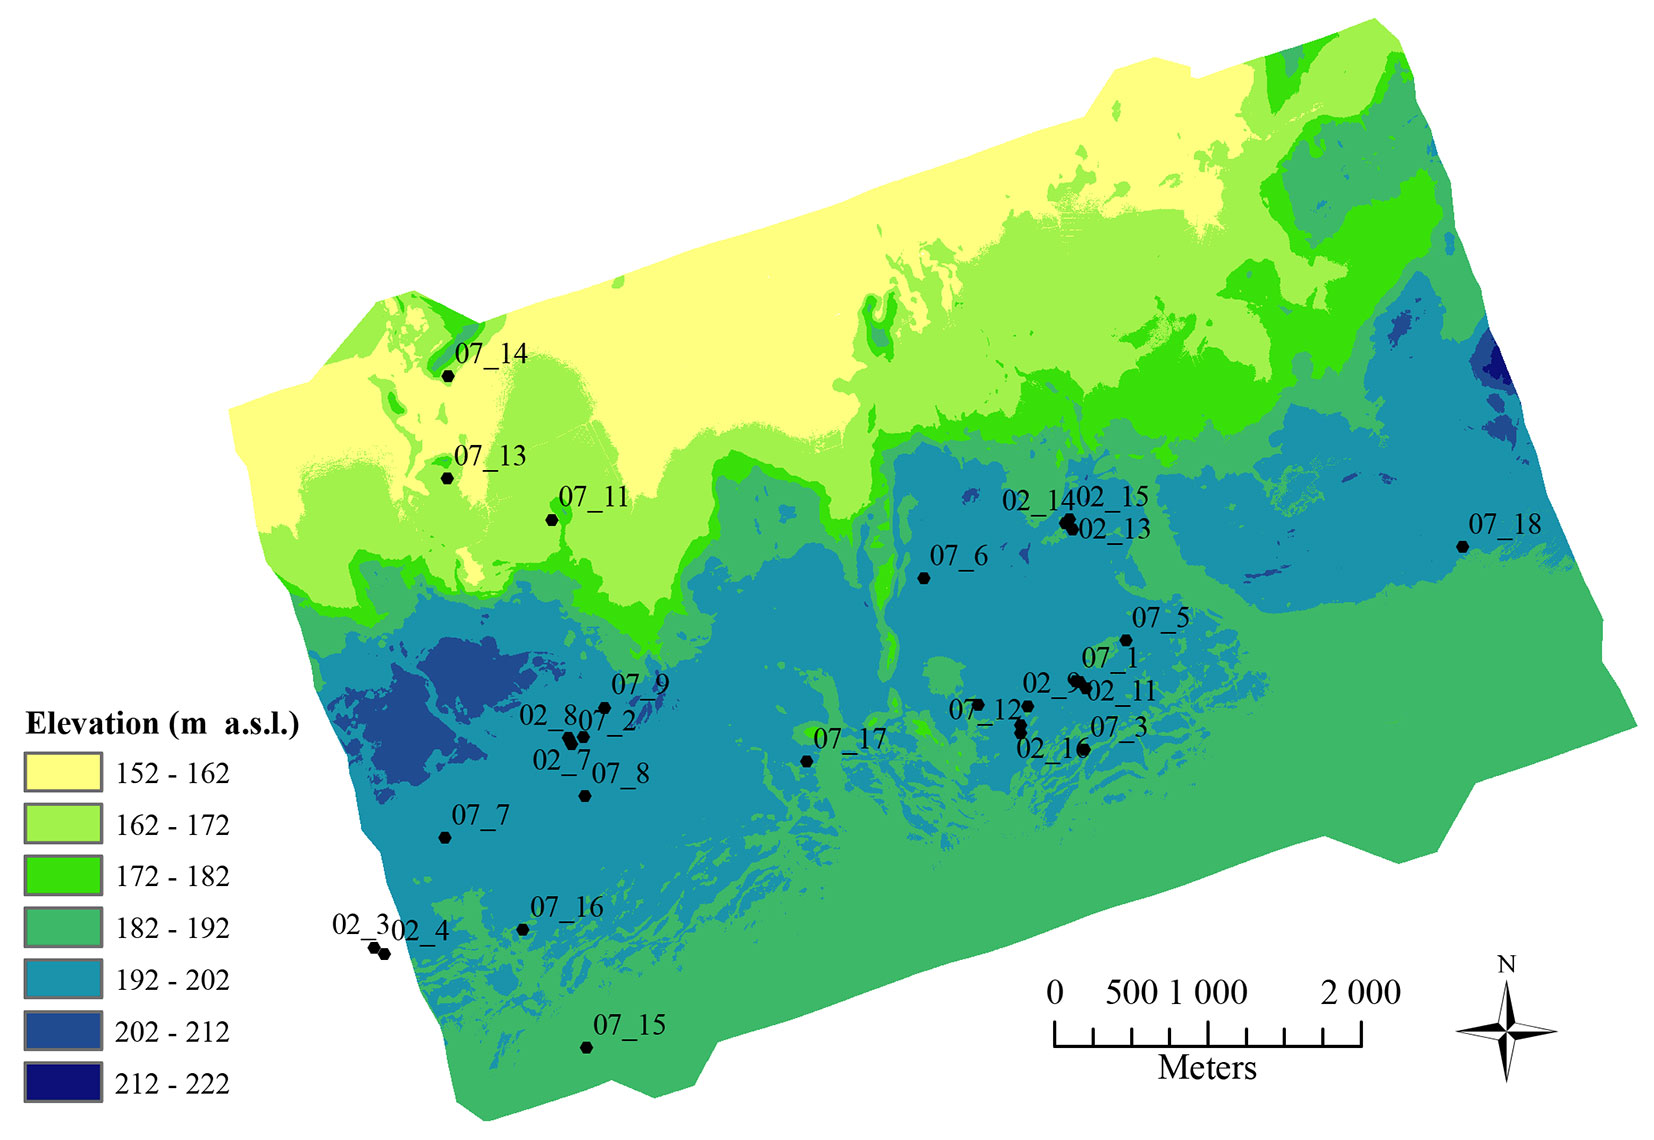
The study area was generally rather flat (Fig. 1). The highest elevations were found along the central southwest-northeast axis running through the study area and sloping towards the northwest and southeast. Plot-mean elevations varied between 165 and 200 m a.s.l. and plot-mean slope between 1 and 14° (Tab. 2).
Fig. 1 - Digital elevation model of the study area and location of the plots (black dots).
Tab. 2 - Topographic characteristics and soil properties of the study plots (mean ± standard deviation, minimum and maximum; n=26 for topographical characteristics, n=25 for soil horizon thickness, n=28 for other soil properties).
| Variable | Mean ± STD | Min | Max |
|---|---|---|---|
| Elevation (m a.s.l.) | 192 ± 10 | 165 | 200 |
| Slope (°) | 4 ± 3 | 1 | 14 |
| Humus layer thickness (cm) | 4.5 ± 0.9 | 2.9 | 6.4 |
| (Ah+)E-horizon thickness (cm) | 4.0 ± 1.4 | 2.1 | 7.4 |
| Humus layer pH | 4.03 ± 0.29 | 3.54 | 4.78 |
| Humus layer C (%) | 34.6 ± 6.2 | 19.5 | 45.7 |
| Humus layer N (%) | 1.01 ± 0.22 | 0.50 | 1.43 |
| Humus layer C/N ratio | 35 ± 5 | 27 | 56 |
| B-horizon C (%) | 1.7 ± 0.6 | 0.7 | 3.4 |
| B-horizon N (%) | 0.08 ± 0.03 | 0.04 | 0.15 |
| B-horizon C/N ratio | 21 ± 4 | 16 | 30 |
| B-horizon medium sand & finer (< 0.6 mm) (%) | 86.8 ± 7.6 | 61.3 | 97.4 |
| B-horizon fine sand & finer (< 0.2 mm) (%) | 54.1 ± 10.1 | 34 | 77.5 |
| B-horizon coarse silt & finer (< 0.06 mm) (%) | 23.5 ± 8.6 | 10.7 | 44.2 |
| B-horizon medium silt & finer (< 0.02 mm) (%) | 8.4 ± 2.6 | 4.6 | 13.6 |
| B-horizon fine silt & finer (< 0.006 mm) (%) | 3.2 ± 0.9 | 1.9 | 4.8 |
| B-horizon clay (< 0.002 mm) (%) | 1.4 ± 0.4 | 0.8 | 2.4 |
The thickness of the humus layer varied between 2.9 and 6.4 cm and the thickness of (Ah+)E-horizon between 2.1 and 7.4 cm (Tab. 2). The soils were rather acidic, with a mean pH of 4.03. Humus layer C and N contents varied between 19.5 and 45.7% and between 0.50 and 1.43%, respectively, resulting in C/N ratios varying between 27 and 56 (Tab. 2). The C and N contents of the B-horizon were an order of magnitude lower than humus layer values, and C/N ratios varied between 16 and 30. Soil texture varied considerably among the plots. The plot mean proportion of coarse silt and finer (< 0.06 mm) varied between 10.7 and 44.2% and the proportions of medium silt and finer (< 0.02 mm) between 4.6 and 13.6 %. The proportion of clay (< 0.002 mm) was rather low on all of the plots (Tab. 2).
The thickness of (Ah+)E-horizon had a significant negative correlation with slope, but otherwise the soil properties were not significantly correlated with the topographical variables (Tab. 3). Several of the variables describing site fertility, such as the C/N ratio and proportion of fine soil particles (<0.02 mm), were significantly correlated with each other (Tab. 3).
Tab. 3 - Spearman’s correlation coefficients (ρ) between plot topographical characteristics and soil properties (n=26 for topographical characteristics, n=25 for soil horizon thickness, n=28 for other soil properties). See Tab. 2 for explanation of variable abbreviations. (*): P < 0.05; (**): P < 0.01; (***): P < 0.001.
| Parameters | Elevation (m a.s.l.) |
Slope (°) |
Humus layer (cm) |
(Ah+)E-hor. (cm) |
Humus layer pH |
Humus layer C (%) |
Humus layer N (%) |
Humus layer C/N |
B-hor. C (%) |
B-hor. N (%) |
B-hor. C/N |
B-hor. <0.02 mm (%) |
|---|---|---|---|---|---|---|---|---|---|---|---|---|
| Elevation | 1 | 0.06 | -0.35 | -0.37 | 0.02 | -0.04 | -0.14 | 0.08 | 0.33 | 0.30 | 0.11 | -0.02 |
| Slope | - | 1 | 0.05 | -0.49* | -0.11 | -0.09 | -0.15 | 0.28 | -0.06 | -0.18 | 0.06 | -0.09 |
| Humus layer | - | - | 1 | 0.36 | -0.29 | 0.45* | 0.28 | 0.30 | 0.07 | 0.08 | -0.07 | 0.25 |
| (Ah+)E-hor. | - | - | - | 1 | 0.11 | 0.35 | 0.46* | -0.23 | -0.51** | -0.22 | -0.41* | 0.31 |
| Humus layer pH | - | - | - | - | 1 | -0.08 | 0.13 | -0.41* | -0.13 | -0.12 | 0.08 | 0.07 |
| Humus layer C | - | - | - | - | - | 1 | 0.85*** | 0.00 | 0.18 | 0.35 | -0.29 | 0.33 |
| Humus layer N | - | - | - | - | - | - | 1 | -0.45* | 0.20 | 0.52** | -0.49** | 0.55** |
| Humus layer C/N | - | - | - | - | - | - | - | 1 | -0.13 | -0.45* | 0.38* | -0.43* |
| B-hor. C | - | - | - | - | - | - | - | - | 1 | 0.80*** | 0.16 | 0.25 |
| B-hor. N | - | - | - | - | - | - | - | - | - | 1 | -0.38* | 0.53** |
| B-hor. C/N | - | - | - | - | - | - | - | - | - | - | 1 | -0.54** |
| B-hor. <0.02 mm | - | - | - | - | - | - | - | - | - | - | - | 1 |
Relationships between topography, soil and defoliation
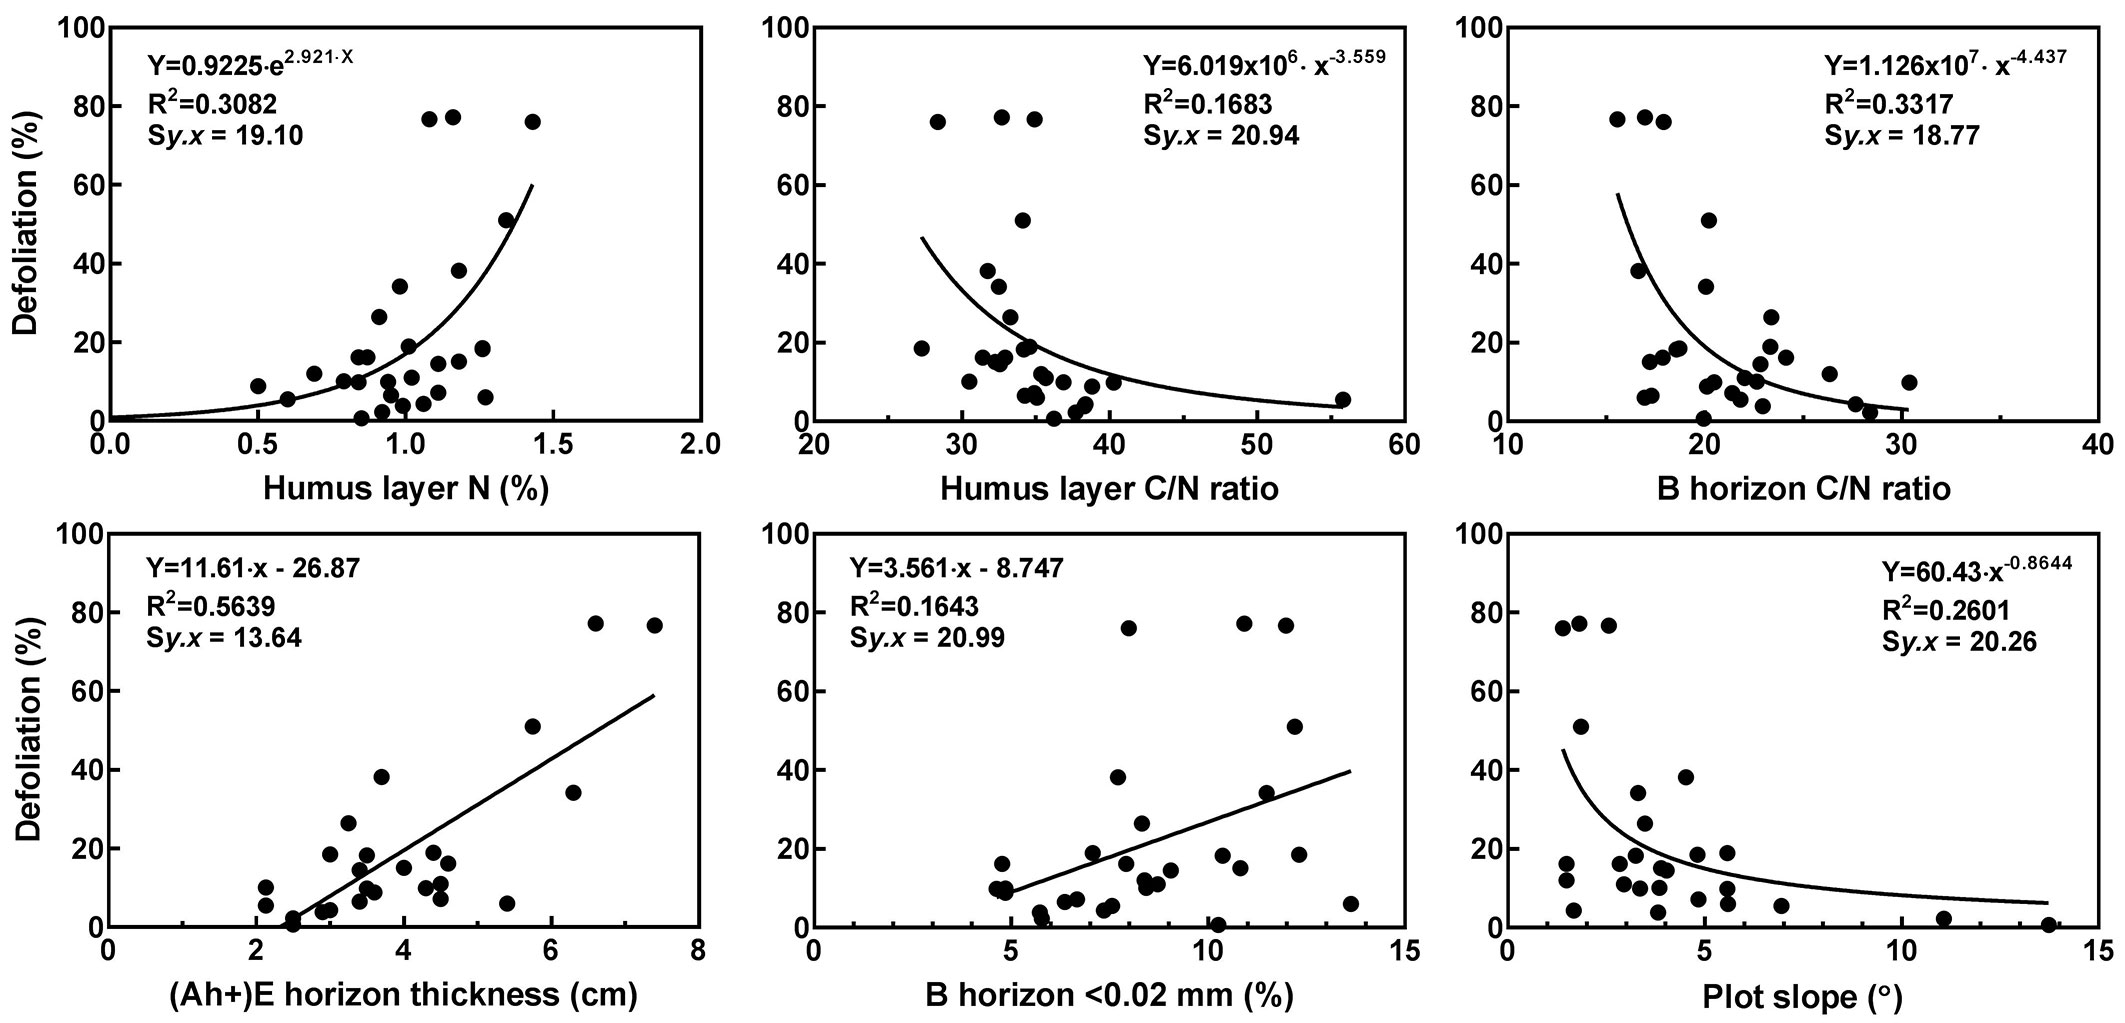
Slope had a significant negative correlation with defoliation but there was no significant difference in slope between the mild and moderate to severe defoliation classes (Tab. 4, Fig. 2). The C/N ratio had a significant negative correlation with plot mean defoliation but it was clearly stronger for the humus layer. The thickness of (Ah+)E-horizon, the N content of humus layer and the proportion of medium silt and finer (< 0.02 mm) in B-horizon were all significantly and positively correlated with plot mean defoliation (Tab. 4, Fig. 2). Concerning differences between the mild and moderate to severe defoliation classes, the thickness of (Ah+)E-horizon, the N content and C/N ratio of the humus layer, and the C/N ratio and proportion of medium silt and finer (< 0.02 mm) in the B-horizon all showed a significant difference (Tab. 4).
Tab. 4 - Spearman’s correlation coefficients (ρ) between various plot topographical characteristics and soil properties and mean defoliation (%), and Mann-Whitney U test values and significance of difference between plots classified as having mild (<20 % foliage loss) and plots having moderate to severe (>20 % foliage loss) defoliation (n=26 for topographical characteristics, n = 25 for soil horizon thickness, n = 28 for other soil properties). See Tab. 2 for explanation of variable abbreviations. (*): P < 0.05; (**): P < 0.01; (***): P < 0.001.
| Variable | Spearman’s ρ |
Mann-Whitney U test |
|---|---|---|
| Elevation (m a.s.l.) | -0.26 | 42.0 |
| Slope (°) | -0.52** | 33.0 |
| Humus layer (cm) | 0.10 | 39.0 |
| (Ah+)E-hor. (cm) | 0.62*** | 19.0* |
| Humus layer pH | 0.05 | 43.5 |
| Humus layer C (%) | 0.14 | 52.0 |
| Humus layer N (%) | 0.45* | 36.5* |
| Humus layer C/N | -0.68*** | 35.0* |
| B-hor. C (%) | -0.05 | 70.0 |
| B-hor. N (%) | 0.25 | 49.0 |
| B-hor. C/N | -0.39* | 35.5* |
| B-hor. <0.02 mm (%) | 0.44* | 36.0* |
Logistic regression models
The best model in predicting the probability of a plot having moderate to severe defoliation (>20%) included the thickness of the (Ah+)E-horizon as a single predictor and had a classification accuracy of 88 % and a substantial Kappa-value of 0.65 (Model 1 - Tab. 5). The models using the C/N ratio and pH of the humus layer (Model 2), C/N ratio of the B-horizon and slope (Model 3), and N content and pH of humus layer (Model 4) all had moderate Kappa-values (Tab. 5).
Tab. 5 - Logistic regression models for predicting probability of a plot having moderate to severe defoliation (>20 % foliage loss) (log[p/(1-p)] = β0 + β1x1 + … + βkxk, where p is the probability (0, 1), β0 the intercept, and β1, …, βk the regression coefficients for predictor variables x1, …, xk). (SE): standard error; (P-value): significance of predicting variable being associated with the probability of plot having moderate to severe defoliation; (Accuracy): classification accuracy (%); (Kappa): Kappa statistic (0.41-0.60 = moderate agreement, 0.61-0.80 = substantial agreement). See Tab. 2 for explanation of variable abbreviations. (*): P < 0.05; (**): P < 0.01; (***): P < 0.001.
| Model | Variable | Coefficient | SE | P-value | Accuracy | Kappa |
|---|---|---|---|---|---|---|
| Model 1(n=25) | Intercept | -6.779 | 2.507 | 0.007** | - | - |
| (Ah+)E-hor. (cm) | 1.277 | 0.531 | 0.016* | 88 | 0.65 | |
| Model 2 (n=28) | Intercept | 55.662 | 24.648 | 0.024* | - | - |
| Humus layer C/N | -0.721 | 0.346 | 0.037* | - | - | |
| Humus layer pH | -7.910 | 3.617 | 0.029* | 86 | 0.58 | |
| Model 3 (n=26) | Intercept | 11.055 | 5.155 | 0.032* | - | - |
| B-hor. C/N | -0.437 | 0.213 | 0.040* | - | - | |
| Slope (°) | -0.960 | 0.536 | 0.073 | 85 | 0.57 | |
| Model 4 (n=28) | Intercept | 9.732 | 10.014 | 0.331 | - | - |
| Humus layer N (%) | 6.773 | 3.128 | 0.030* | - | - | |
| Humus layer pH | -4.429 | 2.694 | 0.100 | 82 | 0.50 |
Discussion
Topography effects
We did not find a significant impact of elevation on D. pini defoliation in our study. Other studies concerning insect outbreaks and elevation imply that patterns of insect performance along elevational gradients differ between insect species. Only a few studies regarding pine sawfly performance in relation to elevation have been conducted. However, Niemelä et al. ([46]) observed the damage caused by the European pine sawfly (Neodiprion sertifer Geoffr.) on P. sylvestris in northern Finland to be more severe at upper summits compared to the lower ones and was due to differences in foliar nutrient contents. Similarly, larval and cocoon masses of a pine sawfly, Neodiprion xiangyunicus (Xiao & Huang), feeding on Yunnan pine (Pinus yunnanensis Franch.) were found to increase with elevation in south-western China ([17]). McMillin et al. ([39]) observed that pine defoliation by the sawfly Neodiprion autumnalis (Smith) was present only at elevations of 2410-2440 m a.s.l. and by the sawfly Neodiprion xiangyunicus (Xiao and Hung) at 1850-2050 m a.s.l. in southern USA and southern China. Kantola et al. ([25]) observed higher hemlock woolly adelgid (Adelges tsugae Annand) induced tree mortality on higher elevations within a southern Appalachian forest landscape in western North Carolina, USA. In contrast, Kharuk et al. ([27]) found that the highest conifer mortality caused by the Siberian silkmoth (Dendrolimus superans sibiricus Tschetw.) in central Siberia was at lower (200 m) elevations than at higher elevations (300 m). While N. sertifer has been found to adapt to environmental conditions at various elevations and latitudes in Europe ([48]), the low range in elevation among the plots most probably accounts for the lack of an elevation effect in our study.
Defoliator susceptible sites have been found on both steep and flat slopes. Morse & Kulman ([44]) found steeper and south-facing slopes to have a higher probability for the white spruce (Picea glauca [Moench] Voss) defoliation by the yellowheaded spruce sawfly (Pikonema alaskensis Rohver) in Minnesota, USA, and Kharuk et al. ([27]) found the most intensive Siberian silkmoth damage associated with slopes of 5-20° compared to slopes of less than 5°. In a later study, Kharuk et al. ([28]) found that while the initial outbreak of Siberian silkmoth in the Eastern Sayan Mountains occurred on slopes of less than 5°, it later spread to less favorable sites on steeper slopes. While we found no significant difference in slope between the mild and moderate to severe defoliation classes, plot mean D. pini defoliation was negatively correlated to slope. However, the D. pini outbreak has been on-going for more than 10 years; if it were to follow the pattern observed by Kharuk et al. ([28]), one would have expected the intensity of damage to have shifted to steeper slopes. However, the higher defoliation on flatter slopes we found could be related to a more favorable forest structure or microclimate for D. pini during critical parts of its life cycle, such as oviposition early in the season or larval feeding in early fall ([21]).
Soil fertility effects
Although having a rather limited range in fertility, we found that plot-mean defoliation levels were significantly greater on the more fertile plots (i.e., humus layers having higher N contents and lower C/N ratios and B-horizons having higher contents of medium silt and finer). The results from other studies concerned with the effects of soil fertility on insect damage to trees and insect performance have been partly contradictory to what we found. Larsson & Tenow ([33]) found an outbreak of N. sertifer in southern Sweden to be concentrated to unfertile soils and Nevalainen et al. ([45]) showed that N. sertifer and D. pini damage in Finland was more common on sub-xeric heath forests and poorer sites (i.e., sites with relatively poor soil fertility) than on more fertile sites. Studies by Hood et al. ([20]), Cobb et al. ([8]) and Mayfield et al. ([38]) also found that soil properties indicating lower fertility were associated with greater tree damage. Mayfield et al. ([38]) found a negative correlation between pine false webworm sawfly (Acantholyda erythrocephala L.) population densities and A-horizon silt content and Cobb et al. ([8]) showed that tree mortality caused by the pinyon tip moth (Dioryctria albovittella Hulst) was more severe on cinder (volcanic) soils with lower silt and clay contents, compared to sandy soils with higher silt and clay contents. Hood et al. ([20]) observed that a thin A-horizon and lower calcium (Ca) contents in soil led to higher rates of pine tip moth species (Rhyaconia spp.) infestation.
The N contents of the humus layer and B-horizon in our study were within the range (0.3-1.5% for humus layer and 0.01-0.14% for 0-30 cm mineral soil layer, n=47) reported for similar site types in southern Finland ([54]). Those studies that found the incidence of insect outbreak and degree of tree damage decreased with site fertility were for sites covering a greater range or having a higher level of site fertility, as compared with our study. The apparent contradictory relationship between insect outbreak and damage and site fertility between these studies and ours may thus be because the relationship is curvilinear, with one side of the relationship showing a positive relationship and the other side showing a negative relationship, or because the relationship within groups of sites having similar levels of fertility differs from that across all the groups. In sites of poor fertility, the N nutritional value of the trees may be below the optimal for D. pini. However, the outbreak of D. pini in our study had been chronic for several years and therefore might exhibit a special kind of behavior.
Using fertilization experiments to mimic the effects of soil fertility on defoliator-caused damage and defoliator performance have given contradictory results. Mopper & Whitham ([43]) found that cocoons of pinyon sawfly (Neodiprion edulicolis Ross) had higher masses in sites with NPK-fertilized and watered pinyon pine (Pinus edulis Englm.) compared to those having no additions. In contrast, Larsson & Tenow ([33]) observed that ammonium fertilized plots suffered from milder damage and had a lower number of N. sertifer cocoons than non-fertilized plots, while Björkman et al. ([5]) did not find ammonium-nitrate fertilization to have any effect on the performance of N. sertifer larvae. Differences in the level of tree damage and insect performance in relation to soil fertility are probably related to several factors, including differences in host species chemistry and insect ecology, outbreak patterns, scale of the study and range in site fertility and/or predation and parasitism.
N, soluble carbohydrates glucose and fructose, and phosphorus are important in the diet of pine sawflies and therefore also important determinants of pine sawfly performance ([34], [13]). C-based defensive compounds, such as resin acids ([32]), phenolics ([13]) and 3-carene monoterpene ([3]) have been found to have negative effects on pine sawfly performance. Bryant et al. ([7]) suggested that plants growing on nutrient-poor sites have a surplus of C from which they can allocate a part to C-based defense compounds. Bryant et al. ([7]) also proposed that increased N concentrations in soil would enhance the allocation of C to tree growth and decrease the amount of C-based defense compounds and carbohydrates and increase the contents of N and N-based defense compounds. The N content of the humus layer in Finnish forests has been shown to significantly correlate with the N content of P. sylvestris current year needles ([50]). Increased soil N content via fertilization has also been found to increase P. sylvestris needle N and resin acid concentrations ([5]) and the number of resin glands ([22]), but to decrease contents of monoterpenes ([22]). P. sylvestris foliar contents of N and P decrease ([16]) and contents of phenolic compounds increase ([13]) with needle age. Current and previous year needles, both of which are consumed by D. pini, may also respond differently to N additions. For example, Kainulainen et al. ([22]) found that while phenolic contents in current-year P. sylvestris needles decreased after ammonium-nitrate fertilization, there was no effect on the previous year needles. In our study, the trees on plots with lower soil C/N ratios possibly were able to allocate more C to growth and less to defense, and had needles with higher amounts of soluble N and lower amounts of phenolics and monoterpenes, resulting in more attractive nutrition for D. pini. The D. pini population in our study area has also been at gradation and post-gradation level since 1999. In such a chronic outbreak situation, continuous tree defoliation may increase the N content and decrease C-based defensive chemical content of the host-plant material due to changed C allocation patterns, making them more favorable for defoliators ([41]). This partly self-maintaining mechanism might have affected the outbreak pattern of D. pini and the relationship between defoliation and soil N in our study area.
Since insect herbivores can influence soil characteristics, e.g., by nutrient input into the soil via frass ([10], [26]), the higher N content of humus layer on our study plots with higher mean defoliation intensity could have resulted from D. pini rather than vice versa. However, we observed that N content of the humus layer had a significant positive correlation with the proportion of fine soil particles of the B-horizon. Soil N contents often increase with increasing proportion of fine soil particles ([6]) and the particle size distribution of mineral soil is not affected by D. pini defoliation. Therefore N contents of the humus layer in our study indicate the long-term nutrient status of the site rather than the consequences of D. pini defoliation.
Conclusions
Although the fertility was generally poor and topographical variation low across our study plots, we found D. pini defoliation of P. sylvestris trees to be greater on the more fertile and flatter sites than on the less fertile and steeper sites, but to be independent of elevation. Plot mean defoliation was most strongly correlated with the C/N ratio of the humus layer. However, the thickness of (Ah+)E horizon was the most successful soil property determining the probability of having moderate to severe defoliation (>20 % foliage loss). The positive relationship between D. pini defoliation and site fertility we found contrasts with the findings of other studies in which insect performance and damage has been found to be negatively correlated to site fertility. While this may be related to differences in the scale of site fertility, the outbreak of D. pini in our study had been chronic for several years and therefore might exhibit a special kind of behavior.
The effect of defoliators on C and nutrient cycling in forest ecosystems is not well known however, and the interaction between soil, topography and defoliators, especially in relation to climate change, needs further study. In particular, the relationship between soil properties, needle nutrient and defense chemical contents, and defoliator performance needs to be clarified. We have shown that soil and terrain conditions contribute to pine sawfly population dynamics and forest damage. Ways should be sort to take these factors into account in forest management planning, selection of silvicultural practices and in the modeling of insect outbreaks in forests.
Acknowledgements
We wish to thank Antero Pasanen and Jari Tahvanainen from Tornator Ltd., who enabled this study in Palokangas area in Ilomantsi. Bert De Somviele and Anna-Maija Kokkonen who kindly assisted in establishing the sampling plots in 2002, and Saara Ilvesniemi in 2007. We would also like to thank Marjut Wallner for help in the laboratory. In addition, we wish to thank the three anonymous reviewers of this paper for valuable comments. This study was made possible by grants from the Finnish Cultural Foundation - South Karelia Regional Fund, Societas pro Fauna et Flora Fennica, Niemi Foundation, Maj and Tor Nessling Foundation, and the Finnish Academy project “Centre of Excellence in Laser Scanning Research” (CoE-LaSR, decision number 272195).
References
Gscholar
Online | Gscholar
CrossRef | Gscholar
Gscholar
Gscholar
Gscholar
Authors’ Info
Authors’ Affiliation
Tuula Kantola
Mike Starr
Minna Blomqvist
Mervi Talvitie
Päivi Lyytikäinen-Saarenmaa
Department of Forest Sciences, University of Helsinki, P.O. Box 27 (Latokartanonkaari 7), FI-00014 Helsinki (Finland)
Corresponding author
Paper Info
Citation
Kosunen M, Kantola T, Starr M, Blomqvist M, Talvitie M, Lyytikäinen-Saarenmaa P (2016). Influence of soil and topography on defoliation intensity during an extended outbreak of the common pine sawfly (Diprion pini L.). iForest 10: 164-171. - doi: 10.3832/ifor2069-009
Academic Editor
Massimo Faccoli
Paper history
Received: Mar 26, 2016
Accepted: Oct 18, 2016
First online: Nov 19, 2016
Publication Date: Feb 28, 2017
Publication Time: 1.07 months
Copyright Information
© SISEF - The Italian Society of Silviculture and Forest Ecology 2016
Open Access
This article is distributed under the terms of the Creative Commons Attribution-Non Commercial 4.0 International (https://creativecommons.org/licenses/by-nc/4.0/), which permits unrestricted use, distribution, and reproduction in any medium, provided you give appropriate credit to the original author(s) and the source, provide a link to the Creative Commons license, and indicate if changes were made.

Web Metrics
Breakdown by View Type
Article Usage
Total Article Views: 52857
(from publication date up to now)
Breakdown by View Type
HTML Page Views: 42959
Abstract Page Views: 4367
PDF Downloads: 3986
Citation/Reference Downloads: 65
XML Downloads: 1480
Web Metrics
Days since publication: 3525
Overall contacts: 52857
Avg. contacts per week: 104.96
Article Citations
Article citations are based on data periodically collected from the Clarivate Web of Science web site
(last update: Mar 2025)
Total number of cites (since 2017): 8
Average cites per year: 0.89
Publication Metrics
by Dimensions ©
Articles citing this article
List of the papers citing this article based on CrossRef Cited-by.
Related Contents
iForest Similar Articles
Research Articles
Effects of defoliation by the pine processionary moth Thaumetopoea pityocampa on biomass growth of young stands of Pinus pinaster in northern Portugal
vol. 3, pp. 159-162 (online: 15 November 2010)
Research Articles
Sensitivity analysis of RapidEye spectral bands and derived vegetation indices for insect defoliation detection in pure Scots pine stands
vol. 10, pp. 659-668 (online: 11 July 2017)
Research Articles
Stand structure and regeneration of Cedrus libani (A. Rich) in Tannourine Cedar Forest Reserve (Lebanon) affected by cedar web-spinning sawfly (Cephalcia tannourinensis, Hymenoptera: Pamphiliidae).
vol. 11, pp. 300-307 (online: 13 April 2018)
Research Articles
Estimating crown defoliation of Scots pine (Pinus sylvestris L.) trees using small format digital aerial images
vol. 6, pp. 15-22 (online: 14 January 2013)
Research Articles
The impact of post-defoliation foliage of Pinus halepensis Mill. on the larval performance of Thaumetopoea pityocampa and its relationship with the tree-induced defense
vol. 18, pp. 186-193 (online: 01 July 2025)
Research Articles
Predicting tree crown defoliation using color-infrared orthophoto maps
vol. 6, pp. 23-29 (online: 14 January 2013)
Research Articles
Influence of climate on tree health evaluated by defoliation in the ICP level I network (Romania)
vol. 10, pp. 554-560 (online: 05 May 2017)
Research Articles
Monitoring of damage from cedar shoot moth Dichelia cedricola Diakonoff (Lep.: Tortricidae) by multi-temporal Landsat imagery
vol. 7, pp. 126-131 (online: 13 January 2014)
Research Articles
Growing season water balance of an inner alpine Scots pine (Pinus sylvestris L.) forest
vol. 11, pp. 469-475 (online: 02 July 2018)
Research Articles
Soil respiration and carbon balance in a Moso bamboo (Phyllostachys heterocycla (Carr.) Mitford cv. Pubescens) forest in subtropical China
vol. 8, pp. 606-614 (online: 02 February 2015)
iForest Database Search
Search By Author
Search By Keyword
Google Scholar Search
Citing Articles
Search By Author
Search By Keywords
PubMed Search
Search By Author
Search By Keyword


