Temporal analysis of the traffic loads on forest road networks
iForest - Biogeosciences and Forestry, Volume 6, Issue 5, Pages 255-261 (2013)
doi: https://doi.org/10.3832/ifor0773-006
Published: Jun 13, 2013 - Copyright © 2013 SISEF
Research Articles
Abstract
The management of forest road networks is usually influenced by the traffic generated by wood transportation. In order to analyze the distribution and intensity of traffic generated by wood transportation in an Alpine region, the study considered a 21-year period with a total of 2 231 logging operations on a forest road network in a mountainous area. Most of the forest road network was affected by traffic load intensities generally of less than 500 t per year. The distribution of the traffic load over time and the characteristics of the road network inferred that the traffic load could assume different intensities and distributions over the years because of different locations and intensities of the logging operations. A GIS-based approach makes it possible to identify the forest road segments with high traffic loads in support of decisions on road network planning and management priorities.
Keywords
Logging Operations, Forest Roads, GIS Analysis, Traffic Loads
Introduction
Forest road network investigations provide a primary method for evaluating forest accessibility in terms of on-road transportation and forest operations. Forest roads play a dual role in providing both access to the forest and transportation mobility and, together with extraction routes, normally form a relatively even network in the forest. A forest road network is therefore the result of the combination between the main forest roads and the timber extraction routes ([16]).
Forest road network, which includes both forest and secondary public roads, has received much attention in recent years due to its function and effect on forested rural landscapes and the related environment ([22], [15]) and its primary role in the efficiency of logging operations and forest transportation ([16]). As a consequence, the importance of the multi-functional role of the forest road network has been widely recognized, being the interface between forested lands and the roads. It provides access not only for timber extraction and management but also for water protection and wildlife habitat improvement, fire control and many recreational activities ([1]).
On the other hand, the presence of roads has many undesirable effects on both biotic and abiotic components of the forest. Several reviews have been published in the literature about the negative effects of forest roads ([8], [11]). As an example, there has been considerable interest in the analysis of the forest road network as a source of accelerated soil erosion and the production of sediment ([5], [14]), also using GIS models ([34]).
The maintenance and management of forest road networks are also an essential element to be investigated ([26]), and have recently been analyzed by Coulter et al. ([9]) with the intent of protecting road infrastructure and limiting negative environmental effects by considering non-economic benefits. Furthermore, an assessment of the impact of vehicle traffic moving through a designated area via a road network involves specific problems of forest management.
Traffic increases sediment generation rates through detachment, abrasion and crushing of the road surface material ([33]). The assessment and subsequent prevention of soil erosion from forest roads requires an understanding of how road design and maintenance affect sediment production ([20]). Empirical evidence providing an insight into how sediment yield is affected by traffic is reported by Bilby et al. ([5]) who highlighted that the amount of sediment produced is also related to traffic rate. Researches by Reid ([30]), Reid & Dunne ([31]), Grayson et al. ([13]), Luce & Black ([21]), Ramos-Scharron & MacDonald ([28]), Sheridan & Noske ([32]), Ziegler et al. ([36]) were specifically aimed at determining the effects of traffic on road erosion, confirming that increasing erosion rates are related to increased traffic.
Despite the fact that the production of sediment and the maintenance of the forest road network are strictly connected to the traffic loads, few papers consider the analysis and quantification of the traffic load generated by forest operations ([27]). Several examples are reported in the literature on traffic load analysis based on the planned wood extraction volume ([19]) or on the potential yield located within a buffer area around the forest road segment ([24]).
In this study a 21-year period of logging operations are investigated with the aim of verifying the spatial and temporal distribution of the traffic load generated by wood transportation in a mountainous area of the Alps. The first goal was to examine and describe the logging operations in terms of extraction distance and terrain gradient. A novel GIS approach has therefore been developed and applied to characterize the spatial and temporal distribution of the traffic load. The distribution of the traffic was then analyzed according to the characteristics of the forest road network.
The investigation also aims to compare the traffic loads generated by the effective logging operations (actual harvest) vs. the potential traffic load on the forest road network by considering the average wood mass extracted yearly as calculated from the prescribed yield (maximum allowable harvest).
Materials and methods
Study area
The study area is located in Chiese valley in north-eastern Italy. The managed forest area covers 25 658 ha, partitioned into 27 Forest Management Plans (FMP). The productive forest area covers 14 905 ha with a prescribed annual yield of 17 000 m3. The productive forest area is managed using a close-to-nature silvicultural approach, ranging from single-tree selection cut to irregular group cut. Cutting operations include the harvest of large, economically mature trees, the tending of the intermediate size classes and the removal of trees without prospect of further growth. In the largest groups of adult trees, plant selection follows the shelterwood method with a long regeneration period.
According to the official forest road register and the indications of local stakeholders, the road network within the study area has not been substantially modified in the last 25 years in terms of expansion but merely in terms of construction standards.
Data collection of the forest road network
The existing public (primary and secondary) roads and forest roads were extracted from the respective road network databases, merged together and then verified and updated by GPS surveys. Landing and vehicle constraints, such as road gradient and width were also surveyed as points of interest using GPS. As for the forest road network, the vehicle constraints were categorized according to the most common Italian classification currently in use ([17]) as reported in Cavalli & Grigolato ([7]). As indicated in the Provincial Law LP 11/07 ([2]), the forest roads were identified according to their use: “exclusive use for forest activities” and “not exclusive use for forest activities”. The remaining roads with open access and used for forest operations and forest area access were simply classified as secondary public roads according to the National Road Code.
Data collection and spatial localization of the logging operations
Data on logging operations were collected from the local Forest Service offices. For each logging operation between 1987 and 2007, information was collected on cutting and merchantable wood volume, harvested area and the identification code of the stands. The collected data included 2231 harvesting operations.
The 27 FMP were unified in a single geographic FMP database, ad the logging operations grouped into a single geographic database by the identification codes of each stand and harvesting site. This resulted in all 2231 logging operations being spatially located.
In order to characterize the logging operations by location and topography, the skidding distance and the terrain gradient of the harvesting area were determined by GIS analysis. The analysis was based on a high resolution (up to 1.0 m) Digital Elevation Model (DEM) with an altitude accuracy ranging from 30 to 60 cm. The DEM was derived from LiDAR (Light Detection and Ranging) aerial survey data acquired at an altitude of 1800 m a.s.l. in 2006 and 2007 by an OPTECH ALTM 3100 sensor mounted on an aircraft with a point density of 0.5 per square meter ([3]).
According to Nakazawa et al. ([23]), Ranta ([29]) and Pentek et al. ([25]), the center of each harvesting site was supposed to correspond to the center of mass of the polygons identifying the harvesting area. A first geometrical extraction distance was calculated by computing the distance from the center of mass to the closest point of the forest road network. The x and y coordinates of the closest point of the forest road network were also recorded in order to identify the most likely landing sites ([18]). However it has to be pointed out that the method only estimates the positions of the landing sites, therefore there could be slight differences between the estimated and reallocation of landings.
High resolution DEM was used to extract the difference in elevation between the hypothetical landing sites and the centers of mass of the polygons. The mean extraction distance was then recalculated by means of the Pythagorean theorem into a more accurate distance that considered the change in elevation.
The mean terrain gradient of each harvesting site was calculated by zonal statistical analysis on the terrain gradient value. The percentage terrain gradient was previously calculated by a spatial analysis of the elevation change of the surface in the horizontal (dz/dx) and vertical (dz/dy) directions based on Horn’s method ([6]) with a resolution of 1 m of the DEM. The final database containing logging operations for each stand was thus spatially located.
Determination of the traffic load
The traffic analysis consisted of a GIS analysis using raster data. First, the entire road network (including the forest and secondary public roads) was divided into 72 sub-networks by identifying their end points at the junction with the nearest primary road. The traffic load analysis concerned the traffic generated by trucks without trailer as this is the most used transport system in the area and because the use of tractor and trailer involves a minimal part of the road network with minimum construction standards and an episodic use. Maximum gradient was assumed as 18%, carriageway width 3 m and curve minimum radius 8 m. The field surveys identified 33 critical key constraints, mostly steep gradients, limiting the transit of trucks.
The 2231 centers of mass of the polygons identifying each harvesting area were then snapped to the closest forest road or secondary public road (sometimes used as support for the forest operations). The snapped positions were assumed to be the most likely landing sites for the logging operations ([18]). The snapped centers of mass were subsequently converted into raster data with a resolution of 1 m. A set of 21 rasters was thus generated from the logging operation database. The 21 rasters represented the extracted mass at landings for each of the 21 analyzed years. The extracted mass equivalent of the merchantable wood volume was calculated by considering green wood with a density of 860 kg m-3 for Norway spruce, 920 kg m-3 for fir, 900 kg m-3 for larch, 880 kg m-3 for Scots pine and 1005 kg m-3 for broadleaves ([12]).
The forest road network was converted into raster data and re-classified according to the minimum accumulated route distance from the end points to the farthest points, also considering any interruptions caused by transportation barriers. A flow accumulation analysis was thus computed by calculating the accumulated flow of mass from the furthest point to the end point as the accumulated weight of all cells flowing into each down slope cell. The output raster consequently identified the wood mass accumulated along the forest road network according to the direction previously identified by the route distance analysis. This methodology was adapted from the well-known hydrological method used for the calculation of water flow accumulation to categorize the stream network in a watershed ([35]). The determination of the flow accumulation of the extracted wood mass was therefore based on the direction that was identified by the distance instead of the down slope as used by the hydrological method. The calculation was repeated for each of the 21 years in order to characterize each road segment by the flowed wood mass.
The number of truck round trips for the transportation of the extracted mass from each logging operation was then calculated according to the following formula proposed by Nevečerel et al. ([24] - eqn. 1):
where n is number of truck round trips, mland is the extracted wood mass (t) at landing, mmax is the gross vehicle weight (t), mempty is the mass (t) of the empty truck.
The number of truck round trips was first calculated for each year and then as the sum of the 21 years. The mass of empty trucks and the maximum mass allowed was considered according to the results of interviews with nine logging companies, which regularly operate within the study area; it was found that the most common truck for roundwood transportation is a single three-axle truck with double wheels at the rear end axles, with a gross vehicle weight of 26 t and a maximum payload of 13.5 t. The traffic load of each cell of the forest road network raster was therefore calculated considering the mass of the truck according to (eqn. 2):
where Tl is the traffic load, n is the number of truck round trips, mmax is the gross vehicle weight (t), mempty is the mass (t) of the empty truck.
The analyses on the spatial localization of logging operations and traffic load were conducted by ASDGIS Desktop 9.3 with ASDIOGP extension (ESRI Inc., Redland CA) for GIS analysis.
Statistical analysis
As for logging operations, the statistical analysis was aimed to verify if the means were:
- equal for different extraction distances (m) by considering 6 intervals of distance: <100, 101-200, 201-300, 301-400, 401-500, >500;
- equal at different terrain gradient (%) by considering 5 intervals of the gradient: <20, 21-40, 41-60, 61-80, >80.
For traffic load, the statistical analysis aimed to verify if the means were:
- equal in each road network segment during the 21 analyzed years;
- equal in relation to the use of the roads: “exclusive use for forest activities”, “not exclusive use for forest activities” and “secondary public roads”;
- equal in relation to two types of road surface: gravel and asphalt.
Furthermore, in order to evaluate the average yearly effective traffic loads generated by forest operations in the 21-year period vs. the yearly potential traffic load, the traffic load analysis also considered the average yearly extracted wood mass as calculated from the expected yield. The traffic load generated by the recorded logging operations of each forest road segment was therefore compared to the potential traffic load that would be generated by the logging operations for the theoretical prescribed yield as reported by the FMP. Hence, the traffic load procedure was applied also considering the theoretical extracted wood mass to the landing.
For each of the above hypothesis, goodness-of-fit to normal distributions was verified by the Kolmogorov-Smirnov test, and the equality of variances among different groups by the Levene test. One-Way ANOVA was applied to test the hypothesis that the groups described above were not significantly different. In order to determine which groups differ from each another, the post-hoc test considered the unbalanced samples’ size. Tukey’s honestly significant difference test (HSD) for unbalanced sample size was thus applied.
Statistical analyses were performed using the SPSS 18.0 statistical package (SPSS Inc., Chicago, IL) with α = 0.05.
Results
Logging operations between 1987 and 2007
The collected information covered 2231 harvesting sites in 21 years for a total cutting volume of 444 381 m3, corresponding to 406 531 m3 of merchantable wood (with bark). Norway spruce represented 61.9% of the merchantable wood volume, 14.3% was fir, 12.7% larch, 4.5% Scots pine and 6.6% broadleaves (mainly beech).
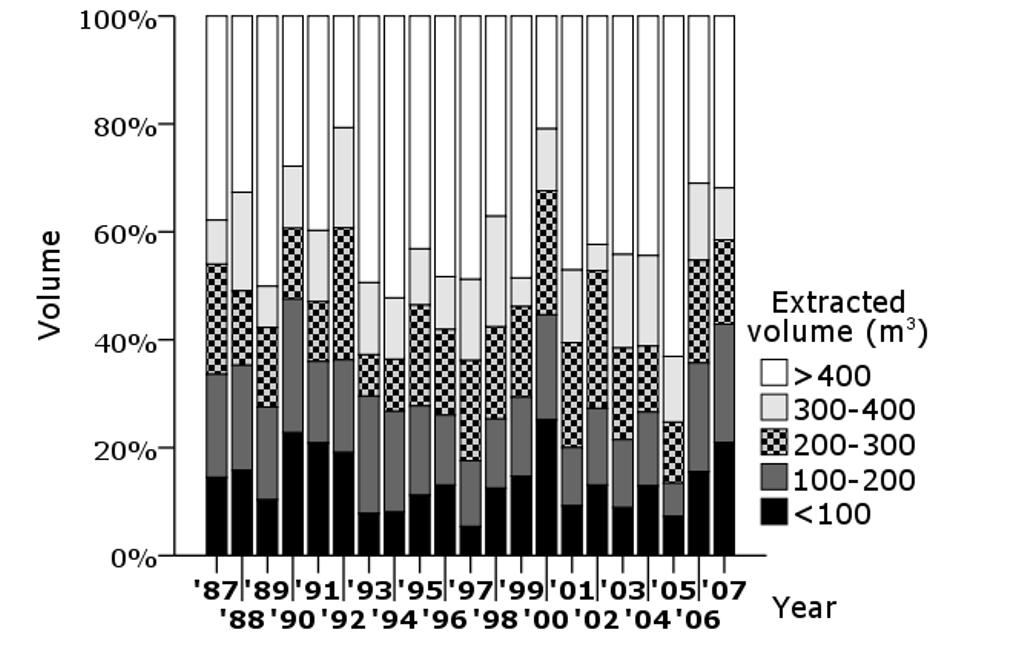
Over the 21 years considered, the average extracted volume per logging operation was 182.27 ± 105.45 m3 (SD). A remarkable portion of logging operations (69.2%) had an extracted volume of up to 300 m3 (Fig. 1). There is also evidence suggesting that a relevant part (57.3%) of the wood volume extracted every year was obtained in logging operations with a merchantable wood volume higher than 300 m3 (Fig. 2).
Fig. 2 - Yearly distribution of total extracted volume according to the extracted wood volume per site.
Regarding the extraction distance, the ratio between the average geometrical distance and the average slope extraction distance was 1.61.
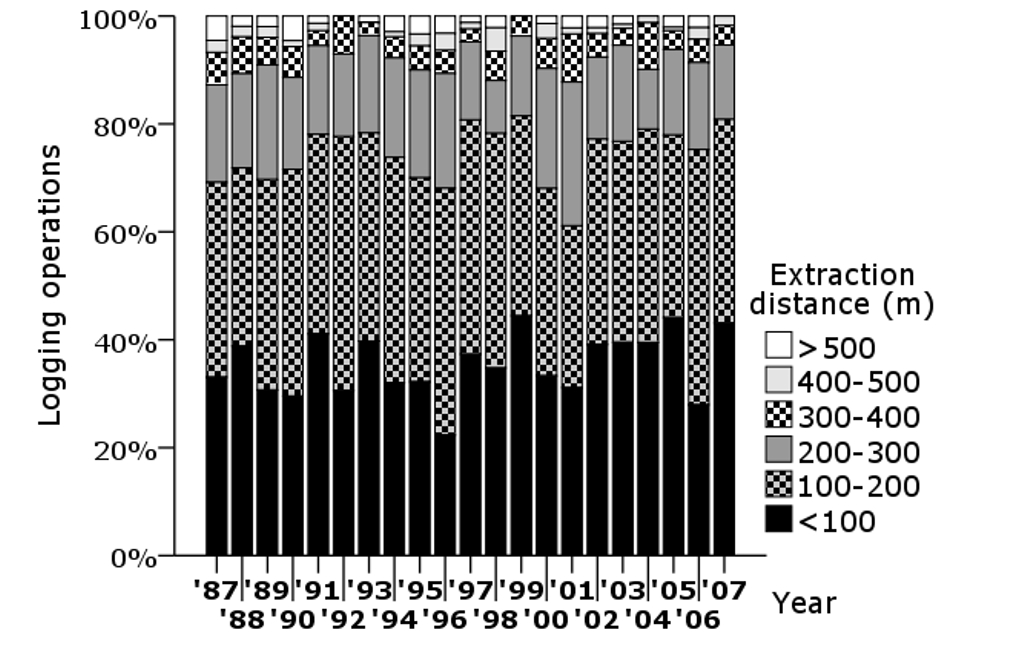
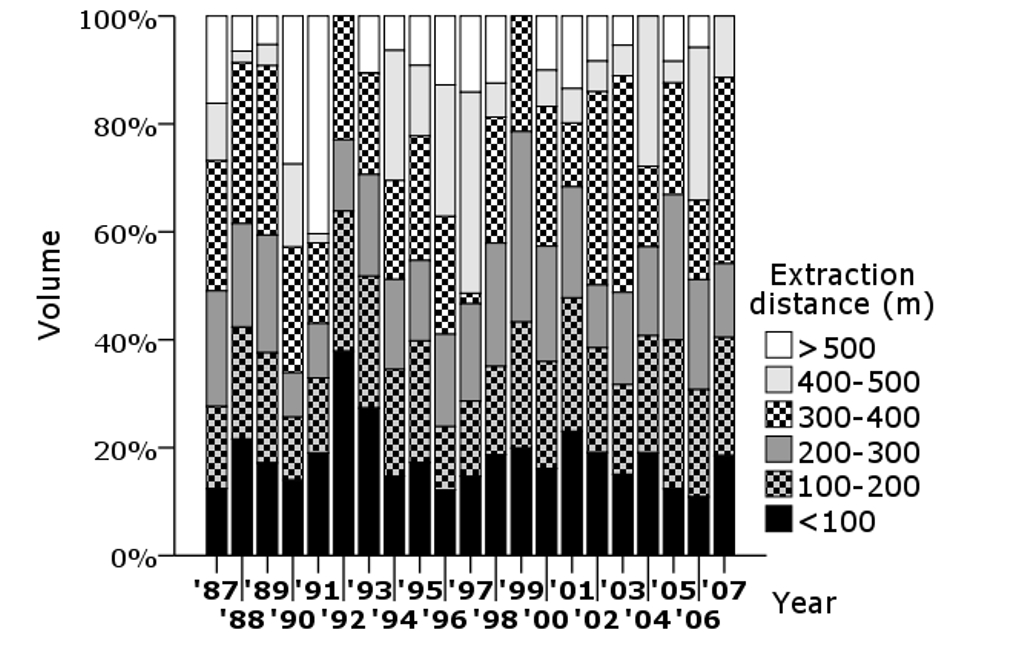
Average slope extraction distance per logging operation was 154.15 ± 112.76 m2 over the 21 years considered. As depicted in Fig. 3, the majority of logging operations (89%) over the 21 years had an extraction distance shorter than 300 m. As a consequence, the percentage of extracted merchantable wood volume within 300 m (Fig. 4) was considerable (72% of the total extracted volume).
Unclear results on the homogeneity of variances among the six extraction distance classes considered were obtained by applying the Levene test. The application of the more robust Brown-Forsythe test confirmed the homoscedasticity in the extracted wood volume among the above groups (p-value = 0.091). One-way ANOVA did not revealed significant differences in the extracted wood volumes among the six groups considered (p-value = 0.610 - Tab. 1).
Tab. 1 - Descriptive statistics of the extracted wood volume at different extraction distance intervals. Different letters in the means values indicate significant differences at the 5% level.
| Class (m3) |
Samples (n) |
Mean (m3) |
SE of the mean (m3) |
Limit at 95% | |
|---|---|---|---|---|---|
| Lower (m3) |
Upper (m3) |
||||
| <100 | 805 | 166.4a | 6.5 | 39 | 230 |
| 101-200 | 859 | 192.3a | 10.3 | 44 | 257 |
| 201-300 | 388 | 197.4a | 16.6 | 44 | 249.8 |
| 301-400 | 101 | 207.3a | 25.4 | 42 | 234.5 |
| 401-500 | 35 | 156.1a | 24.1 | 36 | 173 |
| >501 | 43 | 138.4a | 18 | 48 | 178 |
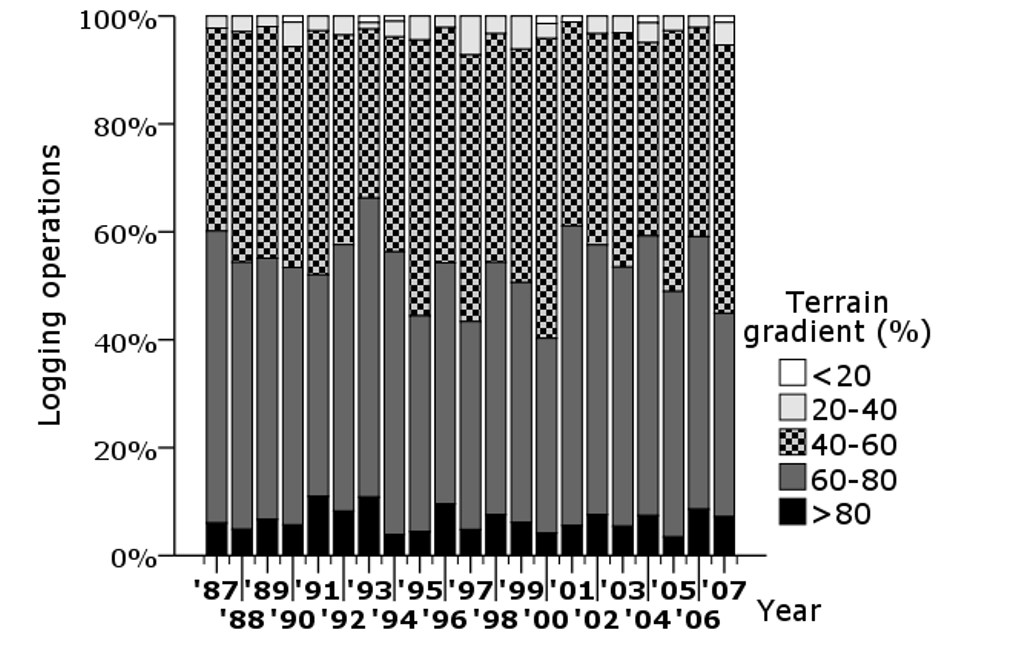
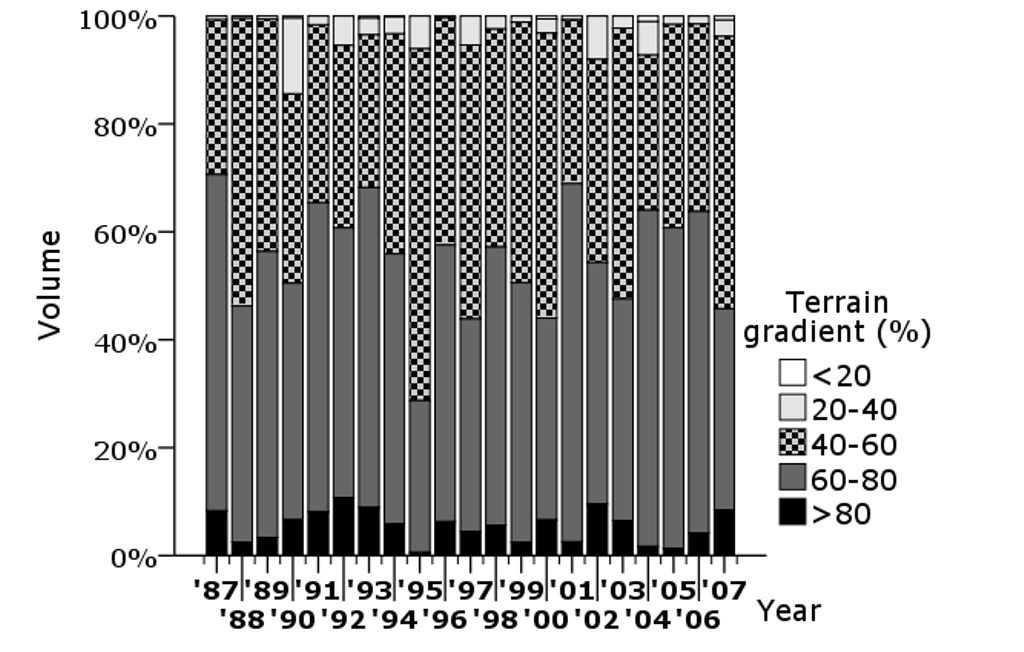
In the time span considered, logging operations were carried out often on steep slopes (average: 62.03 ± 12.51 %). A large percentage of the 2231 logging operations were located on terrain with a gradient higher than 40% (Fig. 5). The merchantable wood extracted from slopes higher than 40% was about 95% of the total extracted volume (Fig. 6).
As for the merchantable wood extracted in the mentioned slope classes, no departures from normal distributions within groups (p-value=0.063) or from equality of variances among groups (p-value = 0.085) were found. Significant differences among slope class means were found by applying One-Way ANOVA (p-value = 0.024). The HSD test was thus applied in order to compare class means. The results demonstrated that extracted wood volumes on slopes up to 20% and beyond 80% were significantly lower than those on slopes within the range 20-80% (Tab. 2).
Tab. 2 - Descriptive statistics of the extracted wood volume at terrain gradient intervals. Different letters in the means values indicate significant differences at the 5% level.
| Class (%) |
Samples (n) |
Mean (m3) |
SE of the mean (m3) |
Limit at 95% | |
|---|---|---|---|---|---|
| Lower (m3) |
Upper (m3) |
||||
| <20 | 8 | 76.5a | 14.9 | 46 | 121 |
| 21-40 | 69 | 161.3b | 22.8 | 37 | 213.5 |
| 41-60 | 958 | 175.5b | 6.5 | 39 | 257.8 |
| 61-80 | 1051 | 196.8b | 9.9 | 46 | 246 |
| >80 | 145 | 137.9c | 13.6 | 36 | 200 |
Traffic load between 1987 and 2007
Forest roads currently represent 53.5% (364.8 km) of the total road network (681.9 km). Some 38.9% of the forest road network is classified as “exclusive use for forest activities” and most of that (84.5%) is suitable for the transit of trucks without trailer.
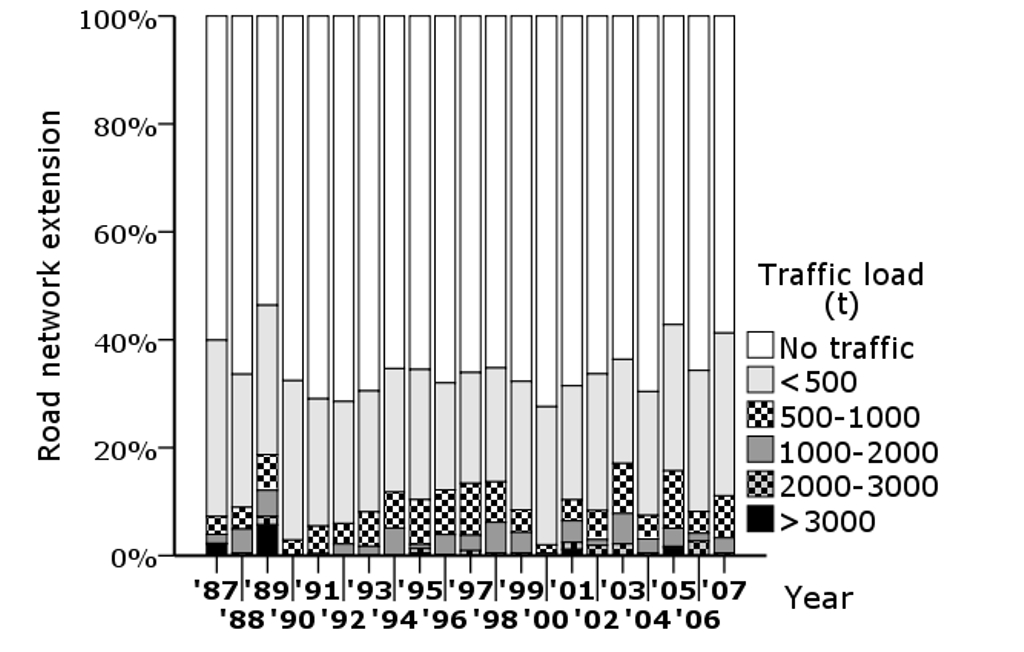
GIS analysis of the traffic load considered the segments of the secondary public and forest road network suitable for roundwood transportation by trucks. The analysis indicated that 531.2 km (77.8%) of the investigated road network likely did carry traffic generated by logging operations between 1987 and 2007. For each of the years considered a map reporting the traffic loads was created using GIS software. As detailed in Fig. 7, the distributions of the intensity of traffic loads along the road network between 1987 and 2007 are different. In particular, the segments with a traffic load higher than 3000 t per road segment per year do not seem to vary over the 21 years. A large part of the network with at least one transported load of roundwood had traffic load intensities generally less than 500 t per year. The results also revealed the lack of traffic generated by logging operations for more than 50% of the road network each year.
As for the means of each traffic load in the different road network segment, no significant differences from normal distribution were found (p-value = 0.072). As the null hypothesis of equal group variances was rejected (p-value = 0.014), the variance of the median was verified by the non-parametric Kruskal-Wallis test, which also rejected the null hypothesis that the medians were equal. This supports the hypothesis that traffic loads generated by forest operations could take different yearly intensities and distributions (data not shown), probably because of the different locations and intensities of logging operations.
Considering the total sum of traffic loads for each road network segment over the 21 years analyzed, a comparison of traffic loads was made according to the use (exclusive forest use, not exclusive forest use and secondary public road), surface (asphalt and gravel) and gradient (<6%, 6-12% and >12%) of the road segment (Tab. 3).
Tab. 3 - Means of the total traffic loads per road segment trafficked in the period 1987-2007 in relation to the use, surface and gradient of the road. Different letters in the means values indicate significant differences at the 5% level.
| Road segment | Samples (n) |
Mean (t) |
SE of the mean (t) |
Limit at 95% | Distribution (length - %) |
||
|---|---|---|---|---|---|---|---|
| Lower (t) |
Upper (t) |
||||||
| Use of the road | Exclusive forest use (A) | 1474 | 6037a | 507 | 1522 | 7552 | 25.2 |
| Not exclusive forest use (B) | 3614 | 15822b | 1222 | 3015 | 20469 | 39.1 | |
| Secondary public road (L) | 3520 | 21741c | 1613 | 3809 | 28782 | 35.7 | |
| Road surface | Asphalt | 4124 | 23673a | 637 | 20447 | 26899 | 39.5 |
| Gravel | 4484 | 10127b | 1140 | 8874 | 11379 | 60.5 | |
| Gradient, % | <6 | 2565 | 14950a | 1289 | 2265 | 21647 | 30.7 |
| 06-12 | 4040 | 15600a | 1160 | 2515 | 20587 | 45.6 | |
| >12 | 1973 | 15904a | 1831 | 2611 | 17977 | 23.7 | |
As for the means of traffic loads in relation to road use, no significant departures from normal distribution (p-value = 0.152) and from homoscedasticity (p-value = 0.062) were found. Significant differences among groups were found after One-Way ANOVA (p-value = 0.008). The HSD test revealed that the traffic load on secondary public roads was 260.1% higher than on the forest roads used exclusively for forest operations, and 37.4% higher than on forest roads not exclusively used for forest operations (Tab. 3).
With regard to the traffic load on asphalt and gravel roads, equal variances among groups were confirmed by Levene’s test (p-value = 0.102). The One-Way ANOVA rejected the null hypothesis that the means were equal (p-value = 0.000). The traffic load along asphalt roads was 133.8% higher than on gravel roads.
As for the traffic load on roads grouped according to their average slope (three classes: <6%, 6-12% and >12%), homoscedasticity was confirmed by Levene’s test (p-value = 0.851). In this case, the application of one-way ANOVA confirmed the null hypothesis that means were equal (p-value = 0.897 - Tab. 3).
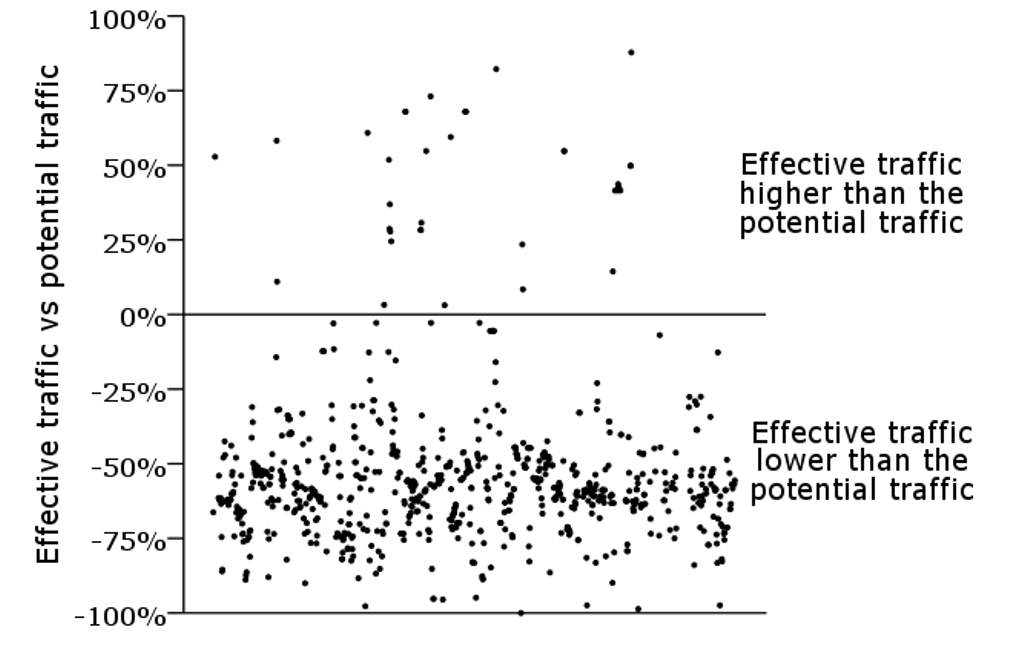
The effective traffic loads recorded over the period 1987-2007 due by logging operations (and corresponding to the effective harvested yield) was thus compared with the potential traffic loads that would be generated in the same period by harvesting the prescribed yield indicated by the FMP. As depicted in Fig. 8, the effective traffic load along the road network was mostly lower than the potential traffic load, except in 36 cases.
Fig. 8 - Effective traffic loads (actual harvest) vs. potential traffic loads (maximum allowable harvest) by the prescribed yield in the period 1987-2007.
Discussion
In this study a period of 21 years of logging operations was investigated with the aim of verifying the spatial and temporal distribution of the traffic load generated by wood transportation in a Alpine area in Italy.
The study highlighted that at least 60% of the logging operations had an extracted volume of up to 300 m3. The extraction distance of most of the logging operations was within 500 m from the road network. This situation is consistent with the results reported by Baldini et al. ([4]) indicating that most of the forest area (78.6%) in central-northern Italy is located within a distance of 500 m from the road network. Moreover, most of the logging operations, and consequently most of the extracted wood volume, are located on terrains with a slope gradient higher than 40% and lower than 80%.
The logging operation results are quite consistent with a similar analysis carried out in Japan ([23]), reporting that thinning operations tend to ignore remote forest areas (more than 300 m apart from the forest road) and declivity steeper than 90%.
With regard to the traffic load analysis, previous works have documented the function and effects of the forest road network, pointing out the relationships between the traffic and sediment productions ([30], [31], [20], [21], [33], [32]). However, few studies have considered the assessment of the traffic load due by forest operations. These were examples of traffic load analysis based on either the planned wood extraction volume ([19]) or the potential yield located within a buffer area around the forest road segment ([24]).
In this study, a 21-years period of logging operations was analyzed and mapped in order to investigate the long-term effect of the traffic load. To this purpose, the GIS analysis has taken into consideration the segments of the secondary public and forest road network suitable for roundwood transportation by trucks. Our results showed that most of the road segments with at least one transported load of roundwood had traffic load intensities generally less than 500 tons per year, and only 11.7% of the analyzed road network had a traffic load higher than 3000 tons per year.
The highest traffic loads were recorded on secondary public roads closer to the main public road network, where the end point of the traffic flow analysis was set. This confirmed the results obtained by Nevečerel et al. ([24]) in Croatia, although in that area a consistent part of the road network had a traffic load higher than 30 000 tons in 10 years.
The results of the study also showed that the highest traffic loads were registered on the road segments with asphalt surface, while there was no significant difference between road segments with different slopes.
In addition, the distribution of traffic loads over time and features of the road network showed that the traffic load due by logging operations may vary in intensity and distribution over the years, probably due to the different locations and intensities of the logging operations.
This investigation also revealed that the forest road network considered has an actual traffic load lower than its potential. This is due to the difference between the effective and prescribed harvest yield, the former being only 45 % of the latter (as reported by the FMP). Underexploitation of prescribed yields is quite common in north-eastern Italy, as reported in Emer et al. ([10]). On the other hand, the effective traffic load recorded was rarely higher than the potential traffic loads. By analyzing the notes reported in the harvesting schedules describing the logging operations considered in this study, most situations concerned the harvesting of a large amount of wind- or snow-thrown timber, thus explaining the anomaly in the effective traffic load on local road networks.
Conclusions
In summary, the GIS methodology developed in this study for the traffic load determination using time data of logging operations could be useful for further analyses to identify solutions for reducing the impact of the traffic load due by logging operations on the forest environment, such as sediment production, and to identify the management priorities for the forest road network. The temporal analysis of traffic loads on the forest road network can also provide a prediction of road maintenance and eventual upgrading costs.
Acknowledgments
The Authors express their appreciation to Dott. Andrea Bagattini for his cooperation in the collection of data. A special thanks go to Prof. Peter Ackerman from the University of Stellenbosch (South Africa) for his helpful suggestions.
References
Gscholar
Gscholar
Gscholar
Gscholar
Gscholar
Gscholar
Gscholar
Gscholar
Gscholar
Gscholar
Gscholar
Gscholar
Gscholar
Gscholar
Gscholar
Authors’ Info
Authors’ Affiliation
M Pellegrini
R Cavalli
Department of Land, Environment, Agriculture and Forestry, University of Padua, v.le dell’Università 16, I-35020 Legnaro (PD - Italy)
Corresponding author
Paper Info
Citation
Grigolato S, Pellegrini M, Cavalli R (2013). Temporal analysis of the traffic loads on forest road networks. iForest 6: 255-261. - doi: 10.3832/ifor0773-006
Academic Editor
Renzo Motta
Paper history
Received: Sep 12, 2012
Accepted: Feb 15, 2013
First online: Jun 13, 2013
Publication Date: Oct 01, 2013
Publication Time: 3.93 months
Copyright Information
© SISEF - The Italian Society of Silviculture and Forest Ecology 2013
Open Access
This article is distributed under the terms of the Creative Commons Attribution-Non Commercial 4.0 International (https://creativecommons.org/licenses/by-nc/4.0/), which permits unrestricted use, distribution, and reproduction in any medium, provided you give appropriate credit to the original author(s) and the source, provide a link to the Creative Commons license, and indicate if changes were made.
Web Metrics
Breakdown by View Type
Article Usage
Total Article Views: 55929
(from publication date up to now)
Breakdown by View Type
HTML Page Views: 47077
Abstract Page Views: 3151
PDF Downloads: 4211
Citation/Reference Downloads: 19
XML Downloads: 1471
Web Metrics
Days since publication: 4585
Overall contacts: 55929
Avg. contacts per week: 85.39
Article Citations
Article citations are based on data periodically collected from the Clarivate Web of Science web site
(last update: Mar 2025)
Total number of cites (since 2013): 23
Average cites per year: 1.77
Publication Metrics
by Dimensions ©
Articles citing this article
List of the papers citing this article based on CrossRef Cited-by.
Related Contents
iForest Similar Articles
Research Articles
Deploying an early-stage Cyber-Physical System for the implementation of Forestry 4.0 in a New Zealand timber harvesting context
vol. 17, pp. 353-359 (online: 13 November 2024)
Research Articles
Analysis of dust exposure during chainsaw forest operations
vol. 10, pp. 341-347 (online: 23 February 2017)
Research Articles
Comparison of alternative harvesting systems for selective thinning in a Mediterranean pine afforestation (Pinus halepensis Mill.) for bioenergy use
vol. 14, pp. 465-472 (online: 16 October 2021)
Research Articles
Estimating machine impact on strip roads via close-range photogrammetry and soil parameters: a case study in central Italy
vol. 11, pp. 148-154 (online: 07 February 2018)
Research Articles
Exploring the reliability of CAN-bus data in assessing forwarder rolling resistance under real working conditions
vol. 17, pp. 360-369 (online: 13 November 2024)
Research Articles
NIR-based models for estimating selected physical and chemical wood properties from fast-growing plantations
vol. 15, pp. 372-380 (online: 05 October 2022)
Research Articles
Examining the evolution and convergence of wood modification and environmental impact assessment in research
vol. 10, pp. 879-885 (online: 06 November 2017)
Research Articles
Identification of wood from the Amazon by characteristics of Haralick and Neural Network: image segmentation and polishing of the surface
vol. 15, pp. 234-239 (online: 14 July 2022)
Research Articles
Estimation of total extractive content of wood from planted and native forests by near infrared spectroscopy
vol. 14, pp. 18-25 (online: 09 January 2021)
Research Articles
Influence of slope on physical soil disturbance due to farm tractor forwarding in a Hyrcanian forest of northern Iran
vol. 7, pp. 342-348 (online: 17 April 2014)
iForest Database Search
Search By Author
Search By Keyword
Google Scholar Search
Citing Articles
Search By Author
Search By Keywords
PubMed Search
Search By Author
Search By Keyword


