

Synergies and trade-offs between carbon stocks and climax community representativeness in subtropical montane forests under different management systems
iForest - Biogeosciences and Forestry, Volume 19, Issue 6, Pages 411-420 (2026)
doi: https://doi.org/10.3832/ifor4990-019
Published: Nov 12, 2026 - Copyright © 2026 SISEF
Research Articles
Abstract
Forests play a crucial role in regulating global atmospheric carbon and provide multiple ecosystem services. Forest management currently faces two major global challenges: climate change and biodiversity loss. Management strategies such as forest protection (PRO), sustainable management (MAN), and restoration (RES) - key elements of Nature-based Solutions - must therefore promote both carbon storage and sequestration while conserving biodiversity and maintaining ecosystem integrity. In this study, we evaluated these three forest management systems in the Southern Andean Yungas (SAY) of northern Argentina. We characterized carbon storage across different pools, as well as species richness, biodiversity, and structural attributes, and analyzed the relationships among these variables. Our results indicate a clear decoupling between species richness and carbon storage (ρ = 0.30; p = 0.16). The three forest sites exhibited distinct characteristics. Compared to the MAN and RES sites, PRO stored 150% and 73% more total carbon, respectively, concentrated mainly in the aboveground biomass of adult trees. Although PRO had lower richness than the other sites, it best represented the late-successional community, with the highest proportion of climax species (86%) and higher average structural values (DBH and height). These findings suggest that carbon stabilization in SAY is driven more by functional identity and structural maturity than by simple species counts. Furthermore, our results indicate that the efficiency of forest protection as an NbS lies in its capacity to maintain a mature forest structure that could potentially regulate soil microclimates and slow organic matter turnover. We also identified native species with potential “carbon-ecological benefits” for the region. Based on management and restoration practices to date, forest protection is the most effective NbS for long-term carbon retention and biodiversity conservation in subtropical montane forests.
Keywords
Biomass, Biodiversity, Ecosystem Services, Forest Conservation, Nature-based Solutions, Soil, Yungas
Introduction
Forests are the most important terrestrial carbon (C) reservoirs, playing a key role in balancing global atmospheric carbon dioxide (CO2) by storing the equivalent of 60% of fossil fuel emissions ([34]). Consequently, these ecosystems are fundamental for achieving the Sustainable Development Goals (SDGs) of the 2030 Agenda, supporting climate mitigation and maintaining the flow of critical ecosystem services (ES) - such as food, water, soil regulation and biodiversity - all of which are increasingly threatened by anthropogenic factors. Forest management currently faces two major global challenges: climate change and biodiversity loss ([38]).
Prioritizing carbon storage as a rapid climate mitigation strategy without accounting for biodiversity has generated substantial debate, particularly regarding restoration approaches based on monoculture ([22]). In contrast, Nature-based Solutions (NbS) - including forest protection, sustainable management, and restoration - aim to enhance carbon sequestration while simultaneously conserving biodiversity and ecosystem integrity. These natural, land-based mitigation solutions are among the fastest and most cost-effective measures for climate action, potentially generating significant complementary benefits ([22], [45]).
The relationship between carbon storage, biodiversity, land use, and the conservation of forest ecosystems - particularly tropical and subtropical montane forests - remains uncertain due to its complexity ([7]). Studies report inconsistent patterns across ecosystems and spatial scales, with limited research addressing these variables within specific management systems. While some authors identify positive relationships between carbon storage and attributes such as species richness, biodiversity ([23], [27], [47], [4]) or tree dimensions ([37], [47]), others report non-significant associations ([5]), suggesting that this relationship is highly context-dependent and influenced by methodological approaches and species covered. For instance, positive correlations in tropical forests often reflect disturbance gradients in degraded areas but may disappear in stable, carbon-rich natural forests ([20]). Forest management systems further shape biodiversity-carbon relationships by modifying structure, composition, and successional dynamics. Studies analyzing these associations across different biomes demonstrate that, while protected forests typically exhibit higher carbon stocks and richness ([48]), managed forests are influenced by harvest intensity (harvested timber volume), the proportion of non-native/native tree species, anthropogenic/natural deadwood ([2], [28]) or the type and impact of logging practices ([24]). In restored forests, carbon and richness may be lower than in mature stands ([48], [20], [5]); however, positive relationships often emerge as succession progresses ([20]).
Despite this global body of work, empirical evidence from Southern Andean Yungas (SAY) remains scarce ([7], [30], [4]). These ecosystems, characterized by high humidity, vast altitudinal gradients, and exceptional endemism ([17], [32]), serve as critical carbon sinks ([18]). In these montane forests, high carbon storage capacity depends not only on biomass production but also on slow carbon release through decomposition processes mediated by soil microorganisms ([41], [10]). Recent regional assessments suggest that the synergy between carbon and biodiversity in SAY (or simply “Yungas”) is frequently mediated by local disturbance history and climatic variability rather than simple linear associations ([35]). For instance, while broad-scale studies suggest a general positive correlation between soil organic carbon (SOC) and biodiversity due to enhanced fertility and niche availability ([33], [35]), this pattern is highly context-dependent and exhibits significant regional decoupling. In the Yungas and other Argentine ecoregions, areas with high carbon stocks often coincide with high interannual climatic variability, suggesting that high-carbon forests may face greater conservation risks under shifting temperature and phenological regimes ([35]). This reinforces the necessity of site-specific studies.
Given the limited empirical evidence from subtropical montane forests, this study seeks to clarify the context-dependency of the biodiversity-carbon relationship in the SAY. Our goal is to assess how forest management-driven changes in forest structure affect biodiversity and carbon sink capacity, providing evidence-based insights for regional forest policy and climate change mitigation. We tested three hypotheses: (i) a positive correlation exists between carbon stocks and biodiversity; (ii) increased diversity is associated with a higher prevalence of late-successional species; and (iii) protected forests exhibit superior carbon and biodiversity metrics compared to managed or restored areas. Our results help clarify potential synergies and trade-offs between carbon storage and biodiversity, providing a framework for informed management of subtropical montane forests.
Materials and methods
Study area and case studies
We conducted the study in the Caimancito Forest Basin, Jujuy Province, Argentina. (Fig. 1a), situated between 23° 28′ 25″ and 24° 28′ 13″ S latitude and 64° 08′ 66″ and 65° 15′ 55″ W longitude. The area has a mean annual temperature of 20.8 °C and an average precipitation of 825 mm (based on historical records from INTA Salta, Argentina). Its altitude ranges from 400 to 700 meters above sea level. The predominant soils are Mollisols and Entisols. The ecoregion corresponds to the Southern Andean Yungas ([17]). Our study area is specifically located in the lower sector of SAY, where the most abundant species include Phyllostylon rhamnoides, Calycophyllum multiflorum, Cedrela balansae, Myroxylon peruiferum, and Anadenanthera colubrina, among others. Approximately 34% of the basin consists of managed forest lands, 18% are forest areas undergoing restoration activities, and 26% are protected forests. The remaining area corresponds to populated zones, roads, and agricultural land ([42]).
Fig. 1 - Study area and sampling design. (a) Caimancito Forest Basin, Jujuy province, Argentina. The black square, triangle, and circle indicate case-study locations. (PRO): protected forest; (MAN): forest under management; (RES): forest under restoration. (b) Sampling scheme showing the different carbon pools studied and plot sizes. The white, light grey, and dark grey areas indicate the sampling plots corresponding to the different carbon pools, while the black circle marks the location where soil carbon was sampled. (AGBa): aboveground biomass of adult trees; (AGBs): aboveground biomass of saplings; (LIB): litter biomass; (SOC): soil organic carbon.
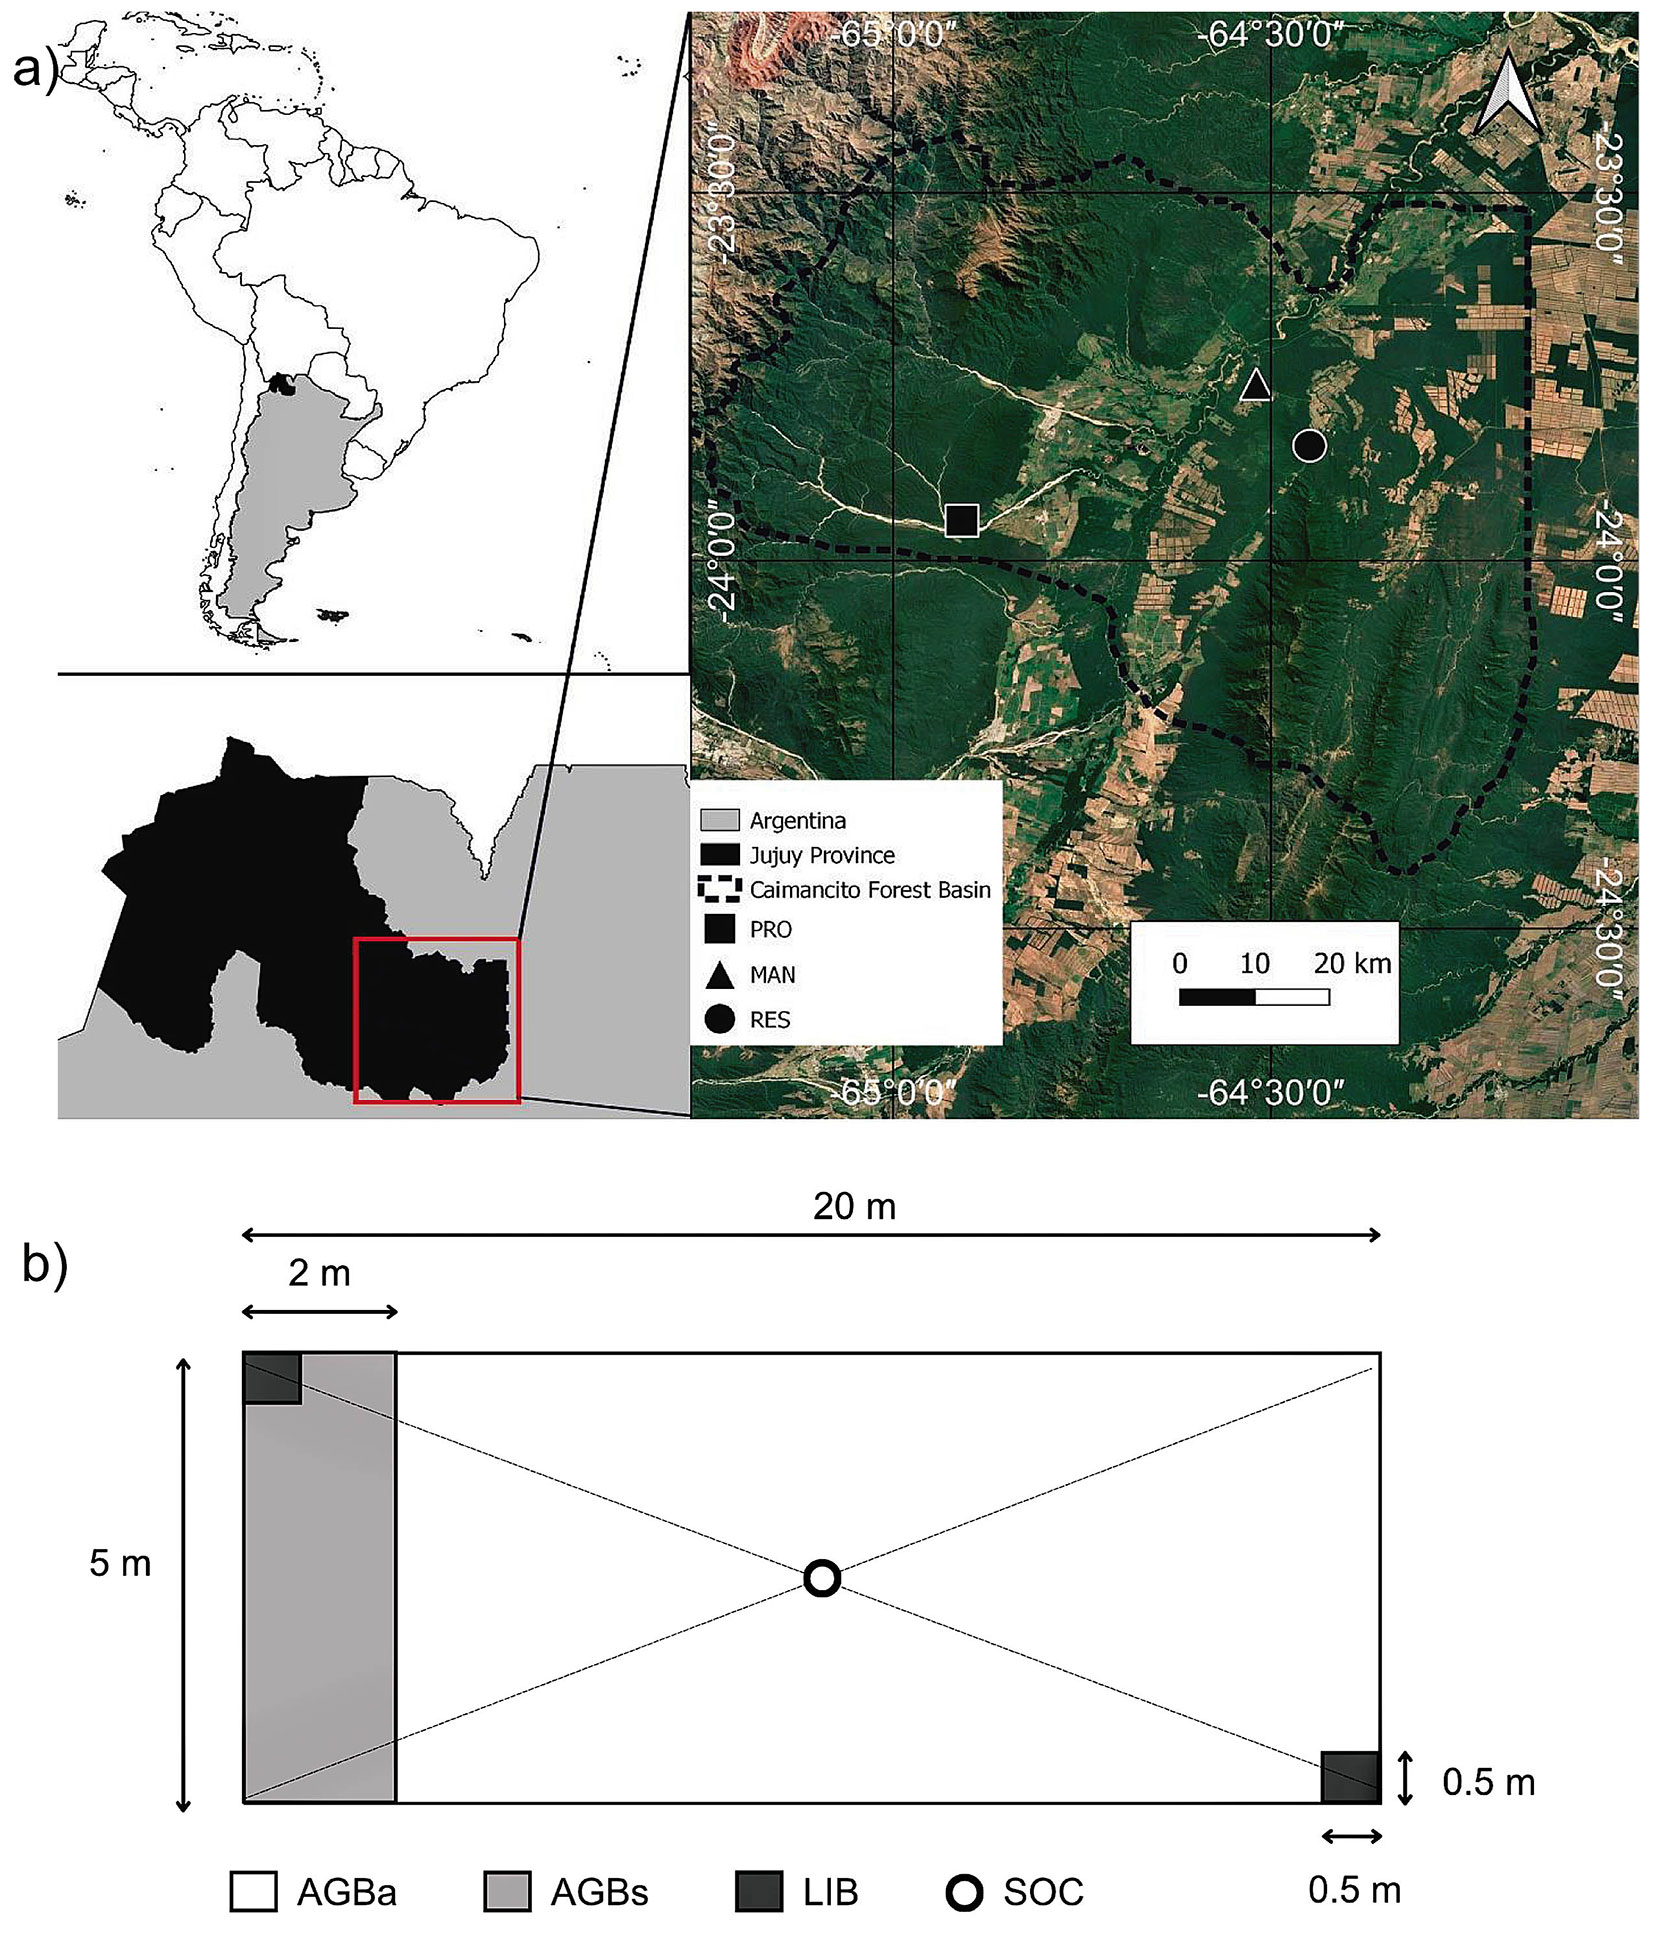
The case studies selected for this research represent different forest management systems, each corresponding to one of the Nature-based Solutions (NbS) defined by UNEP-IUCN ([45]): protection (PRO), intensive management (MAN), and restoration (RES). The selection of case studies was based on the following criteria: (i) typicality, common or average characteristics of farms within the area; (ii) physical accessibility and availability of local stakeholders; and (iii) data availability and quality. Each site is privately owned and comprises native forest (as opposed to exotic forest plantations). Tab. 1 summarizes the key characteristics of the study sites.
Tab. 1 - Case studies. Means ± standard deviation are reported. (*): at a depth of 60 cm; (**): at a depth of 30 cm; (1, 2): Eliano (unpublished data).
| Group | Characteristics | Unit | PRO | MAN | RES |
|---|---|---|---|---|---|
| Soil characteristics | Order (USDA, Soil Taxonomy) | - | Entisol- Mollisol |
Mollisol | Mollisol |
| Textural class* | - | Loam | Sandy loam | Loam | |
| Sand* | % | 39 ± 1 | 70 ± 8 | 47 ± 2 | |
| Silt* | % | 43 ± 1 | 21 ± 8 | 38 ± 4 | |
| Clay* | % | 18 ± 0 | 10 ± 0 | 15 ± 1 | |
| Moisture content** | % | 9.37 ± 1.28 | 7.48 ± 1.42 | 9.82 ± 3.36 | |
| Bulk density** | g cm-3 | 1.24 ± 0.17 | 1.53 ± 0.13 | 1.28 ± 0.17 | |
| Organic matter** | % | 4.35 ± 1.29 | 2.55 ± 0.67 | 4.62 ± 1.68 | |
| Soil-water suspension pH (1:2.5)* | - | 6.55 ± 0.92 | 7.45 ± 0.49 | 7.35 ± 0.35 | |
| Effective depth | cm | - | >90 1 | >90 2 | |
| Stand characteristics | Total area | ha | 1200 | 3090 | 2190 |
| Forest area | ha | 1200 | 1330 | 1460 | |
| Harvested volume | m3 y-1 | 0 | 500 | 0 | |
| Basal area (DBH ≥10 cm) | m2 ha-1 | 76 ± 56 | 24 ± 20 | 27 ± 19 | |
| DBH of trees ≥ 10 cm | cm | 35 ± 16 | 24 ± 12 | 22 ± 11 | |
| H of trees (DBH ≥ 10cm) | m | 12 ± 3 | 8 ± 3 | 10 ± 3 | |
| Tree density (DBH ≥ 10cm) | Ind ha-1 | 650 ± 233 | 414 ±195 | 550 ± 239 | |
| Tree density (DBH < 10cm) | Ind ha-1 | 413 ± 309 | 1243 ± 900 | 600 ± 227 |
The PRO site is entirely covered by native forest. At present, there is no anthropogenic intervention other than scientific research activities. However, selective harvesting of trees with superior characteristics occurred 25 years ago. The tree cover is continuous.
At the MAN site, forest covers 43% of the total area, while the remainder is used for livestock production and agriculture; the forested area is discontinuous, forming patches interspersed among croplands. Provincial Resolution No. 81/2009 ([42]) regulates forest management and sets only the minimum cutting diameters (MCD) for each species (ranging from 30 to 40 cm in diameter at breast height, DBH), along with the technical and procedural requirements for submitting Sustainable Forest Management and Forest Operational plans. Logging typically uses outdated machinery and equipment, and usually involves only one unit of each type, such as a tractor, chainsaw, supply transport vehicle, and skidder. For timber harvesting, individuals that have reached the MCD are marked among the ten authorized species and harvested within a compartment system, most commonly 400 ha, in which the entire property is divided accordingly. Extraction roads are opened with bulldozers, while in areas with steeper slopes, manual trails are created, and trees are felled and extracted with chainsaws. More than 50% of the total tree volume remains on site after harvesting (CRS, pers. obs.), as only the merchantable stems are utilized. In the case study, the annual harvested volume is 500 m3.
The RES site has 67% of its total area covered by forest. However, no timber harvesting has occurred over the past 20 years because the remaining trees have small diameters. Current activities are limited to enrichment planting in strips with native timber species such as C. balansae, Cordia trichotoma, Handroanthus impetiginosus, Tipuana tipu, and A. colubrina, at a density of 150-200 plants per hectare. Restoration also includes silvicultural tasks aimed at maximizing carbon sequestration in the forest stand, in line with Forest Stewardship Council (FSC) criteria. In the inter-rows of the enriched areas, silvicultural treatments such as tending, release, and the removal of overmature trees are applied to promote the growth of future crop trees. These activities include branch reduction, removing non-utilized products for firewood, and other conventional practices to favor future trees, including reopening former logging trails.
In the basin, forest extraction often occurs without systematic records of standing timber stocks, extracted volumes, or harvest intensities (LAM, pers. obs.).
Sampling design
The study used an observational sampling design based on 23 randomly distributed main rectangular plots (100 m2), each containing one nested 10 m2 subplot (Fig. 1b). We located the main plots based on site accessibility, ensuring a minimum distance of 50 m between them to minimize spatial autocorrelation. We established all units within the native forests of the three study sites. We evaluated carbon storage and forest biodiversity.
Carbon storage
To estimate carbon stocks, we assessed three biomass pools: aboveground woody biomass (AGB), litter biomass (LIB), and soil ([26]).
Aboveground woody biomass (AGB) is the aboveground living organic matter from adult trees (DBH ≥10 cm) and saplings (DBH <10 cm and total height ≥0.5 m). In each main plot, all adult trees were identified, while in the subplots, the saplings were identified, recording: scientific name, DBH (cm), total height (measured from the base to the tip of the crown, m), and quality: (I) healthy, (II) deformed, (III) diseased - hollow, (IV) dead standing, and (V) fallen. We estimated woody aboveground biomass density (dry weight per unit area) using allometric equations reported for similar ecological zones (Tab. 2) for both adult trees (AGBa) and saplings (AGBs). The basic density, defined as the ratio of dry weight to green wood volume and characteristic of each species, was taken from the bibliography ([25]); when the tree could not be taxonomically identified, the plot’s average basic density was used. To estimate carbon stored in the AGB (CAGB), we assumed a carbon fraction of 0.47 ([26]) and expressed it as CAGBa or CAGBs for adult trees or saplings, respectively (t ha-1). To adjust biomass for tree quality, we used factors of 0.9 (quality III), 0.8 (quality IV), and 0.7 (quality V). Finally, we calculated the CAGB at the species level.
Tab. 2 - Allometric equations used to calculate aboveground biomass (AGB, kg per tree). (DBH): diameter at breast height (cm); (H): total height (m); (q): wood basic density (g cm-3); (n): number of samples; (R2): coefficient of determination; (RSE): residual standard error.
Litter biomass (LIB) refers to non-living biomass on the soil at different stages of decomposition, including leaves, dead roots, and branches or trunks smaller than 10 cm in diameter. Within the main plots (Fig. 1b), we established two 50 × 50 cm quadrats and carefully removed all leaf litter. We divided the samples into two smaller subsamples and dried them in the laboratory at 75 °C for 24 hours to obtain the dry weight fraction per sample, with the dry biomass contained in the litterfall (LIB) per hectare estimated using eqn. 1:
where LIB is the biomass in litterfall (t ha-1), DWS is the dry weight of the subsample after oven-drying (g), FWS is the fresh weight of the subsample before oven-drying (g), TFW is the total fresh weight of the field-collected sample (g), and 0.04 is the conversion factor to tons per hectare. We applied a dry-matter C fraction of 0.37 ([26]) and expressed the result as CLIB in tC ha-1.
Soil carbon corresponds to the C stored in the first 30 cm of the soil. In the center of each main plot, we dug a 30 cm deep test pit to measure soil organic carbon and bulk density, taking one sample per plot (Fig. 1b). We estimated organic C using the micro Walkley-Black method, while bulk density was calculated using the cylinder method as dry weight divided by the cylinder volume (100 cm3 - [44]). To calculate soil organic carbon (SOC) in tC ha-1, we first determined the soil volume at the sampling depth over one hectare. We then calculated the soil mass for this volume by multiplying it by the bulk density and finally obtained the mass of organic C using the organic C content (%), i.e., the 1:100 ratio of organic C in the soil. This procedure corresponds to eqn. 2, adapted from Manrique et al. ([29]):
where SOC is the organic carbon contained in the soil (tC ha-1), d is the soil depth (cm), b is the soil bulk density (g cm-3), and OC is the organic carbon content (%). Using these units, we could work with SOC results in tC ha-1, since they are directly equivalent.
We calculated the total C stock in dry weight per unit area, retained in the four ecosystem reservoirs at each site, using eqn. 3:
where Cstock is the total carbon (tC ha-1), CAGBa is the carbon retained in the woody aboveground biomass of adult trees (tC ha-1), CAGBs is the carbon retained in the woody aboveground biomass of saplings (tC ha-1), CLIB is the carbon retained in the litter (tC ha-1), and SOC is the soil organic carbon (tC ha-1).
Characterization of forest biodiversity
We taxonomically identified adult trees in the main plots with help from local guides, then determined the percentage of species typical of the ecoregion climax community. We registered the identified species in the Herbarium of the Faculty of Natural Sciences at the University of Salta. We determined species richness, as well as absolute and relative abundance (density of individuals, ind ha-1) and frequency (occurrence in sampling units, number of occurrences/total plots sampled) for each species. We assessed diversity at each site using Hill numbers in iNEXT.4steps Online software ([12], [11]). To address differences in sampling effort between sites, we estimated the expected number of species using the mean of four non-parametric estimators (ICE, ACE, Chao2, and Bootstrap), as described by Chaves & Bicca-Marquez ([15]). We performed all analyses using EstimateS Software version 9.1.0 ([16]), using the number of samples corresponding to the site with the lowest applied intensity. We also created rarefaction curves to compare species accumulation across the three sites as a function of the number of individuals.
For structural attribute analysis, we determined basal area and abundance distribution by diameter class. We analyzed saplings (DBH < 10 cm), trees with diameters between 5 and 10 cm DBH, adult trees (DBH > 10 cm), and trees at the cutting point (DBH ≥ 30 cm), in line with local regulations. We also calculated the average diameter and height for both adult and regenerating trees at each study site.
The Importance Value Index (IVI) for adult species was also studied, which includes relative abundance, frequency, and dominance, related to basal area (eqn. 4).
where IVI is the importance value index of species i (%), RAi is the abundance of species i relative to total abundance (%); RFi is the frequency of species i relative to the sum of absolute frequencies (%); RDi is the dominance of species i relative to the sum of absolute dominances (%).
For adult species exhibiting high IVI and C storage levels, a bibliographic review of their ecological characteristics was conducted.
The methodological approach presented here is simple and uses data easily accessible to forest producers, facilitating replication in other forest basins.
Data analysis
The normality and homogeneity of the data were evaluated using the Shapiro-Wilk and Levene tests, respectively. Because the data did not follow a normal distribution, we assessed differences among the three study sites in C stock and structural attributes using the non-parametric Kruskal-Wallis test, followed by pairwise Mann-Whitney tests with Holm correction. For AGB in particular, we calculated a mean from all allometric equations because we detected no significant differences between adult and sapling estimates. The relationship between carbon (at the different levels studied) and species richness was examined using Spearman’s correlation analysis. All analyses were performed in R version 4.5.1 ([39]). Statistical significance was assessed at α = 0.05.
To ensure our local carbon data is comparable at regional and global scales, we conducted a field-based verification process using Restor®, an interactive open-data geospatial platform (Crowther Lab, ETH Zurich). While remote sensing offers an agile, practical method for site characterization, it often lacks the precision of direct field measurements needed to capture local variations driven by different forest management systems. We used direct field data to validate and calibrate spatial models based on international databases of soil organic carbon and woody plant biomass ([40], [46]). The datasets obtained for this cross-analysis featured a spatial resolution of ~500 m for aboveground biomass and ~10 km for soil organic carbon, corresponding to records from 2016 and 2010, respectively, retrieved on 21 December 2024.
Results
Carbon stock of the three management systems
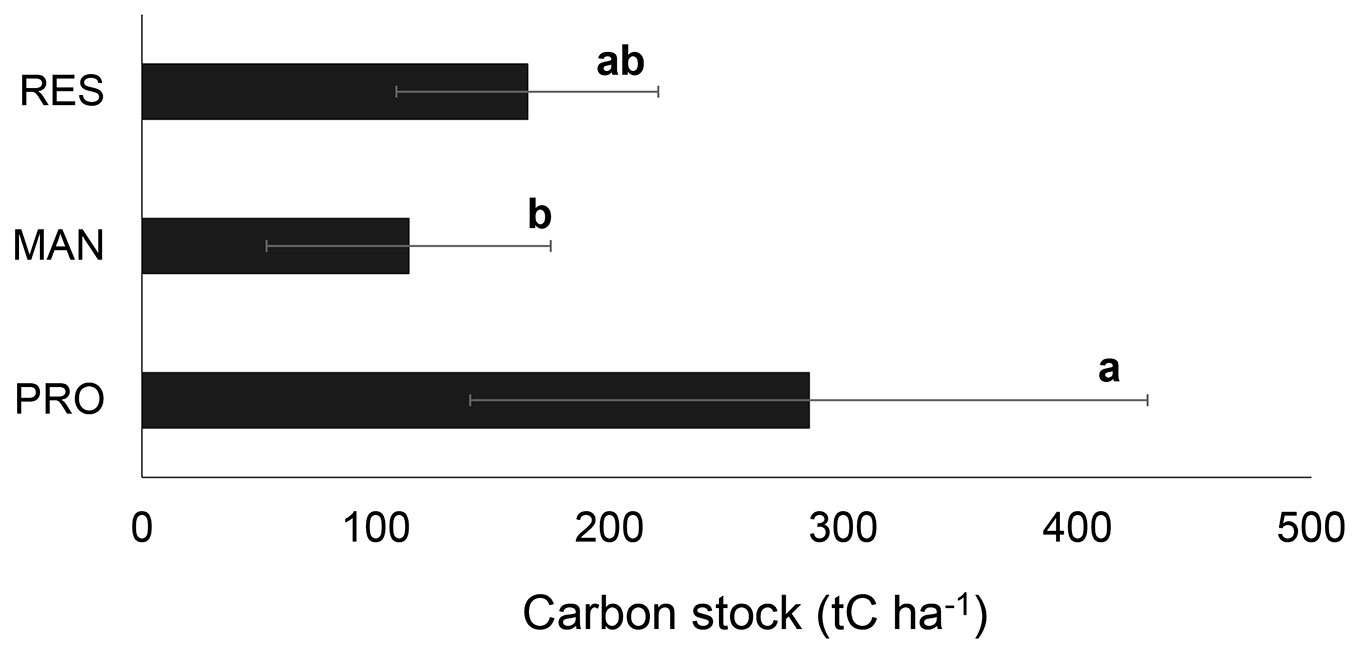
The C stock at the PRO site was 150% and 73% higher than at the MAN and RES sites, respectively; however, this difference was statistically significant only in the former comparison (H = 10.82, df = 2, p = 0.0045, ε2 = 0.44 - Fig. 2).
Fig. 2 - Carbon stock in tC ha-1 (mean ± standard deviation). Different letters indicate significant differences between sites (H = 10.82, df = 2, p = 0.0045, ε2 = 0.44). (PRO): protected forest; (MAN): forest under management; (RES): forest under restoration.
Additionally, carbon content differed significantly across ecosystem pools by forest management system (Tab. 3). In the PRO forest, CAGBa was 260% and 217% higher than in the MAN and RES forests, respectively (H = 9.30, df = 2, p = 0.0096, ε2 = 0.36). SOC was 80% higher in RES and 75% higher in PRO compared to MAN (H = 8.27, df = 2, p = 0.016, ε2 = 0.31). By contrast, the CAGBs and CLIB pools did not differ significantly between management systems (H = 0.27, df = 2, p = 0.87 and H = 3.52, df = 2, p = 0.17, respectively).
Tab. 3 - Carbon stored in ecosystem pools (tC ha-1; mean ± standard deviation) in the three management systems. (CAGBa): adult aboveground biomass carbon; (CAGBs): saplings aboveground biomass carbon; (CLIB): litter carbon. (SOC): soil organic carbon; (n): number of main plots; (PRO): protected forest; (MAN): managed forest; (RES): forest under restoration. Different letters across rows indicate significant differences (p < 0.05).
| Case study | n | CAGBa (t ha-1) |
CAGBs (t ha-1) |
CLIB (t ha-1) |
SOC (t ha-1) |
|---|---|---|---|---|---|
| PRO | 8 | 186.2 ± 145.2 b | 4.7 ± 5.1 a | 2.5 ± 1.2 a | 91.6 ± 23.3 b |
| MAN | 7 | 51.8 ± 57.9 a | 6.4 ± 9.1 a | 3.6 ± 2.2 a | 52.2 ± 21.9 a |
| RES | 8 | 58.8 ± 44.4 a | 8.0 ± 7.8 a | 3.7 ± 1.9 a | 94.3 ± 35.0 b |
In relative terms, the proportion of C stock in the AGB and soil pools was 65% and 32%, respectively, in the PRO forest, with similar proportions in the MAN forest. In the RES forest, soil had the highest carbon accumulation (58%), with only 35% in the AGB fraction. In all three systems, litter accounted for the smallest proportion of total carbon (1-3%), followed by AGBs (2-6%).
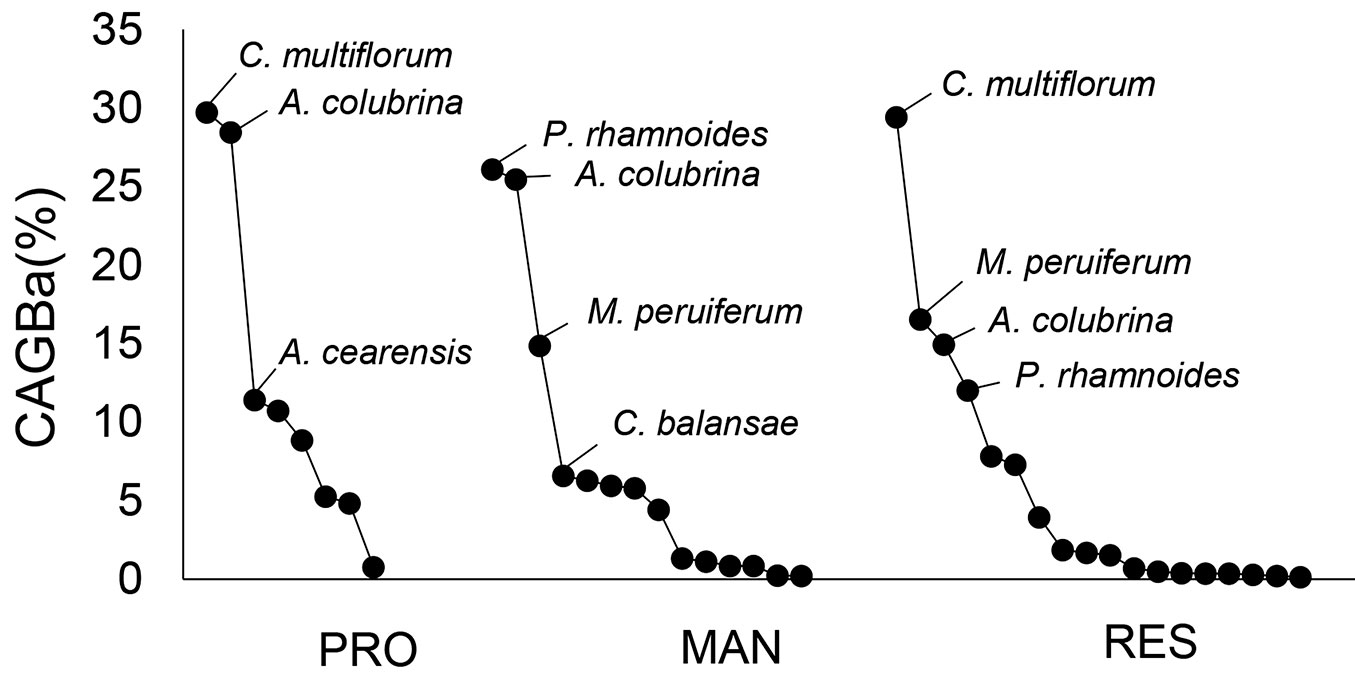
The species contributing up to 70% of the total C stock varied among sites (Fig. 3). Nevertheless, A. colubrina consistently played a pivotal role in C storage across all three locations. No single species, however, dominated C accumulation at the regional scale. Rather, a group of species - including A. colubrina, C. multiflorum, P. rhamnoides, and M. peruiferum - were key contributors at two or more sites. Across the three forests studied, the principal species by per-hectare C content accounted for about 30% of the total. C. multiflorum was dominant in both PRO and RES, while P. rhamnoides was the leading species in MAN.
Fig. 3 - Site-specific carbon storage in aboveground biomass (CAGBa, in percentage). Only species that accumulated up to 75% of total carbon are shown. (PRO): protected forest; (MAN): forest under management; (RES): forest under restoration.
Field-based verification showed that the Restor© tool generally overestimated SOC, providing values two to four times higher than in situ measurements (Tab. 4). For AGBa, satellite estimates showed greater variability across management systems. These discrepancies underscore the need to use direct field data to calibrate regional-scale models, as current global datasets - characterized by a temporal lag of nearly a decade - fail to capture local variations driven by specific forest management practices in SAY. Consequently, this cross-analysis was fundamental for validating initial satellite-derived estimates with ground-truth measurements, enabling a more precise quantification of local carbon dynamics.
Tab. 4 - Carbon stored in the adult aboveground biomass (AGBa), soil (SOC), and total carbon stocks (C stock), for each sampling site, estimated in the field and using the Restor® platform (2025). (PRO): protected forest; (MAN): forest under management; (RES): forest under restoration.
| Ecosystem pool |
Unit | PRO | MAN | RES | |||
|---|---|---|---|---|---|---|---|
| Field | Satellite | Field | Satellite | Field | Satellite | ||
| AGBa | tC ha-1 | 183.1 | 63.8 | 50.9 | 56.3 | 57.5 | 86.0 |
| SOC | tC ha-1 | 91.6 | 181.4 | 52.2 | 204.6 | 94.3 | 187.6 |
| C stock | tC ha-1 | 281.9 | 245.3 | 113.0 | 260.9 | 163.3 | 273.6 |
Forest biodiversity
Taxonomic attributes
A total of 24 species were recorded across all sites (15% not identified), with Fabaceae being the most represented (Tab. 5, Tab. S1 in Supplementary material). RES showed the highest observed species richness, followed by MAN and PRO. Across the three sites, sampling effort averaged 66% ± 15% of the estimated species, which was insufficient to determine the total number of species. This pattern was evident in the rarefaction curves (Fig. S1) and in the diversity estimates based on Hill numbers (Tab. 5), as the asymptote was not reached. The diversity results indicate that RES and MAN support more diverse communities, with a higher effective number of species than PRO. However, the PRO forest contained the greatest proportion of climax species within the ecoregion (86%). In contrast, although MAN and RES harbored a higher total number of species, these sites showed a greater representation of species not typical of the ecosystem, primarily pioneer and heliophytic species.
Tab. 5 - Structural and taxonomic attributes of the studied forests. (DBH): diameter at breast height; (H): height; (PRO): protected forest; (MAN): forest under management; (RES): forest under restoration.
| Floristic attributes | Unit | PRO | MAN | RES | ||||
|---|---|---|---|---|---|---|---|---|
| Mean | Range | Mean | Range | Mean | Range | |||
| Species richness | N | 8 | 2-6 | 14 | 1-5 | 18 | 2-7 | |
| Estimated diversity | q=1 | - | 8.49 | - | 29.45 | - | 27.89 | - |
| q=2 | - | 6.24 | - | 17.45 | - | 19.03 | - | |
| q=3 | - | 4.74 | - | 10.41 | - | 13.71 | - | |
| Climax species | % | 86 | - | 46 | - | 50 | - | |
Structural attributes
In terms of structural attributes (Tab. 1), all three ecosystems exhibited the typical inverted J-shaped diameter-class distribution characteristic of diverse, uneven-aged forests. Average tree diameters did not exceed 35 cm, except for a few isolated individuals (up to 90 cm DBH in PRO, and a maximum of 55 cm in MAN and RES). Notable differences among these distributions were observed. The PRO forest had 163% to 178% higher density of adult trees with diameters greater than 30 cm, exceeding the minimum felling diameter established by local regulations, than the other sites. RES had 31% and 80% higher sapling densities between 5 and 10 cm DBH than MAN and PRO, respectively, supporting the forest’s long-term productivity. The MAN forest had the highest density of regenerating trees, although only 7% exceeded 5 cm DBH, compared to approximately 17% at the other sites.
Furthermore, the average DBH of adult trees in the PRO forest was 35% and 56% greater than in the MAN and RES forests, respectively, with significant differences (H = 20.91, p < 0.0001, df = 2, ε2 = 0.16). Saplings also had larger diameter values in PRO and RES than in MAN (92% and 85% greater, respectively - H = 19.41, p < 0.0001, df = 2, ε2 = 0.11). We also detected significant differences in adult tree heights (H = 22.018, p < 0.0001, df = 2, ε2 = 0.16), with PRO exhibiting the tallest individuals. For saplings, significant differences were also found (H = 8.62, p = 0.01, df = 2, ε2 = 0.04), with RES showing the highest average height.
Importance Value Index (IVI)
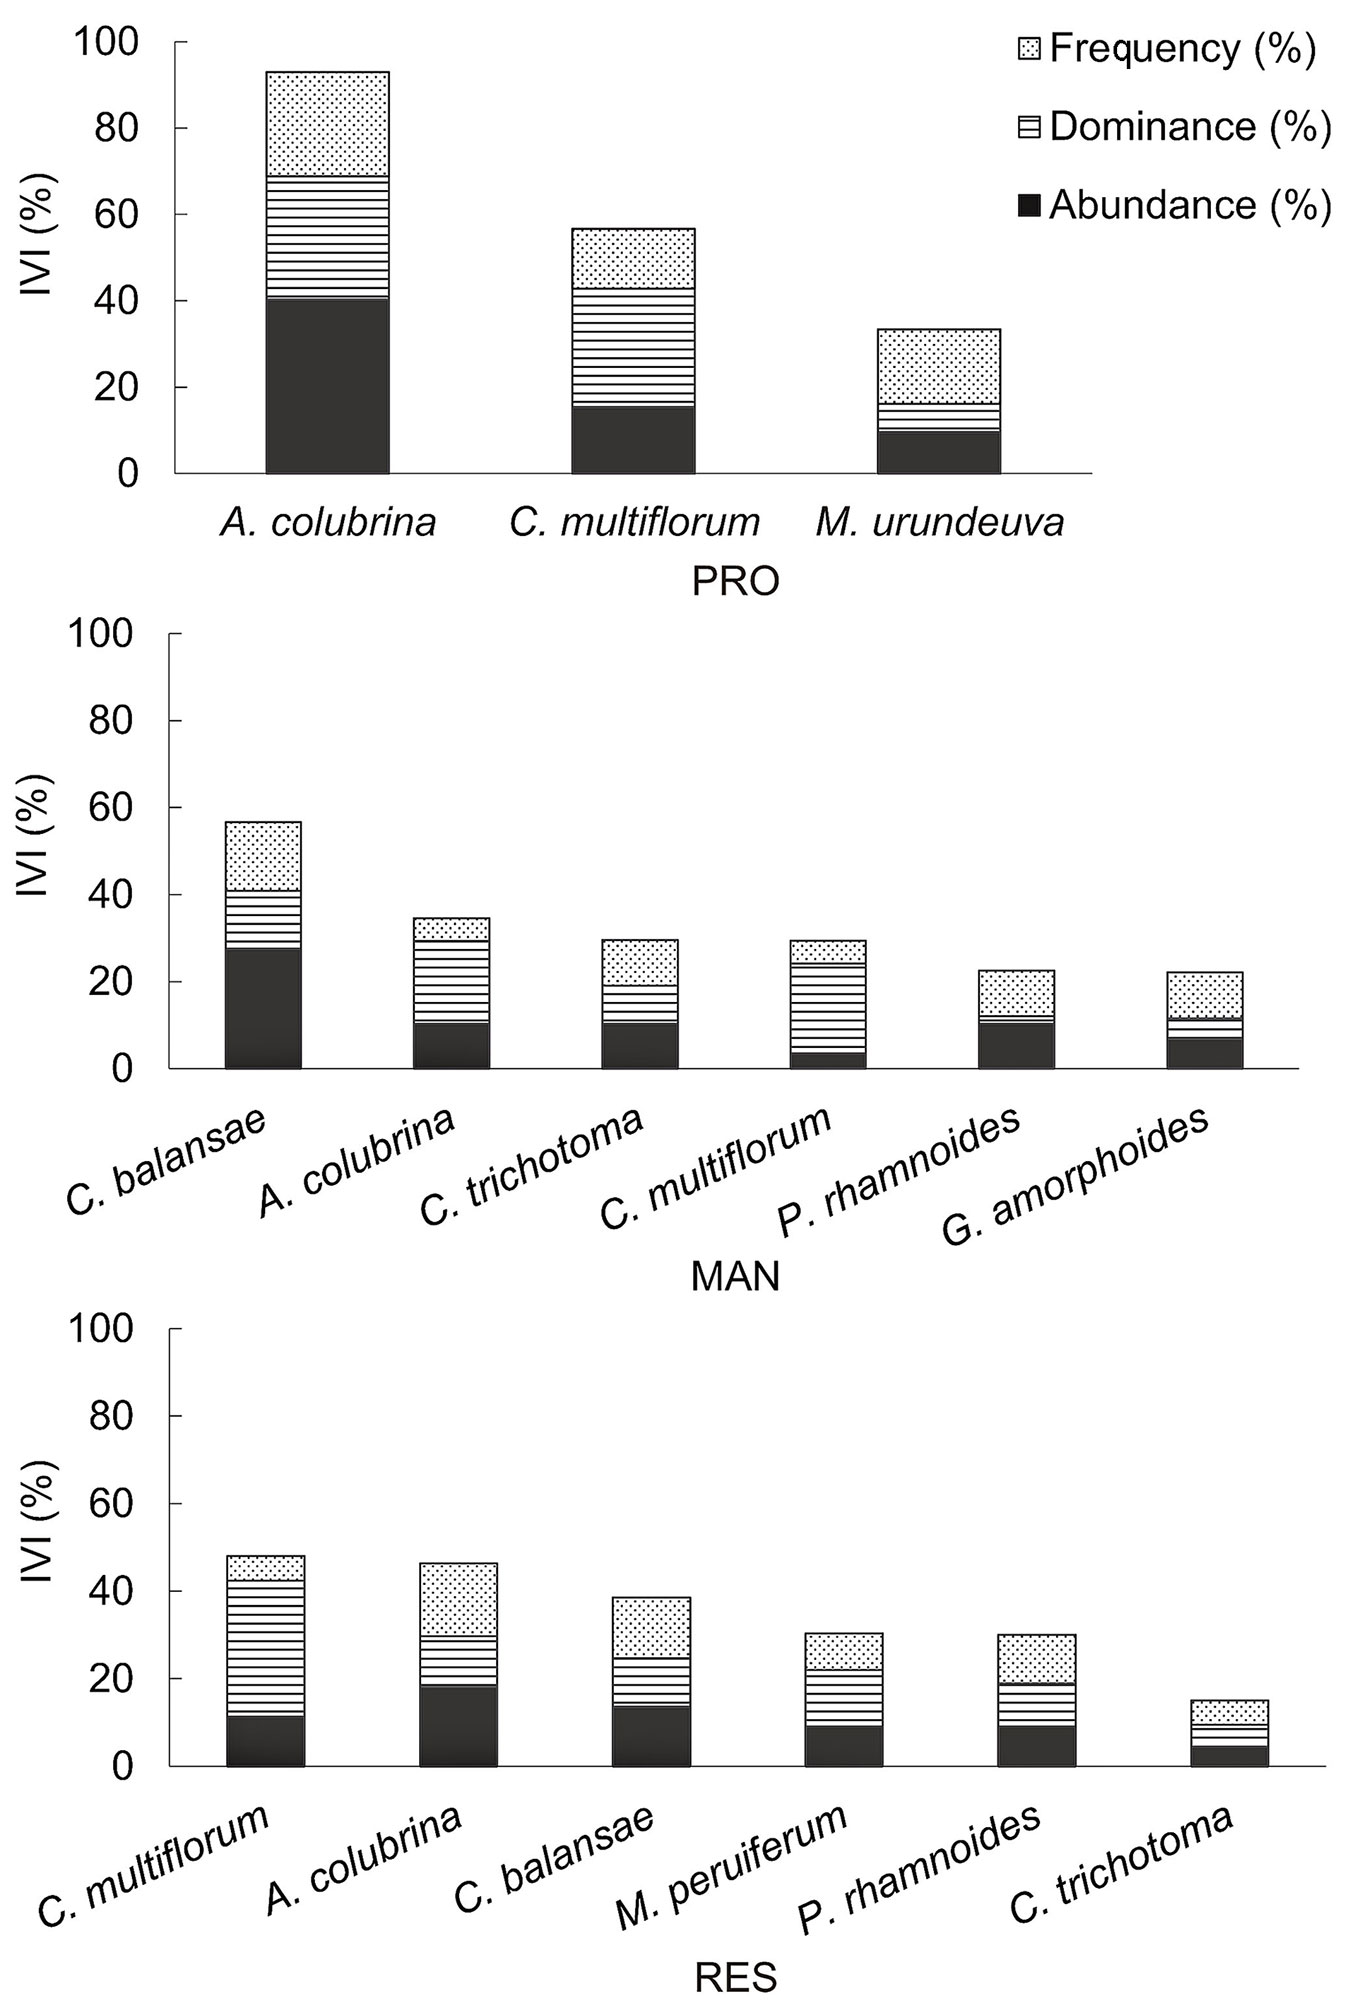
Regarding the IVI (Fig. 4, Tab. S1 in Supplementary material), the adult species with the highest value in the PRO forest was A. colubrina, followed by C. multiflorum and M. urundeuva; the first two species were also shared with the other sampling sites. The PRO forest showed a less equitable community compared to the other forests, given the greater importance of A. colubrina in the ecosystem. Tab. S1 (Supplementary material) shows the composition of each variable used to construct the IVI by species.
Fig. 4 - Index of Importance Value (IVI) by site and species. Only species that accounted for 70% of the total IVI value at each study site are shown. (PRO): protected forest; (MAN): forest under management; (RES): forest under restoration.
Tab. S2 shows the light requirements and some ecological reproductive characteristics of the species with the highest IVI, which also had the highest carbon accumulation. Of these species, we observed adult and regenerating specimens of A. colubrina in both open- and closed-canopy forests. We observed saplings of C. balansae and M. urundeuva under more open canopies, while adult specimens of the latter species were recorded only in denser forests. Both saplings and adult specimens of C. trichotoma were observed in areas with less dense and intermediate canopies, but not in closed, protected forests. No saplings of P. rhamnoides or C. multiflorum were observed.
Carbon-biodiversity relationship
Spearman’s rank correlation analysis showed no significant relationship between C stock and species richness (ρ= 0.30, p = 0.16). No relationship was detected between species richness and CAGBa (ρ = 0.36, p = 0.09), CAGBs (ρ = -0.23, p = 0.29), CLIB (ρ = -0.03, p = 0.9), or SOC (ρ = 0.20, p = 0.35). These results indicate a clear decoupling between taxonomic richness and carbon storage capacity in the studied management systems.
Discussion
Carbon stock
The three studied management systems exhibited different C stocks. PRO forest presented the highest total C stock, with the largest percentage stored in AGB. Conversely, MAN had the lowest total values, with similar contributions from AGB and SOC, and RES showed a lower total C stock but a high relative share in SOC, comparable to PRO forest, due to lower biomass. These findings indicate that protected and exploited forests differ significantly in their C storage capacity because protected forests generally store higher amounts of carbon, according to several studies ([48], [20], [5], [28]). While forest restoration (spontaneous and through plantation) maintains high SOC values, it does not fully recover woody AGB, at least not within the last two decades without logging ([48]). These results are consistent with Gilroy et al. ([21]), who reported that forest fragments within pastoral landscapes store less carbon than continuous primary or older secondary forests.
The CAGBa for the PRO forest in this study was 68% higher than the highest value reported by Castillo-Figueroa et al. ([8]) for mature tropical montane forests in Colombia. In contrast, the values for MAN and RES fell within the range reported by these authors and were similar to the average, although they stored considerably more carbon than the lowest value reported in that study (these authors considered trees with DBH > 5 cm). On an international scale, the reported AGB is 54.47 tC ha-1 ([26]), which is 70% lower than the value found for the PRO forest, demonstrating the great potential of these protected montane ecosystems for aboveground carbon storage. Compared with regional studies, the CAGBa observed in PRO forests was almost 90% greater than that recently reported for the ecoregion ([4]). Additionally, the AGB and SOC values were 164% and 45% higher, respectively, than those reported by Manrique et al. ([29]) for forests affected by logging and extensive livestock farming. In contrast, compared with the same reference, AGB and SOC in the MAN case were 27% and 17% lower, respectively, reflecting intensive use of aboveground biomass and low soil carbon content. These values may reflect soil characteristics: high bulk density, low moisture, and lower organic matter content, all of which contribute to reduced soil carbon storage and possibly lower aboveground biomass. Other carbon reservoirs, such as CLIB and coarse woody debris, had the lowest percentage values, averaging about 2% and 4-5%, respectively, consistent with findings by Manrique et al. ([29]).
Beyond mere storage, the dynamics of carbon release through litter decomposition is fundamental for understanding the high carbon density of these ecosystems. In montane Andean forests, litter decomposition can release up to ten times more carbon into the atmosphere than anthropogenic fossil fuel emissions, yet this process is significantly slower in high-altitude environments. Our findings on the high carbon stocks at the PRO site support the hypothesis that slower decomposition rates are a primary mechanism for carbon accumulation in these forests. This stability is driven by the interplay between microclimatic conditions and litter quality. While evidence at finer spatial scales suggests that species identity and initial litter quality outweigh the influence of the forest microenvironment ([9], [10]), regional assessments in the SAY underscore that stand density and elevation are critical drivers of carbon retention ([31]). Specifically, higher stand density - a key feature of the PRO site - regulates the soil microclimate by maintaining cooler and moister conditions, which effectively slows microbial activity and organic matter turnover ([31]). Furthermore, this process is primarily mediated by soil microorganisms rather than fauna, and is heavily influenced by substrate quality ([41]). For instance, high nitrogen resorption in senescent leaves reduces substrate quality, which acts as a biotic brake that slows microbial breakdown and increases the proportion of carbon retained in the forest floor ([10]). Consequently, the effectiveness of forest protection as a Nature-based Solution (NbS) lies not only in continuous biomass production but also in its capacity to maintain a mature forest structure and a functional community that ensures long-term carbon stabilization through slow organic matter turnover.
It is important to highlight the limitations associated with estimating biomass in subtropical dry and humid forests, such as those of northwestern Argentina. The allometric equations used are generally derived from pantropical forest datasets, with only a few subtropical forest sites included in studies by Alvarez et al. ([1]) and Chave et al. ([14]). This emphasizes the need to develop region-specific models applicable to these ecosystems. The allometric equations used in this study have been reported in other studies of similar subtropical forests ([3]).
Biodiversity
The diversity estimates suggest that RES and MAN support more diverse communities with a higher effective number of species, whereas the PRO assemblage appears to be more strongly dominated by a few species, especially A. colubrina. This pattern is also evident in the IVI results, which indicate a more even distribution of abundances in RES and MAN. However, the asymptotic estimates suggest that additional sampling effort may be required in MAN and RES to fully capture their diversity.
Despite this, PRO forests exhibited the highest proportion of late-successional species ([6]), though their overall species richness was lower. This finding aligns with studies showing that mature forests with higher carbon stocks do not necessarily support greater species richness or biodiversity ([20]). Therefore, the present study highlights the need to consider also species composition when designing conservation and mitigation strategies. Furthermore, the PRO forest showed higher DBH values for both adult and regenerating trees, indicating an older, more established stand, with a greater proportion of individuals exceeding 30 cm DBH and a lower density of saplings. The forest structure observed at the PRO site is consistent with that reported for well-preserved forests in other regional studies ([36]). These results align with Girardin et al. ([22]) and UNEP-IUCN ([45]), who emphasize that maintaining and protecting native forests provide the greatest benefits for carbon storage.
The mismatch between richness and carbon: a multidimensional analysis
Our results revealed no significant relationship between species richness and carbon stocks across any of the studied pools (ρ= 0.30, p = 0.16). This lack of correlation suggests that higher taxonomic diversity does not inherently translate into greater carbon storage in subtropical montane forests, aligning with observations in other subtropical systems ([5]). However, a multidimensional perspective suggests that this apparent mismatch reflects a fundamental trade-off between taxonomic richness and the representativeness of climax communities, likely shaped by disturbance regimes and local forest context. In particular, Blundo et al. ([4]) identified a positive association between AGB and biodiversity at a broad spatial scale; however, this relationship becomes less apparent at finer, local scales, where site-specific disturbance history and management context exert a stronger influence on both forest structure and community composition, as observed in the present study. Ferreira et al. ([20]) reported similar results, finding that forests subject to different disturbance regimes exhibit varying patterns in the carbon-biodiversity relationship.
While the MAN and RES sites exhibited higher total species richness and diversity (Hill numbers), these communities were largely dominated by pioneer and heliophytic species. These early-successional species typically have lower wood density and reduced structural stability, limiting their capacity for long-term carbon sequestration compared with late-successional species. In contrast, the PRO site - despite being less species-rich - contained the highest proportion of climax species (86%) and a significantly higher density of large-diameter trees (>30 cm DBH). This suggests that functional identity and structural attributes are stronger predictors of carbon stocks than simple species counts, as reported in Wen et al. ([47]). Indeed, our sensitivity analysis (results not shown) indicated that a 50% increase in DBH led to a 120% increase in AGBa, consistent with Manrique ([30]). This increase was 134% and 198% greater than the gains generated by the same percentage change in basic wood density and height, respectively. While carbon sequestration rates may decline in older forests as DBH stabilizes near the climax state, these larger dimensions remain critical for biodiversity by providing complex habitats. Therefore, the synergy between carbon and biodiversity in these forests is mediated not by species number, but by maintaining mature forest structure and the presence of high-biomass, late-successional species like A. colubrina.
Species with carbon-ecological benefits
Our results showed that forest biodiversity and carbon accumulation patterns differed among the management systems studied. They also allowed us to identify species that contribute substantially to carbon storage while also having high conservation value because of their unique ecological characteristics - a combination we define as the “carbon-ecological benefit” trait. The species identified with these characteristics were C. multiflorum, P. rhamnoides, and A. cearensis. These species have the potential to enhance carbon storage in AGB, the pool representing the largest proportion of total C stocks, while also facilitating the restoration and conservation of native species that are vulnerable due to their reproductive and germinative limitations (P. rhamnoides and A. cearensis), conservation status (A. cearensis), or because they are climax community species for which no regenerating individuals were recorded (P. rhamnoides and C. multiflorum). These are goals of particular interest for addressing contemporary forestry challenges in the region. Similarly, reports on the composition of tree genera as indicators of both diverse and managed carbon-storing forests ([43]) may be relevant to the concept of carbon-ecological benefits presented here.
Management strategies to optimize carbon stocks and biodiversity conservation
Climate change mitigation measures based on NbS must integrate biodiversity considerations to preserve forests with high carbon stocks and conservation value, such as subtropical mountain forests ([20], [7], [22]). This study underscores the need to evaluate each ecosystem according to its unique structure, composition, and ecological characteristics - rather than applying generic models - to achieve the dual objectives of mitigation and conservation ([37], [5]). Our results show that forest protection is the most effective NbS in the region, as it maintains a mature forest structure and a functional community that ensures long-term carbon stabilization through slow organic matter turnover.
Management strategies such as extending harvesting cycles to match species-specific growth rates, retaining residues, and implementing thinning at later stand ages benefit both carbon and biodiversity ([28]). Crucially, adopting Reduced-Impact Logging (RIL) practices, which involve planned timber extraction to minimize damage to the surrounding stand, has been shown to improve forest structure ([24]) and soil carbon stocks ([19]). Furthermore, additional biodiversity-oriented protection measures, including rotation periods tailored to regional conditions, retaining trees with DBH > 20 cm, and establishing buffer zones around protected forests, are vital to maintain SAY’s functional integrity.
Finally, site regeneration dynamics must be considered. As Wheeler et al. ([48]) noted, natural regeneration may not always be sufficient to restore carbon stocks or species diversity. Although the studied forests showed high regeneration densities, actively promoting the recruitment of late-successional species, which reached 86% in our PRO site, is essential for long-term ecosystem resilience. Facilitating the establishment of these economically and ecologically valuable native species in degraded areas will enhance both biodiversity conservation and climate mitigation through a more mature forest structure and a more stable environment for carbon retention.
Conclusions
The present study adds to the limited empirical understanding of Southern Andean Yungas by examining the relationship between carbon storage and biodiversity under different forest management systems within the framework of Nature-based Solutions (NbS). Our results demonstrate that forest protection (PRO) is the most effective system for carbon storage, containing 150% more total carbon than managed sites (MAN) and 73% more than restored sites (RES). This carbon is primarily concentrated in the aboveground biomass of adult trees, which accounts for up to 65% of the total stock in protected areas.
A key finding of this study is the clear decoupling between species richness and carbon stocks (ρ = 0.30; p = 0.16), indicating that higher taxonomic diversity does not inherently translate into greater carbon storage in these mountain ecosystems. While managed and restored forests may harbor more species, these communities are often dominated by early-successional pioneers with lower wood density. Our results suggest that functional identity and structural attributes, such as tree diameter (DBH) and the presence of climax species (86% in the PRO site), appear to be more critical factors for carbon stabilization than simple species counts. This highlights the importance of considering community composition and forest maturity when evaluating carbon sequestration potential.
Furthermore, our study underscores that the efficiency of forest protection as an NbS lies not only in biomass production but also in its capacity to maintain a mature forest structure that regulates the soil microclimate. Higher stand density - a defining feature of the PRO site - creates cooler and moister conditions that could potentially slow microbial activity and organic matter turnover, facilitating long-term carbon stabilization. Litter quality and nitrogen resorption could strongly influence these processes, acting as a biotic brake on decomposition. Consequently, climate change mitigation strategies in the SAY region must prioritize conserving late-successional communities and maintaining complex forest structures to ensure the continued integrity of these vital carbon sinks.
Acknowledgements
This work was funded by the Project Code 229 201801 00032 CONICET, entitled: “Technological Innovations in Energy and Environment in Concordance with the Sustainable Development Goals and the 2030 Agenda”, Forest Bioeconomy line. The authors thank the Municipality of Caimancito (Jujuy, Argentina), Mutual Collaboration Agreement No. PR5142/2021, which provided logistical support for the current studies. We extend special thanks to the local producers, who kindly facilitated access to their farms for data and sample collection, and to the Caimancito community in general. We also thank Ledesma SAAI for its logistical support during the fieldwork.
References
CrossRef | Gscholar
CrossRef | Gscholar
CrossRef | Gscholar
Gscholar
CrossRef | Gscholar
CrossRef | Gscholar
CrossRef | Gscholar
CrossRef | Gscholar
CrossRef | Gscholar
CrossRef | Gscholar
CrossRef | Gscholar
Gscholar
CrossRef | Gscholar
CrossRef | Gscholar
CrossRef | Gscholar
Gscholar
CrossRef | Gscholar
Online | Gscholar
CrossRef | Gscholar
Gscholar
CrossRef | Gscholar

Authors’ Info
Authors’ Affiliation
Carolina del Rosario Subelza 0000-0002-8570-7755
Instituto de Investigaciones en Energía No Convencional - INENCO, UNSa-CONICET, Universidad Nacional de Salta, Av. Bolivia 5150, Salta CP A4400FVY (Argentina)
Universidad de Alcalá, Departamento de Geología, Geografía y Medio Ambiente, Campus Científico Tecnológico, ctra. Madrid-Barcelona km 33.600, 28802, Alcalá de Henares, Madrid (Spain)
Corresponding author
Paper Info
Citation
Mosconi LA, Subelza CR, Manrique SM (2026). Synergies and trade-offs between carbon stocks and climax community representativeness in subtropical montane forests under different management systems. iForest 19: 411-420. - doi: 10.3832/ifor4990-019
Academic Editor
Davide Travaglini
Paper history
Received: Sep 16, 2025
Accepted: Aug 24, 2026
First online: Nov 12, 2026
Publication Date: Dec 31, 2026
Publication Time: 2.67 months
Copyright Information
© SISEF - The Italian Society of Silviculture and Forest Ecology 2026
Open Access
This article is distributed under the terms of the Creative Commons Attribution-Non Commercial 4.0 International (https://creativecommons.org/licenses/by-nc/4.0/), which permits unrestricted use, distribution, and reproduction in any medium, provided you give appropriate credit to the original author(s) and the source, provide a link to the Creative Commons license, and indicate if changes were made.

Web Metrics
Breakdown by View Type
Article Usage
Total Article Views: 19
(from publication date up to now)
Breakdown by View Type
HTML Page Views: 9
Abstract Page Views: 4
PDF Downloads: 6
Citation/Reference Downloads: 0
XML Downloads: 0
Web Metrics
Days since publication: 1
Overall contacts: 19
Avg. contacts per week: 133.00
Article Citations
Article citations are based on data periodically collected from the Clarivate Web of Science web site
(last update: Jul 2026)
(No citations were found up to date. Please come back later)
Publication Metrics
by Dimensions ©
Articles citing this article
List of the papers citing this article based on CrossRef Cited-by.
Related Contents
iForest Similar Articles
Research Articles
Linking biomass production in short rotation coppice with soil protection and nature conservation
vol. 7, pp. 353-362 (online: 19 May 2014)
Research Articles
Biodiversity conservation and wood production in a Natura 2000 Mediterranean forest. A trade-off evaluation focused on the occurrence of microhabitats
vol. 12, pp. 76-84 (online: 24 January 2019)
Research Articles
Strong relationships between soil and vegetation in reference ecosystems of a riparian Atlantic rainforest in the upper Doce River watershed, southeastern Brazil
vol. 16, pp. 226-233 (online: 17 August 2023)
Research Articles
Vascular plants diversity in short rotation coppices: a reliable source of ecosystem services or farmland dead loss?
vol. 13, pp. 345-350 (online: 17 August 2020)
Research Articles
A Decision Support System for trade-off analysis and dynamic evaluation of forest ecosystem services
vol. 11, pp. 171-180 (online: 19 February 2018)
Research Articles
Consistency among forest structure and biodiversity potential index (IBP): an assessment of stand structural complexity for floodplain poplar woodlands
vol. 18, pp. 335-343 (online: 04 November 2025)
Research Articles
Public perceptions of forests in Italy: ecosystem services, emotional meanings, and post-pandemic needs
vol. 19, pp. 130-140 (online: 11 April 2026)
Research Articles
Green oriented urban development for urban ecosystem services provision in a medium sized city in southern Italy
vol. 7, pp. 385-395 (online: 19 May 2014)
Review Papers
The forest biodiversity artery: towards forest management for saproxylic conservation
vol. 9, pp. 205-216 (online: 26 October 2015)
Review Papers
Towards better practices of salvage logging for reducing the ecosystem impacts in Mediterranean burned forests
vol. 13, pp. 360-368 (online: 25 August 2020)
iForest Database Search
Search By Author
Search By Keyword
Google Scholar Search
Citing Articles
Search By Author
Search By Keywords
PubMed Search
Search By Author
Search By Keyword