Consistency among forest structure and biodiversity potential index (IBP): an assessment of stand structural complexity for floodplain poplar woodlands
iForest - Biogeosciences and Forestry, Volume 18, Issue 6, Pages 335-343 (2025)
doi: https://doi.org/10.3832/ifor4945-018
Published: Nov 04, 2025 - Copyright © 2025 SISEF
Research Articles
Abstract
Forest structural complexity arises from several attributes whose combined effects make it difficult to disentangle their single contributions. Such contributions may vary substantially across different ecosystems and management types, requiring the development of fast and effective forest structural evaluation indices for simplified, highly managed systems, such as poplar plantations in riparian areas. With this aim, the suitability of the Index of Biodiversity Potential (IBP) to catch the stand structural variations was tested in three different types of poplar forests (cultivated, semi-natural and natural) along the Po river (Northen Italy) in contrast with quantitative structural parameters (e.g., deadwood biomass, diameter diversity) and synthetic structural complexity indices (Index of Structural Heterogeneity - SHI, Forest Structure Index - FSI). The IBP consistently assessed stand structure complexity using structural parameters and synthetic indices. The Gini coefficient for diameter was generally low among sites, but the IBP identified slight variations in vertical structure enabling differentiation between cultivated and non-cultivated stands. The SHI showed the strongest correlation with IBP, likely due to its context-related features and its ability to describe structural differences within a relatively homogeneous forest stand. Although data on the presence of large woody elements in IBP allow distinctions among stand types, the lack of their quantification may lead to an overestimation of their actual role in forest biogeochemical cycles. In conclusion, the IBP, with some site-specific refinements, could represent a suitable and rapid method for implementing management plans to enhance woodland stand complexity in riparian areas.
Keywords
Poplar Plantations, Stand Structure, Structural Indices, Biodiversity, Po River, Nature-based Solutions, Correlations
Introduction
Expanding the area covered by forest plantations is one of the main aims of the EU Forest Strategy for 2030 ([16]) in line with the European Green Deal. The implementation of such aims on degraded or agricultural lands, as well as on sites perturbed by extreme events, is particularly fostered for the benefits that woodlands can provide in terms of ecosystem services, including wood and biomass production, CO2 sequestration, and restoration of biodiversity values ([16]). Recent studies using native Populus nigra clones for riparian reforestation, such as the “POBIA” mixture, have demonstrated significant improvements in survival rates and CO2 sequestration ([10]). However, the role of forest plantations has scarcely been tested in Mediterranean landscapes encompassing riparian forests, poplar plantations, and crops ([29]). Despite the relationship between biodiversity and stand structure having long been studied ([12]), the links with multi-taxon diversity (i.e., the diversity and interactions of multiple organism groups, such as plants, animals, fungi, and microorganisms) still require further investigation ([9]).
Stand structure refers to the patterns and relationships of biophysical elements in the forest three-dimensional system. It is the driver and result of ecosystem processes and biological diversity ([18]), but our ability to capture its ecological meaning is often site-dependent ([44], [7]). Thus, indices that incorporate multiple structural variables could enable a broader application across multiple geographical contexts.
Tree plantations for productive purposes generally show low genetic variability, homogeneous structure (e.g., tree size or crown architecture), and a relatively open canopy, which may increase light availability in the understory ([34]). In contrast, natural or semi-natural woodlands (the latter being forests predominantly under natural dynamics though subjected to varying degrees of past or current human influence) are characterized by a large stand-level structural variability and associated forest-dwelling species ([21], [15]). An extensive set of methods for assessing structural diversity has been proposed in scientific literature ([31]). Stand structure can be described using common stand structural parameters and stand structural indices. Structural parameters can refer to the type and amount of deadwood ([36]), tree-related microhabitats ([13]), canopy openness ([4]), vertical structure ([32]), and habitat heterogeneity in general ([25], [22]). Structural indices can be broadly classified into two main categories: spatially explicit and implicit. Spatially explicit indices (e.g., Mingling index) require the relative position of trees in the studied population ([2]), while the spatially explicit indices (e.g., Gini coefficient for diameter) do not require the position of trees for their computation. These latter are the most widely used, as they are less time-consuming and can be applied to standard forest inventory data.
Structural complexity represents the degree to which a forest stand departs from a simple, uniform structure. It increases with greater irregularity, diversity, and spatial differentiation in tree size, form, and spatial arrangement ([57], [31]). Structural complexity arises from the occurrence of many different attributes, and their complex interactions make stand structure quantification a challenging task ([54]). Furthermore, the relative contribution of each structural attribute to forest complexity may vary consistently across ecosystems and management types. Indeed, different subsets of attributes have been used by various authors for calculating stand structural complexity, and all the proposed indices are context-dependent to some extent. Synthetic structural indices have been developed, such as the Structural Heterogeneity Index (SHI, [43]) and the Forest Structure Index (FSI, [46]); however, they remain poorly tested under specific environmental conditions and forest types ([47]).
The Index of Biodiversity Potential (IBP, [24]) was developed to assess biodiversity-related features, and its use has been rapidly growing for its ease and effectiveness in scientific and professional applications. The IBP is primarily applied in Central European forest ecosystems ([56]), particularly in mixed or coniferous managed stands. To the best of our knowledge, no studies have applied this index to riparian or poplar-dominated floodplains. The IBP captures the most essential stand structures and context-related factors that potentially influence biodiversity. Although the IBP can provide a rough estimate of potential biodiversity or can evaluate important habitat characteristics, it should not be over-interpreted. A given score of the IBP does not mean that the number of species of a given taxonomic group yields a particular value. Indeed, the estimated relationship between forest structural attributes and biodiversity - regardless of whether that structure results from natural succession or intensive plantation - must be considered ([55]). The IBP is based on discrete scores derived from the visual assessment of ten factors, such as the vertical layers (B), large living trees (E), number of Tree-related Microhabitats (F), and shared gaps providing flower resources (G), that are directly linked with quantitative stand structural features (e.g., Gini coefficient for diameter, total deadwood volume).
In this work, we test the IBP index as a tool for detecting structural variation in riparian poplar stands, focusing on the consistency between its qualitative scores and quantitative structural parameters and indices. Our aims were: (i) compare the values of different forest stand attributes and indices; (ii) assess their relationships; and (iii) evaluate the strengths and weaknesses of each approach in describing the complexity of poplar plantations.
Methods
Study area and sampling design
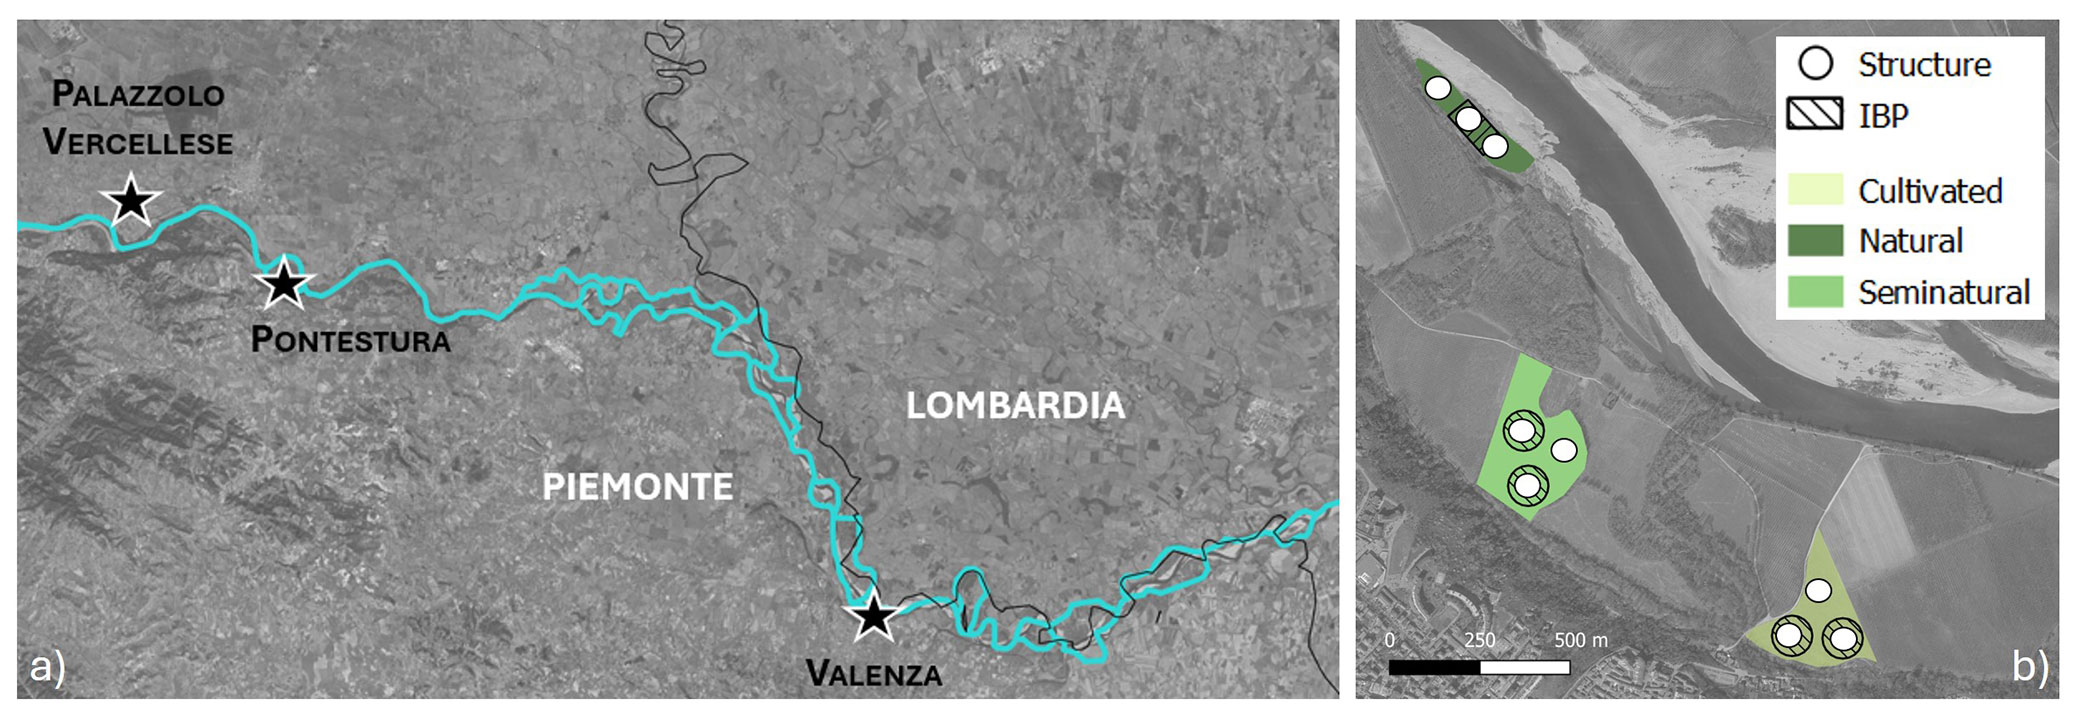
We selected three sites (Palazzolo Vercellese, Pontestura, Valenza) along the Po River in the Piedmont region, Northern Italy (Fig. 1a) included in the restoration actions areas (PNRR M2C4 investment 3.3) of the Parco Naturale del Po Piemontese. The landscape is highly simplified, characterized by high-intensity rural cropping and varying degrees of urban sprawl ([37]). The restoration actions include new forest plantations to improve biodiversity and ecosystem services. For each site, three types of poplar woodlands were sampled (Fig. 1b, Tab. 1): a natural stand (i.e., derived from spontaneous recovery of vegetation), a semi-natural stand (i.e., planted for biodiversity restoration purposes and under spontaneous evolution for years), and an intensively managed one as a control stand (i.e., the most simplified stand structure of cultivated poplars). Within each stand, data were collected in three replicated 314 m2 circular plots (minimum distance among plots of 20 m), for a total of 27 plots. Plots were randomly selected within each stand in a homogeneous area, aiming to include the largest variability in stand structure, harrowing, and species composition. For IBP calculation, one or two 1-ha reference plots were selected based on the overall stand area. Their shape (circular, quadrangular, or rectangular) varied according to the stand features and the related core area extension. At least one of the three structural plots falls within the IBP plot.
Fig. 1 - The three site locations (a) along the border of Lombardia and Piemonte regions, and (b) sampling design for each site.
Tab. 1 - Management and age (years) of the stand type in each site.
| Characteristic | Cultivated | Semi-natural | Natural | |
|---|---|---|---|---|
| Management | Harrowing activities and pruning interventions (every year) |
Minimal treatments (irrigation and weed control) in the first years after plantation |
None | |
| Age | Pontestura | 8 | 15 | 35 |
| Palazzolo Vercellese | 8 | 19 | 18 | |
| Valenza | 6 | 20 | 30 | |
Field data collection
Data on stand structure and IBP were collected between the end of May and mid-June 2024. Data on living biomass and deadwood were collected within each plot, adapting the field protocol of Burrascano et al. ([8]). Tree species, diameter at breast height (DBH ≥ 5 cm), and height of standing elements (snags, living trees, and dead trees) were recorded using a tree caliper and an electronic hypsometer (Vertex IV-360 and Transponder T3). Stumps were not recorded as they were absent in the sites. The number and volume of logs (larger diameter ≥ 10 cm) were assessed by the Line Intersect Method ([50], [28]). Deadwood decay classes were evaluated by 5-point classification according to Aakala et al. ([1]) and Waddell ([52]), respectively, for standing and lying deadwood. The IBP factors were recorded visually in the field using the field data sheet (specific to the continental region; see [19]), without requiring additional equipment or special taxonomic expertise. We considered six stand-related factors (number of native species; vertical structure as the number of tree layers; large size standing dead wood; large size lying dead wood; large size living trees; dendro-micro-habitat type and abundance) and four landscape context-related factors (open spaces presence; forest historical cover; water and rocky habitat presence). Together they sum up to a maximal score of 15 points (for more details, see [24]). In practice, to save time, the observer stops considering a factor once a score of 5 is obtained. The total IBP score is the sum of the six stand-related and four landscape context-related factors, and therefore ranges from 0 to 50. It is assumed that the higher the score, the higher the stand’s capacity to host forest-dwelling species. The partial IBP score is the sum of the six stand-related factors only.
Data analysis
Main stand structural parameters (mean diameter, tree density ha-1, basal area ha-1, volume ha-1) were calculated for living trees; deadwood volume was split into its standing (snag, dead trees) and lying component (logs). The volume of living trees was calculated using the functions proposed by Tabacchi et al. ([48]). The volume of snags was estimated using the formula for an ellipsoid cone ([6]); the volume of logs was calculated using Van Wagner’s equation ([50]). The diameter (DBH) variability of living trees was calculated through the Gini coefficient ([26]). The Gini coefficient quantifies the deviation from perfect equality. It has a minimum value of zero, when all trees are of equal size, and a theoretical maximum of one in an infinite population in which all trees except one have a value of zero. The diversity of living tree species was calculated using the most common indices based on species proportional abundances (Shannon, Simpson, and Pielou - see [27]). Diversity indices were calculated in R ([41]) using the “forestmangr” package ([5]), while the Gini coefficient for diameter was calculated using the “reldis” package ([20]). The volumes of living and dead trees were computed using the “ForIT” package ([40]), which implements all volume equations used in the last Italian National Forest Inventory ([48]).
Only a few synthetic stand structural indices have been proposed and scientifically tested to date ([23]), with the Structural Heterogeneity Index (SHI - [43]) and the Forest Structure Index (FSI - [46]) representing two of the few well-established examples. In our study, they were applied at the plot level for direct comparison with the aforementioned structural parameters (see Tab. S1 in Supplementary material for the description of factors considered by both indices). These indices are typically developed and validated within specific forest ecosystems and geographic context (SHI refers to Apennine beech forests of Central Italy, FSI refers to different forest types in the region of Baden-Württemberg, Germany). They reflect specific tree-size distributions, species compositions, and disturbance regimes. When applied to contrasting forest types, such as those differing in species diversity, stand density, or management history, their sensitivity to structural attributes may vary, potentially leading to biased or non-comparable estimates of structural complexity. The SHI was calculated by scaling each variable from 1 to 100, combining the eight variable scores additively, and transforming the result to a percentage. The FSI follows the approach described by McElhinny et al. ([30]) and the criteria of Sabatini et al. ([43]). The eleven variables considered for FSI were scaled to their minimum and maximum values to yield indices ranging from 0 to 1.
Mean differences of structural parameters among stand types (natural, semi-natural, cultivated) and sites (Palazzolo Vercellese, Pontestura, Valenza) were first tested with one and two-way analysis of variance (ANOVA). Non-normal data were log-transformed before performing a two-way ANOVA. Significance of differences between stand types and sites was assessed by Tukey’s post hoc (HSD) tests. Kruskal-Wallis test ([35]) was used for non-normal data. The “ggpubr” ([33]) and “ggstatsplot” ([38]) R packages were used to test and visualize data distribution, and to compare means between groups. Correlation and regression analysis were performed using the “corrplot” package ([53]). Regression analysis was conducted using the least-correlated single structural parameters ([17]).
Results
Stand structure parameters and indices
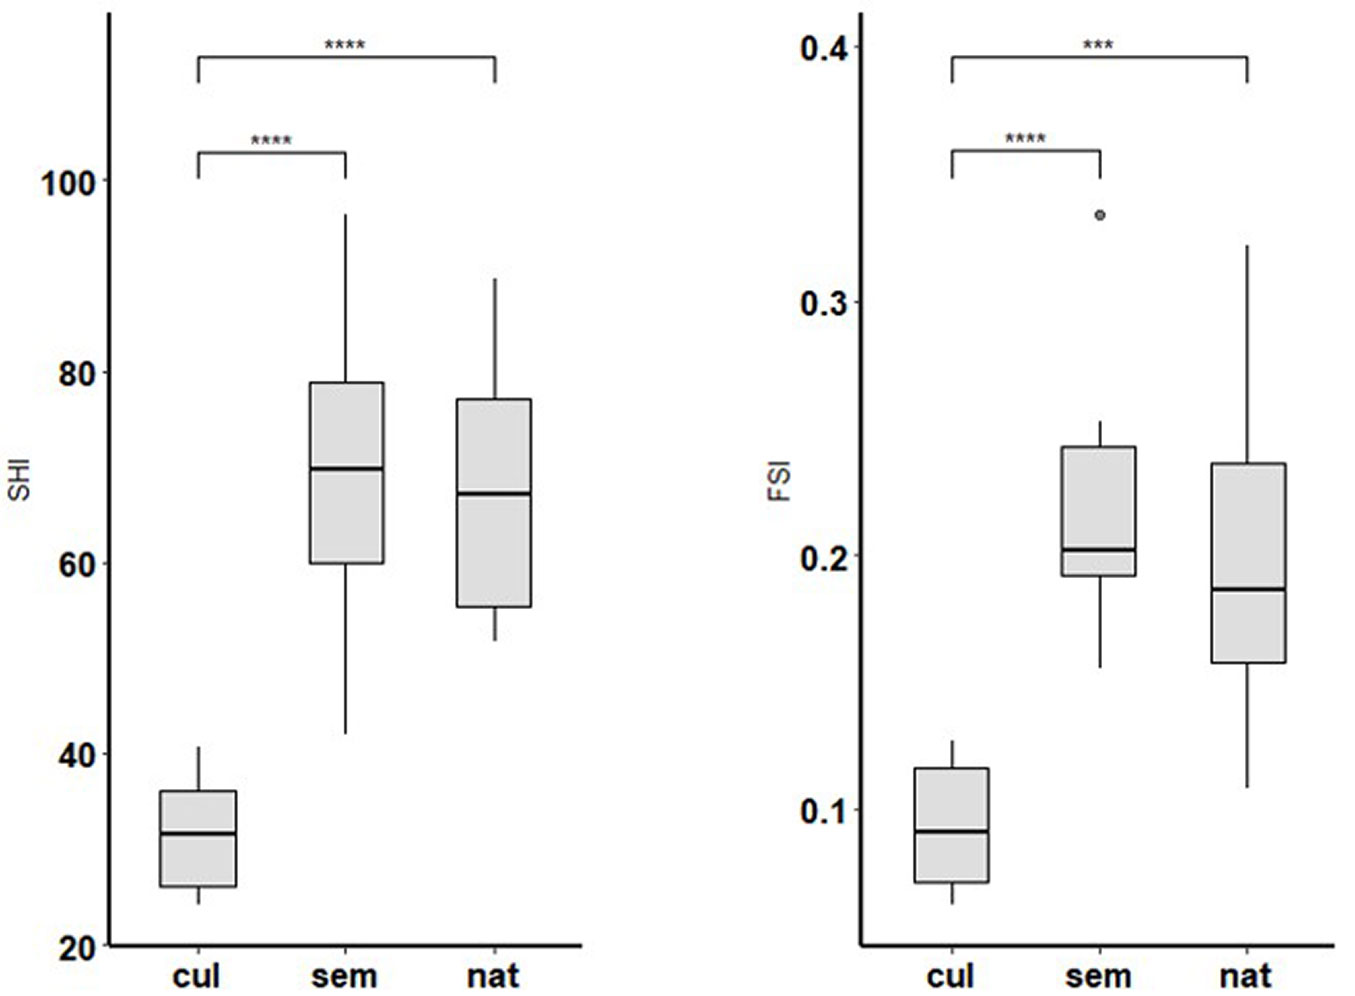
The DBH frequencies showed different distribution patterns depending on the management conditions (Fig. S1 in Supplementary material), with a clear reverse J-shaped distribution in semi-natural stands. Natural and semi-natural stands were dominated in terms of mean basal area by P. nigra, followed by P. alba (Fig. S2). The higher tree diversity observed in semi-natural stands reflects their initial plantation scheme and species composition, purposefully established to promote higher biodiversity. Cultivated stands were dominated by the hybrid poplar Populus ×canadensis. Poplar cultivation in Italy and many other countries is primarily based on the use of the Populus ×canadensis clone “I-214”, which is characterized by high adaptability to different climatic and soil conditions, optimal wood properties for plywood production, and susceptibility to specific biotic threats ([11]). Significant differences among structural parameters of living trees (Tab. 2) were found according to the stand type, with the differences being not significant between semi-natural and cultivated stands (e.g., tree volume), except for the Gini coefficient for diameter. The deadwood volume showed substantial differences among cultivated and the other stand types, with slightly higher values in semi-natural stands. Dead trees and snag volume were significantly higher in semi-natural stands, while lying deadwood was higher in natural ones (Tab. S2 in Supplementary material). SHI and FHI indices showed no significant differences among natural and semi-natural stands (Fig. 2, Tab. S3), with slightly higher means for semi-natural ones. Interestingly, for both indices, a large range of scores was observed, with minimum values of 24.17 (SHI) and 0.06 (FSI) for cultivated stands, and maximum values of 96.30 (SHI) and 0.33 (FSI) for semi-natural stands (Tab. S3). As expected, both indices showed significantly higher values for natural and semi-natural stands than for cultivated stands.
Tab. 2 - Mean (± standard deviation) of the primary response variables on stand structure in cultivated, semi-natural, and natural stands. Parameters are shown with significance levels - (***): p<0.001, (*): p<0.05; (ns): p ≥ 0.05. Lowercase letters highlight significant differences (p < 0.05) among stand types according to Tukey’s post hoc test.
| Stand characteristics | Cultivated | Semi-natural | Natural | p-value |
|---|---|---|---|---|
| Tree density (n ha-1) | 301 ± 43 | 442 ± 119 | 386 ± 216 | ns |
| Quadratic mean diameter (cm) | 28.12 ± 3.40b | 26.76 ± 8.57b | 43.74 ± 15.75a | *** |
| Gini coefficient for diameter (DBH) | 0.07 ± 0.05b | 0.24 ± 0.09a | 0.23 ± 0.08a | *** |
| Basal area (m2 ha-1) | 19.1 ± 6.3b | 24.9 ± 12.9b | 48.0 ± 18.2a | *** |
| Tree volume (m3 ha-1) | 83.2 ± 43.7b | 108.9 ± 78.7b | 250.4 ± 115.1a | *** |
| Dead wood volume (m3 ha-1) | 4.1 ± 6.9b | 88.1 ± 56.6a | 75.9 ± 93.1a | *** |
| Shannon Index | 0 b | 0.90 ± 0.53a | 0.43 ± 0.35a | *** |
| Jentsch Index | 0.11 ± 0.01ab | 0.27 ± 0.13c | 0.24 ± 0.19bc | * |
Fig. 2 - Statistical differences (Tukey HSD test) of (a) SHI (F[2, 24] = 24.44, p < 0.001) and (b) FSI (F[2, 24] = 15.35, p < 0.001) index mean values among stand types. (cul): cultivated; (sem): semi-natural; (nat): natural); (***): p<0.001; (****): p<0.0001.
The IBP
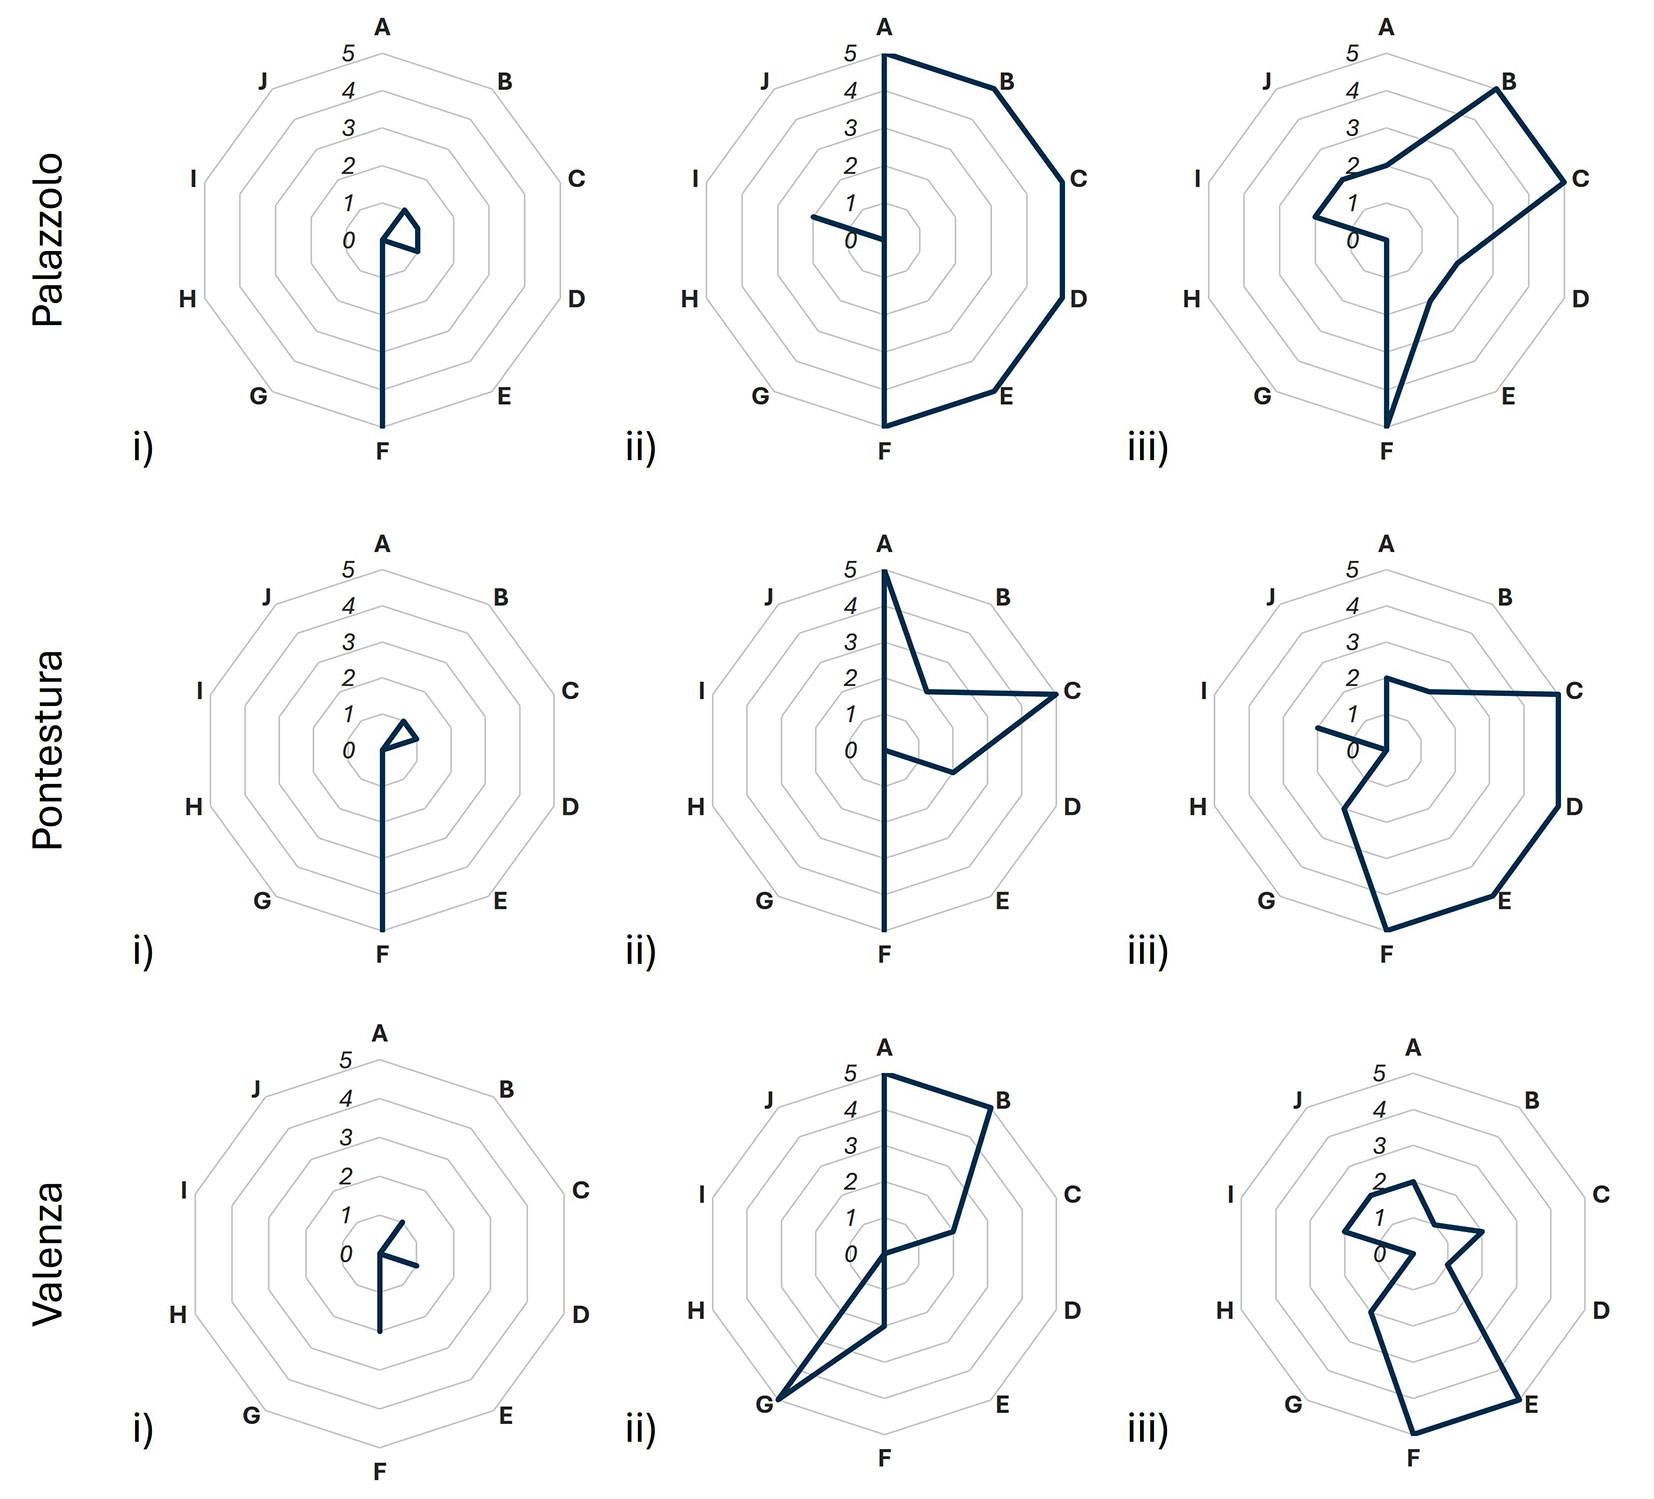
Fig. 3presents the IBP values and the factors that most strongly influenced the IBP scores. The IBP values showed a similar trend across stand types, with noticeable differences only between the cultivated and non-cultivated stands (i.e., semi-natural and natural). Natural and semi-natural stands reported an IBP score between 19 and 32, while the cultivated ones had IBP ≤ 8 (Tab. S4). Specific IBP features varied widely among stand types; natural stands reported the highest variability in score distributions among IBP factors, while cultivated stands reported the lowest. Notably, within-stand variability was observed for cultivated stands, particularly for the dendro-microhabitat factor (F) and lying deadwood presence (D). Landscape-level factors (letters G-J, Fig. 3) did not significantly influence the total IBP score. Depending on the single IBP parameter (Fig. S3a-c), the “native species” parameter was deeply influenced by past human interventions (e.g., tree species planted in semi-natural stands), more than young species that are growing through natural regeneration processes. Instead, the “wood dimension” parameter reflected the presence or absence of natural ecological dynamics within the stand (natural and semi-natural stands vs. cultivated ones). Interestingly, the dendro-microhabitat factor highlighted a highly heterogeneous distribution of dendromicrohabitats among stand types, with cultivated stands supporting unique dendromicrohabitats (e.g., woodpecker cavities and nests).
Fig. 3 - Radar plot indicating IBP values for each site and stand type: (i) cultivated, (ii) semi-natural, (iii) natural. (A): native species; (B): vertical structure; (C): large size standing dead wood; (D): large size lying dead wood; (E): large size living trees; (F): dendro-micro-habitat; (G): open spaces; (H): forest cover; (I): water habitat; (J): rocky habitat.
Correlation analysis
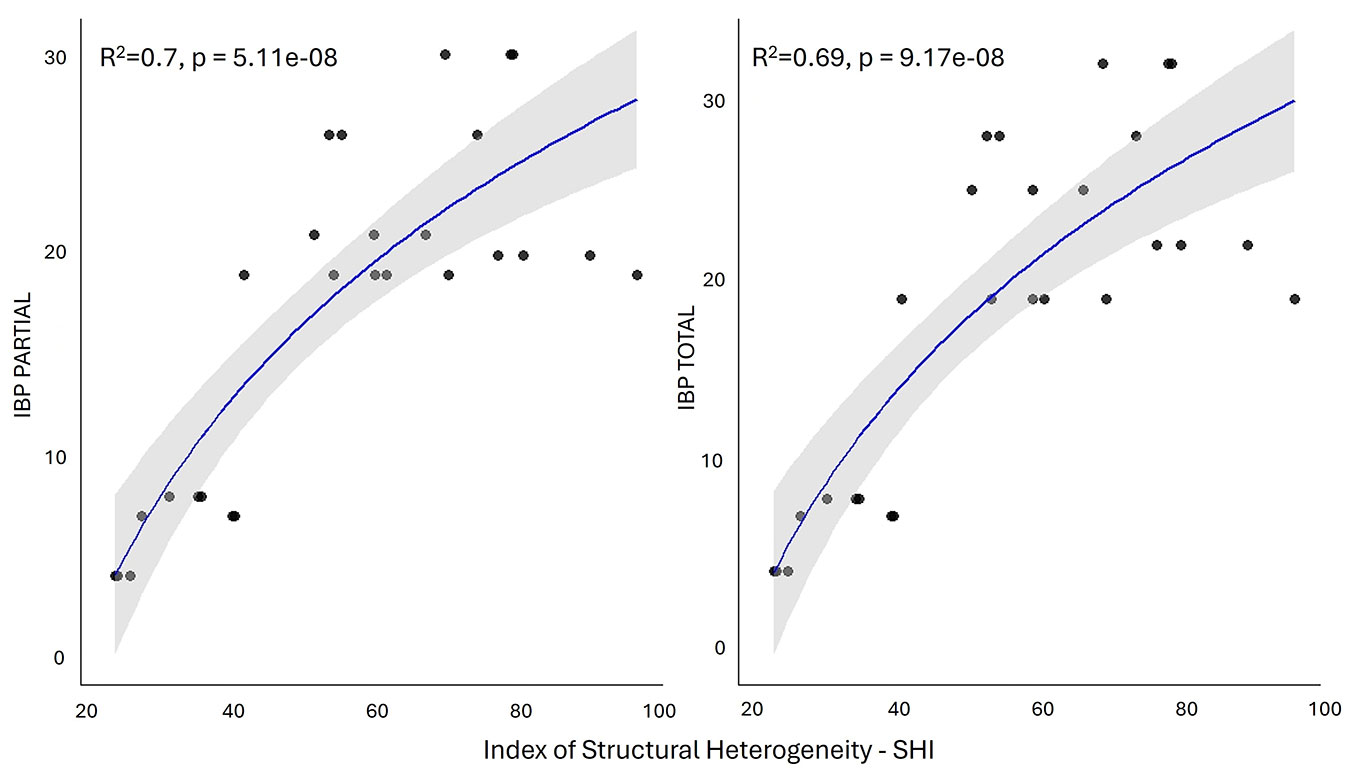
The correlation matrix (Fig. S4 in Supplementary material) shows the strongest correlations (R > 0.6) among single structural parameters (e.g., quadratic mean diameter and living volume) and between the SHI and FSI indices. Linear regression highlights the strongest positive significant correlation of IBP with stand age and Gini coefficient for diameter (Fig. 4). Both total and partial IBPs were strongly correlated (R ≥ 0.7, p < 0.001) with the SHI index. This latter was used for logarithmic regression analysis (Fig. 5) as it showed strong correlations (R > 0.80, p < 0.001) with IBP partial and total scores (Fig. S5). The logarithmic regression provides a better fit to the IBP trend than the linear model, accurately representing the initial rapid increase followed by a plateau at higher SHI values.
Fig. 4 - Correlation plots with linear regression for the IBP partial values (x-axis) with the selected structural parameters (y-axis). Plots representing the three stand types are drawn with different shapes (see legend).
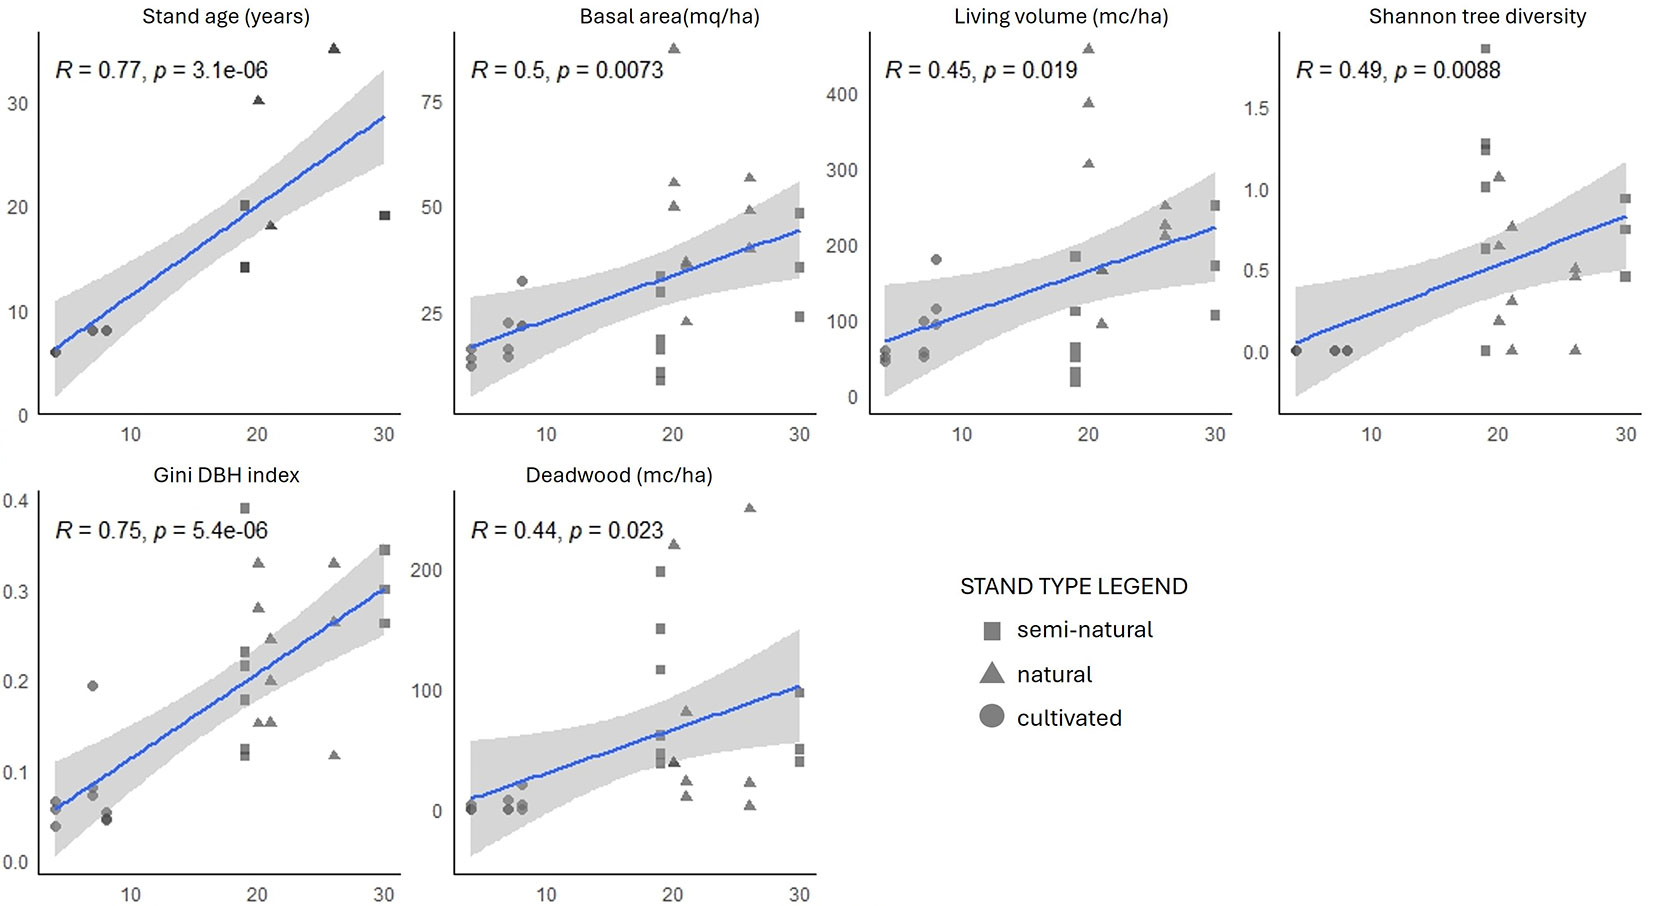
Fig. 5 - Correlation plot with logarithmic regression among SHI (x-axis) index and IBPs (partial and total, y-axis).
Discussion
It is pivotal to deploy rapid, effective methods to monitor current and future non-productive plantations within the framework of climate adaptation actions ([51]). Our study showed the potential of the IBP index for an easy yet effective estimation of stand-structure diversification, which can be used to assess the degree of ecological complexity in riparian poplar stands.
European black poplar (Populus nigra L.) and related willows (Salix spp.) dominate the early successional stages of alluvial floodplain forests after flood events in temperate ecoregions of Western and Central Europe ([14]). Further, plantations have replaced some natural black poplar woodlands with artificial hybrid poplars (e.g., P. ×canadensis Moench), which have limited genetic diversity ([45]). Additionally, P. nigra seedlings are unable to establish below their own canopy, diminishing the structural diversity in stable stands, and leading to overaged floodplain forests and succession towards mature or climax forests ([49]). These riparian ecosystems are oversimplified by natural dynamics (e.g., floodplains) and by anthropogenic activities (e.g., agroforestry operations). The absence of significant divergence in key attributes such as quadratic mean diameter, tree basal area, and volume indicates that the free development of semi-natural stands has not yet translated into substantial structural differentiation. This overall similarity between cultivated and semi-natural poplar stands likely reflects their origin and relatively uniform age structure. However, this should not be interpreted as an ecological equivalence, but rather as a limitation of conventional structural descriptors - mainly driven by tree size and density - in capturing subtle or early-stage heterogeneity resulting from reduced management. Deadwood distribution and the Gini coefficient suggest an initial shift toward greater complexity, though still limited in magnitude. In line with these results, both SHI and FSI clearly distinguished cultivated from semi-natural and natural stands but showed a weak distinction between the latter two.
In this context, IBP shows good suitability for evaluating stand structural complexity, consistent with the main structural parameters and synthetic indices. Surprisingly, although it exhibits low variability, the Gini coefficient is recorded by IBP and accounts for differences between stands. Surely, scores for some IBP factors (e.g., the living and dead trees dimension) must be adjusted in the evaluation of intensive and semi-natural plantations, especially to reduce dimensional thresholds, as their structural similarity greatly influences the index’s sensitivity. In this way, it will be possible to better capture and enhance biodiversity potential in relatively simple landscapes, such as the surveyed floodplain areas in rural landscapes.
Among the synthetic indices considered, IBP shows the best correlation with SHI, likely due to its more context-related features and its ability to evaluate structural differences within a relatively homogeneous forest stand (i.e., central Apennine beech forests - [43]). It quantifies how far a stand is from an ideal reference state (e.g., typically an old-growth or near-natural condition forest stand, such as the natural poplars in our study) by capturing subtle within-stand variations in tree size distribution, spatial arrangement, and layering. Consequently, SHI performs particularly well in contexts where forest stands share similar compositional and developmental characteristics, as it is sensitive to local gradients in structural complexity. The broad span of SHI scores (from under 40 in cultivated stands to more than 90 in natural and semi-natural stands, within a potential range of 1 to 100) reflects its ability to discriminate structural differences at fine scales. However, this sensitivity also poses a limitation when applied to intensively managed and structurally simplified systems, such as poplar plantations, where structural variability is inherently low and primarily driven by management rather than natural dynamics. In such even-aged, monocultural contexts, SHI values may cluster within a narrow range, limiting their capacity to detect meaningful differences among managed stands. By contrast, the FSI was designed to capture structural diversity across a wide range of forest types, though for a limited geographical context, by integrating multiple metrics of tree size variability and spatial heterogeneity into a standardized framework. As such, it seems more effective for comparative analyses across broad datasets encompassing distinct forest types and management intensities. In the present study, FSI values remained generally low (only two plots reached 0.33, out of a maximum possible score of 1, with most plots below 0.26), reflecting both the intrinsic homogeneity of poplar stands and the relatively narrow range of variation in key structural parameters (e.g., deadwood volume, basal area, Gini coefficient for diameter). Among stand-scale IBP factors, native tree taxonomic groups and the large-size wood element factors showed good suitability for describing forest structure, even in very simplified forest landscapes, such as poplar plantations, capturing a representative range of diversity and tree dimensions and thus enabling distinction between sites and stand complexity.
On the other hand, the absence of biomass quantification leads to an overestimation of the role of some elements (e.g., deadwood) in forest biogeochemical cycles, compared with ecological dynamics in more natural stands. Therefore, comparing IBP scores with quantitative structural parameters or synthetic indices is particularly important. Moreover, the index does not consider some pivotal parameters to assess the potential biodiversity (e.g., deadwood decay stages) of a site; in this sense, IBP could be refined with a few new context-dependent parameters and combined with specific synthetic indicators used in FSI computation (e.g., compositional heterogeneity of regeneration, downed deadwood decay stage, bark diversity). Dendromicrohabitat factors indicate that cultivated systems can support, even at low abundances, a broad range of potential tree-related habitats for wild fauna (e.g., nests), some of which are absent in natural stands (e.g., woodpecker cavities). However, poplar plantations are usually considered marginal habitats for woodpeckers ([39]). On the contrary, IBP context-dependent factors are poorly suited to capture site-scale variation, mainly because of the high homogeneity of these rural river landscapes. Different or smaller-scale parameters (e.g., open-space size and morphological variability) could be added depending on the landscape type.
As forest biodiversity comprises compositional, structural, and functional diversity at different spatial scales ([12]), structural diversity can be seen as a direct link to biodiversity and ecosystem functioning ([3], [42]). In this sense, deepening knowledge of the synthetic indices that can be used as faster, less expensive alternatives to direct data collection could be a valuable option, especially in landscapes subject to rapid changes driven by natural (e.g., flooding events) or anthropogenic (e.g., socio-economic needs) factors. Evidence could guide forest restoration activities in floodplain areas, shaping stand structural complexity and thus influencing its biodiversity potential ([42]). According to our results, the IBP could be applied to identify stands with greater potential for structural and biodiversity enhancement, for instance by prioritizing interventions that increase vertical layering, tree size variability, or the presence of large living and deadwood elements. Its sensitivity should nevertheless be refined with the abovementioned original context-dependent parameters. The comparable IBP and SHI values observed in semi-natural and natural stands indicate that even relatively young (15- to 20-year-old stands) semi-natural plantations can rapidly approach the structural features of reference systems, reinforcing their role as effective nature-based solutions for restoring complexity and ecological resilience in degraded riparian forests.
Conclusion
The relatively homogeneous structural characteristics of riparian forest stands offer an interesting case study for further evaluating the suitability of IBP to assess stand structural complexity, in line with structural parameters and synthetic indices. Overall, the IBP demonstrates strong potential to capture structural variation, even within simplified forest systems such as poplar plantations, and shows consistent alignment with quantitative stand attributes and SHI values. These findings underscore its value as a rapid and cost-effective indicator to support monitoring, restoration, and management strategies aimed at enhancing structural complexity and biodiversity in riparian forests. Future work should expand the number of sampling sites across different stand development stages, reweight parameters to better reflect their relative importance, and recalibrate the index for a more context-specific approach. Moreover, it will be essential to assess the diversity of different taxonomic groups to deepen the relationships between IBP and synthetic structural indices.
Acknowledgements
The authors would like to thank Francesco Chianucci for his suggestions on the statistical analysis, Simone Frare for his assistance with field data collection, and Luca Cristaldi (Aree protette Po Piemontese) for his help in identifying suitable areas for the study. We also thank the following institutions and public environmental authorities for their continuous support: the Management Body of the Protected Areas of Piedmont Po, the Interregional Agency for the Po River (AIPo), and the Po River Basin Authority (ADBPO).
Data availability
Data are available upon request to the authors.
Authors’ contribution
GT: writing - original draft, visualization, methodology, investigation, formal analysis, conceptualization; AC: data collection, review & editing; SO: conceptualization, review & editing; PG: formal analysis, data curation; PMC: writing - review & editing; conceptualization; MLT: data collection; ST: data collection, review & editing; FV: data collection, review & editing; AG: review & editing; investigation, conceptualization, data collection, project administration.
Funding
This research was funded by the National Recovery and Resilience Plan (NRRP), Mission 4 Component 2 Investment 1.4 - Call for tender No. 3138 of 16 December 2021, rectified by Decree n.3175 of 18 December 2021 of Italian Ministry of University and Research funded by the European Union - NextGeneration EU; Project code CN_000 00033, Concession Decree no. 1034 of 17 June 2022 adopted by the Italian Ministry of University and Research, CUPB83C22 002930006, Project title “National Biodiversity Future Center - NBFC”.
References
CrossRef | Gscholar
CrossRef | Gscholar
Gscholar
CrossRef | Gscholar
CrossRef | Gscholar
CrossRef | Gscholar
Gscholar
CrossRef | Gscholar
CrossRef | Gscholar
Gscholar
Gscholar
Gscholar
CrossRef | Gscholar
Gscholar
Online | Gscholar
Authors’ Info
Authors’ Affiliation
Maria Laura Traversi 0009-0006-7170-6918
Alessio Giovannelli 0000-0002-7217-7177
Research Institute on Terrestrial Ecosystems - IRET, National Research Council - CNR, v. Madonna del Piano 10, I-50019 Sesto Fiorentino, FI (Italy)
Simone Orsenigo 0000-0003-0348-9115
Department of Earth and Environmental Sciences, University of Pavia, v. Sant’Epifanio 14, I-27100 Pavia (Italy)
Simone Orsenigo 0000-0003-0348-9115
Silvia Traversari 0000-0003-2814-7218
Francesca Vannucchi 0000-0002-2661-214x
Alessio Giovannelli 0000-0002-7217-7177
NBFC, National Biodiversity Future Center, I-90133 Palermo (Italy)
v. San Bonaventura 13, I-50145, Florence (Italy)
Council for Agricultural Research and Economics, Research Centre for Forestry and Wood - CREA-FL, strada Frassineto 35, I-15033 Casale Monferrato, AL (Italy)
Francesca Vannucchi 0000-0002-2661-214x
Research Institute on Terrestrial Ecosystems - IRET, National Research Council - CNR, v. G. Moruzzi 1, I-56124 Pisa (Italy)
Corresponding author
Paper Info
Citation
Trentanovi G, Corli A, Orsenigo S, Ghirelli P, Chiarabaglio PM, Traversi ML, Traversari S, Vannucchi F, Giovannelli A (2025). Consistency among forest structure and biodiversity potential index (IBP): an assessment of stand structural complexity for floodplain poplar woodlands. iForest 18: 335-343. - doi: 10.3832/ifor4945-018
Academic Editor
Marco Borghetti
Paper history
Received: Jul 21, 2025
Accepted: Oct 27, 2025
First online: Nov 04, 2025
Publication Date: Dec 31, 2025
Publication Time: 0.27 months
Copyright Information
© SISEF - The Italian Society of Silviculture and Forest Ecology 2025
Open Access
This article is distributed under the terms of the Creative Commons Attribution-Non Commercial 4.0 International (https://creativecommons.org/licenses/by-nc/4.0/), which permits unrestricted use, distribution, and reproduction in any medium, provided you give appropriate credit to the original author(s) and the source, provide a link to the Creative Commons license, and indicate if changes were made.

Web Metrics
Breakdown by View Type
Article Usage
Total Article Views: 7771
(from publication date up to now)
Breakdown by View Type
HTML Page Views: 5063
Abstract Page Views: 1480
PDF Downloads: 1084
Citation/Reference Downloads: 4
XML Downloads: 140
Web Metrics
Days since publication: 239
Overall contacts: 7771
Avg. contacts per week: 227.60
Article Citations
Article citations are based on data periodically collected from the Clarivate Web of Science web site
(last update: Mar 2025)
(No citations were found up to date. Please come back later)
Publication Metrics
by Dimensions ©
Articles citing this article
List of the papers citing this article based on CrossRef Cited-by.
Related Contents
iForest Similar Articles
Research Articles
Do different indices of forest structural heterogeneity yield consistent results?
vol. 15, pp. 424-432 (online: 20 October 2022)
Research Articles
Stand structure and deadwood amount influences saproxylic fungal biodiversity in Mediterranean mountain unmanaged forests
vol. 9, pp. 115-124 (online: 08 September 2015)
Research Articles
Bird response to forest structure and composition and implications for sustainable mountain forest management
vol. 19, pp. 18-27 (online: 11 January 2026)
Short Communications
An approach to measuring biodiversity and its use in analysing the effect of nitrogen deposition on woodland butterfly populations in the Netherlands
vol. 2, pp. 46-48 (online: 21 January 2009)
Research Articles
Stand dynamics and natural regeneration in silver fir (Abies alba Mill.) plantations after traditional rotation age
vol. 7, pp. 313-323 (online: 08 April 2014)
Research Articles
Investigating the effect of selective logging on tree biodiversity and structure of the tropical forests of Papua New Guinea
vol. 9, pp. 475-482 (online: 25 January 2016)
Review Papers
The forest biodiversity artery: towards forest management for saproxylic conservation
vol. 9, pp. 205-216 (online: 26 October 2015)
Research Articles
The effects of forest management on biodiversity in the Czech Republic: an overview of biologists’ opinions
vol. 15, pp. 187-196 (online: 19 May 2022)
Book Reviews
National forest inventories: contributions to forest biodiversity assessments (2010)
vol. 4, pp. 250-251 (online: 05 November 2011)
Research Articles
An index of structural complexity for Apennine beech forests
vol. 8, pp. 314-323 (online: 03 September 2014)
iForest Database Search
Google Scholar Search
Citing Articles
Search By Author
- G Trentanovi
- A Corli
- S Orsenigo
- P Ghirelli
- PM Chiarabaglio
- ML Traversi
- S Traversari
- F Vannucchi
- A Giovannelli
Search By Keywords


