
Species-independent estimation of dipterocarp wood density using drilling resistance: implications for carbon accounting
iForest - Biogeosciences and Forestry, Volume 19, Issue 5, Pages 369-375 (2026)
doi: https://doi.org/10.3832/ifor4894-019
Published: Sep 12, 2026 - Copyright © 2026 SISEF
Research Articles
Abstract
Nature-based carbon credit markets are crucial for climate change mitigation in tropical regions. Accurate estimates of aboveground biomass (AGB) in these forests depend on wood density (WD), typically sourced from global databases that do not account for local variability, introducing substantial uncertainties in carbon stock assessments. This study evaluates the resistograph as a novel tool for improving WD predictions in dipterocarp forests of northern Borneo, addressing critical gaps in current carbon stock estimation methodologies. Using multiple linear regression, we developed a two-variable model linking WD to drilling resistance (DR) variables. The optimal model, incorporating the standard deviation of DR (DRStD) and the slope of DR (DRSlope), produced the best predictions (adjusted R² = 0.604, RMSE = 0.083 g cm-3) and showed no significant difference from field WD. Log-transformed models were also tested as a robustness check and yielded lower prediction errors, but the final model was selected for its higher explanatory power and direct interpretability. By comparison, database WD values significantly overestimated field WD and resulted in inflated AGB estimates (RMSE = 32.260%) compared to those derived from the resistograph-based model (RMSE = 25.933%). Our findings demonstrate that the resistograph-based methodology accurately predicts field WD. As a non-destructive and portable tool, it has large potential to enhance the credibility of biomass quantification for nature-based carbon credit projects in Southeast Asia. Further work should expand geographical and species coverage to support broader application across tropical forest landscapes.
Keywords
Resistogram, Dipterocarpaceae, Aboveground Biomass, Voluntary Carbon Markets, Borneo
Introduction
Tropical forests play a critical role in global climate change mitigation strategies. Among these strategies, nature-based carbon credits have gained prominence for their capacity to sequester carbon dioxide through photosynthesis. At the national scale, the Reducing Emissions from Deforestation and Forest Degradation (REDD+) initiative, under the United Nations Intergovernmental Panel on Climate Change (IPCC), remains a key framework for mitigation, with ongoing annual negotiations. More recently, the emergence of voluntary carbon markets (VCM), such as the Bursa Malaysia VCM Exchange, has facilitated the development and trade of carbon credits derived from forest conservation and restoration projects.
Nature-based carbon strategies are particularly vital for conserving Southeast Asia’s tropical forests, which face increasing anthropogenic pressures. Human disturbance and fire risk affect wood density at the local scale ([24]). In Borneo, for instance, even the remaining upland forests in mountainous regions face increasing threats from commercial logging and agricultural expansion ([4], [14], [20]). The island harbors approximately 50% of the world’s dipterocarp species, many of which are endemic ([2]). Dipterocarps are ecologically significant, often dominating Bornean tropical forest composition and contributing substantially to aboveground carbon stocks due to their high wood density (WD) and large biomass. Dipterocarps are ecologically significant and exhibit higher carbon storage capacity compared to non-dipterocarp species.
Many nature-based carbon projects rely heavily on aboveground biomass (AGB) accumulation, of which nearly 47% is carbon. Accurate AGB estimation is therefore essential for verification and monitoring. In practice, AGB estimation is predominantly non-destructive, relying on allometric equations derived from harvested trees - a labor-intensive and costly process. Existing allometric models for tropical forests primarily use diameter at breast height (DBH) as a predictor because it is reliable in field measurements. However, incorporating tree height (H) and wood density (WD) can enhance AGB estimation accuracy ([5]). Chave et al. ([6]) further refined this model by analyzing over 4000 harvested trees across tropical forests in Latin America, Asia, and Oceania. This improved equation has since been widely adopted in remote sensing-based AGB assessments ([13], [7], [21]).
Unlike DBH and H, WD cannot be measured in the field. Accurate WD assessment typically requires destructive sampling, which is time-consuming and costly. Current practices involve identifying tree species and referencing existing WD databases, but this approach suffers from critical limitations: (i) databases contain sparse samples for many tropical tree species, and (ii) WD exhibits intraspecific variation across environmental gradients. Understanding WD variability among dipterocarps is therefore essential for improving the accuracy of carbon stock assessments in tropical forests. However, species identification remains a major barrier because reproductive material for species-level identification is often absent during field surveys. Consequently, researchers often use WD averages at the genus or family level ([7], [28]), which can introduce substantial uncertainty in carbon stock assessments.
Recent studies have attempted to develop species-independent models for predicting WD using non-destructive methods ([9]). For example, Coomes et al. ([7]) found that top-of-canopy height derived from airborne laser scanning correlates with basal area-weighted mean WD. Additionally, micro-drilling devices have gained attention as tools to assess intra-tree WD variability by measuring drilling resistance ([23], [8]). Micro-drilling has been applied in contexts such as tree health assessment ([19], [25]), age prediction ([30]), and wood quality analysis ([17]). To date, the application of micro-drilling techniques for estimating WD is primarily in nontropical forests ([11], [31], [32]) or exotic plantation species for tropical regions ([15], [27], [10], [16]). Predicting WD of tropical forest species for AGB assessments remains limited ([8]).
This study presents a novel evaluation of Resistograph-based WD estimation for standing dipterocarps in northern Borneo’s upland forests. We first examined the relationships between DR variables and field WD via increment coring. We then developed a species-independent WD prediction model using stepwise multiple linear regression and evaluated its performance against field WD and database WD. Finally, we assessed the impact of predicted WD on AGB estimation. To our knowledge, this is the first study to evaluate the use of Resistograph-based drilling resistance for estimating WD in standing dipterocarp trees in tropical forests.
Methodology
Study area
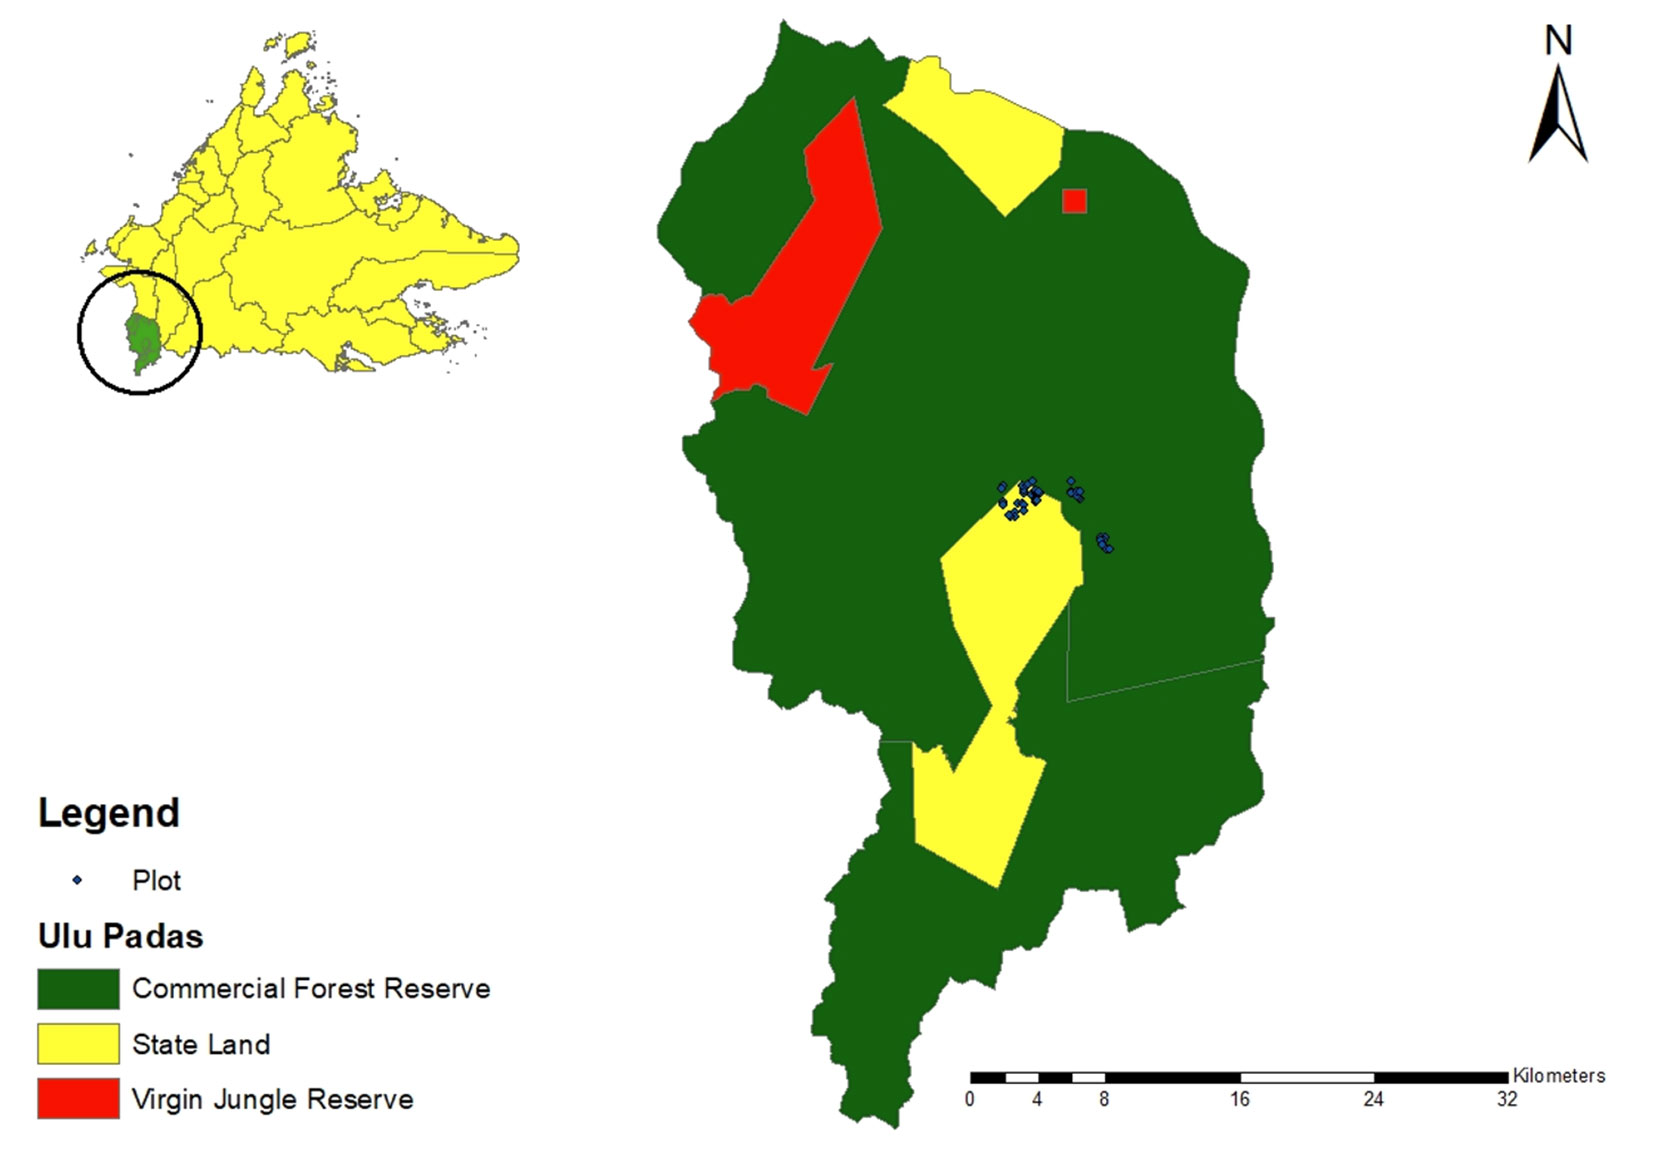
This study was conducted in the Ulu Padas region of the Sipitang District, located in southwestern Sabah, Malaysia (Fig. 1). Geographically, the area is situated near the confluence of the borders of Sabah, Sarawak, and Kalimantan (04° 23′ - 04° 27′ N, 115° 42′ - 115° 47′ E). It comprises a mosaic of state lands and commercial forest reserves, which have been under the administration of the Sabah Forestry Department since September 2021. The topography is predominantly undulating to hilly, with elevations ranging from about 1000 to 1600 m a.s.l. The region lies within a transitional zone between mixed dipterocarp and lower montane forests, with mixed dipterocarp forest representing a dominant and ecologically significant component (Ministry of Tourism, Sabah, unpublished). Annual precipitation ranges from 2000 to 3500 mm, supporting dense, high-biomass vegetation typical of humid tropical forests. Land use within the area includes commercial timber extraction in the managed forests and slash-and-burn agriculture on state lands. Reduced-impact logging (RIL) techniques were introduced in the early 2000s to mitigate the ecological degradation associated with earlier conventional logging practices. These land-use histories contribute to the current forest heterogeneity and pose challenges for sustainable forest management and biomass assessment.
Fig. 1 - Map of the study area in Sabah, Malaysia, showing sampling locations in state lands and managed forest compartments.
Field data collection
The field data collection was carried out between April 2021 and March 2022. Dipterocarp trees were sampled within inventory plots from a previous research project (n = 36). The plots were 30 × 30 m squares established in 2011 and remeasured in 2017 ([21]). There were forty-two dipterocarps, which could only be identified to the genus level. We conducted drilling resistance measurements and coring on healthy dipterocarp trees without physical anomalies like hollowness or truncations. We also measured tree height and diameter at breast height.
We conducted the DR on all dipterocarp trees using the Rinntech Resistograph® R650-ED (Heidelberg, Germany) at breast height. A drilling speed of 20 mm s-1 was used to maintain stable penetration while minimizing frictional heating that could influence resistance signals and core quality. Faster speeds may increase thermal effects and distort measurements, whereas slower speeds can lead to unstable readings and inefficient sampling. Thus, the adopted drilling speed represents a practical balance between measurement reliability and operational efficiency across a range of wood densities. The micro-drilling device used a 3 mm diameter needle 50 cm long. A graphic representation of the energy consumed by the electric motor in penetrating the wood, known as a resistogram, was checked immediately to ensure no wood decay. Resistograms were downloaded to a computer for further analysis. The profiles were processed with DECOM Scientific 2.38m1 (⇒ https://software.rinntech.com/decom). We truncated the initial part of the drilling resistance profile, which represents the bark. We derived several DR variables from the resistograms using IBM SPSS Statistics® ver. 26. The drilling resistance (DR) variables used in this study are shown in Tab. 1.
Tab. 1 - Drilling resistance variables used for wood density assessment.
| Resistograph variables | Symbol | Description |
|---|---|---|
| Median | DR Med | Middle value of drilling resistance along the resistograph profile |
| Mean | DR Mean | Average drilling resistance along the tree trunk |
| Standard deviation | DR StD | Dispersion or variability of resistance values around the mean |
| Maximum value | DR Max | Highest drilling resistance recorded during penetration |
| Covariance | DR CoV | Joint variability between drilling resistance values and penetration depth along the resistograph profile |
| Slope | DR Slope | Angle (°) between the minimum and maximum drilling resistance values along the resistograph profile, representing the overall gradient of resistance increase during drilling |
| Minimum value | DR Min | Lowest drilling resistance recorded during penetration |
| Drilling length | DR Length | Total penetration depth of the resistograph needle in the stem (mm) |
Wood core extraction and wood density determination
Dipterocarp trees were drilled from bark to pith at breast height to extract wood cores using a Haglöf increment borer with a power drill-borer (DeWalt DCF899HP2 20V impact wrench). A Mitutoyo 150 mm digital caliper was used to determine the core’s diameter and length. The cores were then weighed using a digital micro weighing scale and stored in a cooler box in the field.
The volume of each sample was calculated before drying using eqn. 1 according to Chave et al. ([6]):
where V is volume (cm3), D is the diameter (cm), and L is the total green length (cm) of the sample.
In the laboratory, the cores were oven-dried at 105 oC for 72 hours. The samples were placed in a desiccator to cool down until they reached a constant mass. The following equation was used to calculate the moisture content (MC, % - eqn. 2):
where M1 is the fresh weight of the sample, and M2 is the oven-dry weight of the sample. Moisture content was determined to calculate the oven-dry mass of each wood sample. The oven-dry mass was then used to compute wood density (WD, g cm-3 - eqn. 3):
where L is the total green length (cm), D is the mean diameter of the core sample (cm), and M is the dry mass (g) of the core sample.
In this study, wood density was calculated as basic wood density, defined as oven-dry mass divided by green volume. Basic wood density is the standard parameter used in tropical forest biomass allometric equations ([6]), and therefore it is the most appropriate density metric for aboveground biomass (AGB) estimation. Although drilling resistance measurements were obtained under natural moisture conditions (i.e., green wood), we selected basic wood density as the response variable because it aligns with the standard used in tropical forest biomass equations. Modeling the relationship between drilling resistance and basic wood density allows the resulting model to be directly integrated into aboveground biomass and carbon stock estimation frameworks.
Aboveground biomass estimation
We further evaluated the proposed approach by applying the predicted WD value in Chave et al. ([6]) allometry to estimate tree AGB. We used the Chave et al. ([6]) allometric equation because it is widely used across the tropical region for both old-growth and secondary forests. Our previous research also found it to be one of the best for tropical forest AGB estimation ([20]). The allometric equation is as follows (eqn. 4):
where p is the wood density (g cm-3), D is the tree diameter at breast height (cm), and H is the tree height (m).
We calculated AGB estimates of the dipterocarps using field-measured WD, database WD, and predicted WD values. To assess potential over- or underestimation, we compared AGB derived from predicted and database WD with AGB calculated using field-measured WD. We used wood density values from the Global Wood Density Database ([12]) as species-level reference benchmarks, reflecting common practice in biomass estimation studies. These values were not converted to basic wood density and thus were not treated as directly equivalent to the coring-derived basic WD measured in this study. Because the database compiles measurements obtained under varying protocols and moisture conditions, we interpreted observed differences as reflecting methodological and site-specific variability.
Statistical analyses
We first examined correlations between field-measured basic wood density (WD) and drilling resistance (DR) variables using Pearson’s correlation. We then regressed field WD against DR variables using stepwise multiple linear regression in R version 4.0.3. We identified outliers as values exceeding ±3 standard deviations from the mean DR and removed them before model fitting.
Model performance was evaluated using the adjusted coefficient of determination (adj-R2), Akaike information criterion (AIC), root-mean-square error (RMSE), and relative RMSE (%RMSE). We used adjusted R2 to assess the proportion of variance explained by the model, while RMSE and %RMSE provided complementary measures of predictive accuracy. Leave-one-out cross-validation (LOOCV) was applied to calculate cross-validated RMSE.
To evaluate model robustness, we also fitted models using a log-transformation of the dependent variable (Field WD) with the same DR predictors. Predicted WD values from log-transformed models were back-transformed using the Baskerville ([3]) correction factor to account for bias introduced by log transformation. These log-transformed models were used as a robustness check to evaluate model stability.
The best-fit predictive WD model was used to generate predicted WD for each tree. RMSE (%) was calculated for field WD, predicted WD (from Resistograph variables), and database WD. An unpaired Student t-test was used to compare the means of predicted WD and database WD with Field WD.
Results
Characteristics of the Dipterocarp trees
Tab. 2 shows the structural characteristics of the dipterocarp trees (n = 42) in the study area. The mean DBH was 20.7 cm (standard deviation, SD = 10.15 cm), with a maximum DBH value of 45.8 cm. Tree height (H) averaged 18.5 m (SD = 5.59 m), and the maximum H was 32.8 m. Mean wood density (WD) was 0.500 g cm-3 (SD = 0.140 g cm-3), indicating moderate variability among sampled trees. The maximum WD recorded was 0.770 g cm-3 for dipterocarps in the Ulu Padas area.
Tab. 2 - Summary of field variables of dipterocarps (n = 42).
| Statistic | DBH (cm) |
H (m) |
WD (g cm-3) |
|---|---|---|---|
| Mean | 20.70 | 18.50 | 0.500 |
| Standard deviation | 10.15 | 5.59 | 0.140 |
| Maximum | 45.80 | 32.80 | 0.770 |
Correlation between field WD and drilling resistance variables
Pearson’s correlations between field WD and DR variables are presented in Tab. 3. All DR variables had a positive correlation with the field WD except for DRCoV. Field WD was significantly correlated with all DR variables except for DRLength, DRMin, and DRCoV. Field WD had a strong positive correlation with DRStD (r = 0.649), DRSlope (r = 0.624), DRMean (r = 0.622), DRMax (r = 0.615), and DRMedian (r = 0.618).
Tab. 3 - Pearson’s correlations between field wood density and resistance variables (n = 42). (*): p<0.05.
| - | Field WD | DR Mean | DR Length | DR Max | DR Min | DR StD | DR CoV | DR Slope |
|---|---|---|---|---|---|---|---|---|
| DR Mean | 0.622* | 1 | - | - | - | - | - | - |
| DR Length | 0.124 | 0.474* | 1 | - | - | - | - | - |
| DR Max | 0.615* | 0.923* | 0.408* | 1 | - | - | - | - |
| DR Min | -0.025 | 0.112 | 0.067 | 0.059 | 1 | - | - | - |
| DR StD | 0.649* | 0.915* | 0.325* | 0.965* | -0.100 | 1 | - | - |
| DR CoV | 0.295 | 0.055 | -0.226 | 0.122 | -0.665 | 0.302* | 1 | - |
| DR Slope | 0.624* | 0.617* | -0.160 | 0.585* | 0.199 | 0.662* | 0.200 | 1 |
| DR Median | 0.618* | 0.955* | 0.386 | 0.983* | 0.097 | 0.963* | 0.081 | 0.650* |
Wood density estimation models
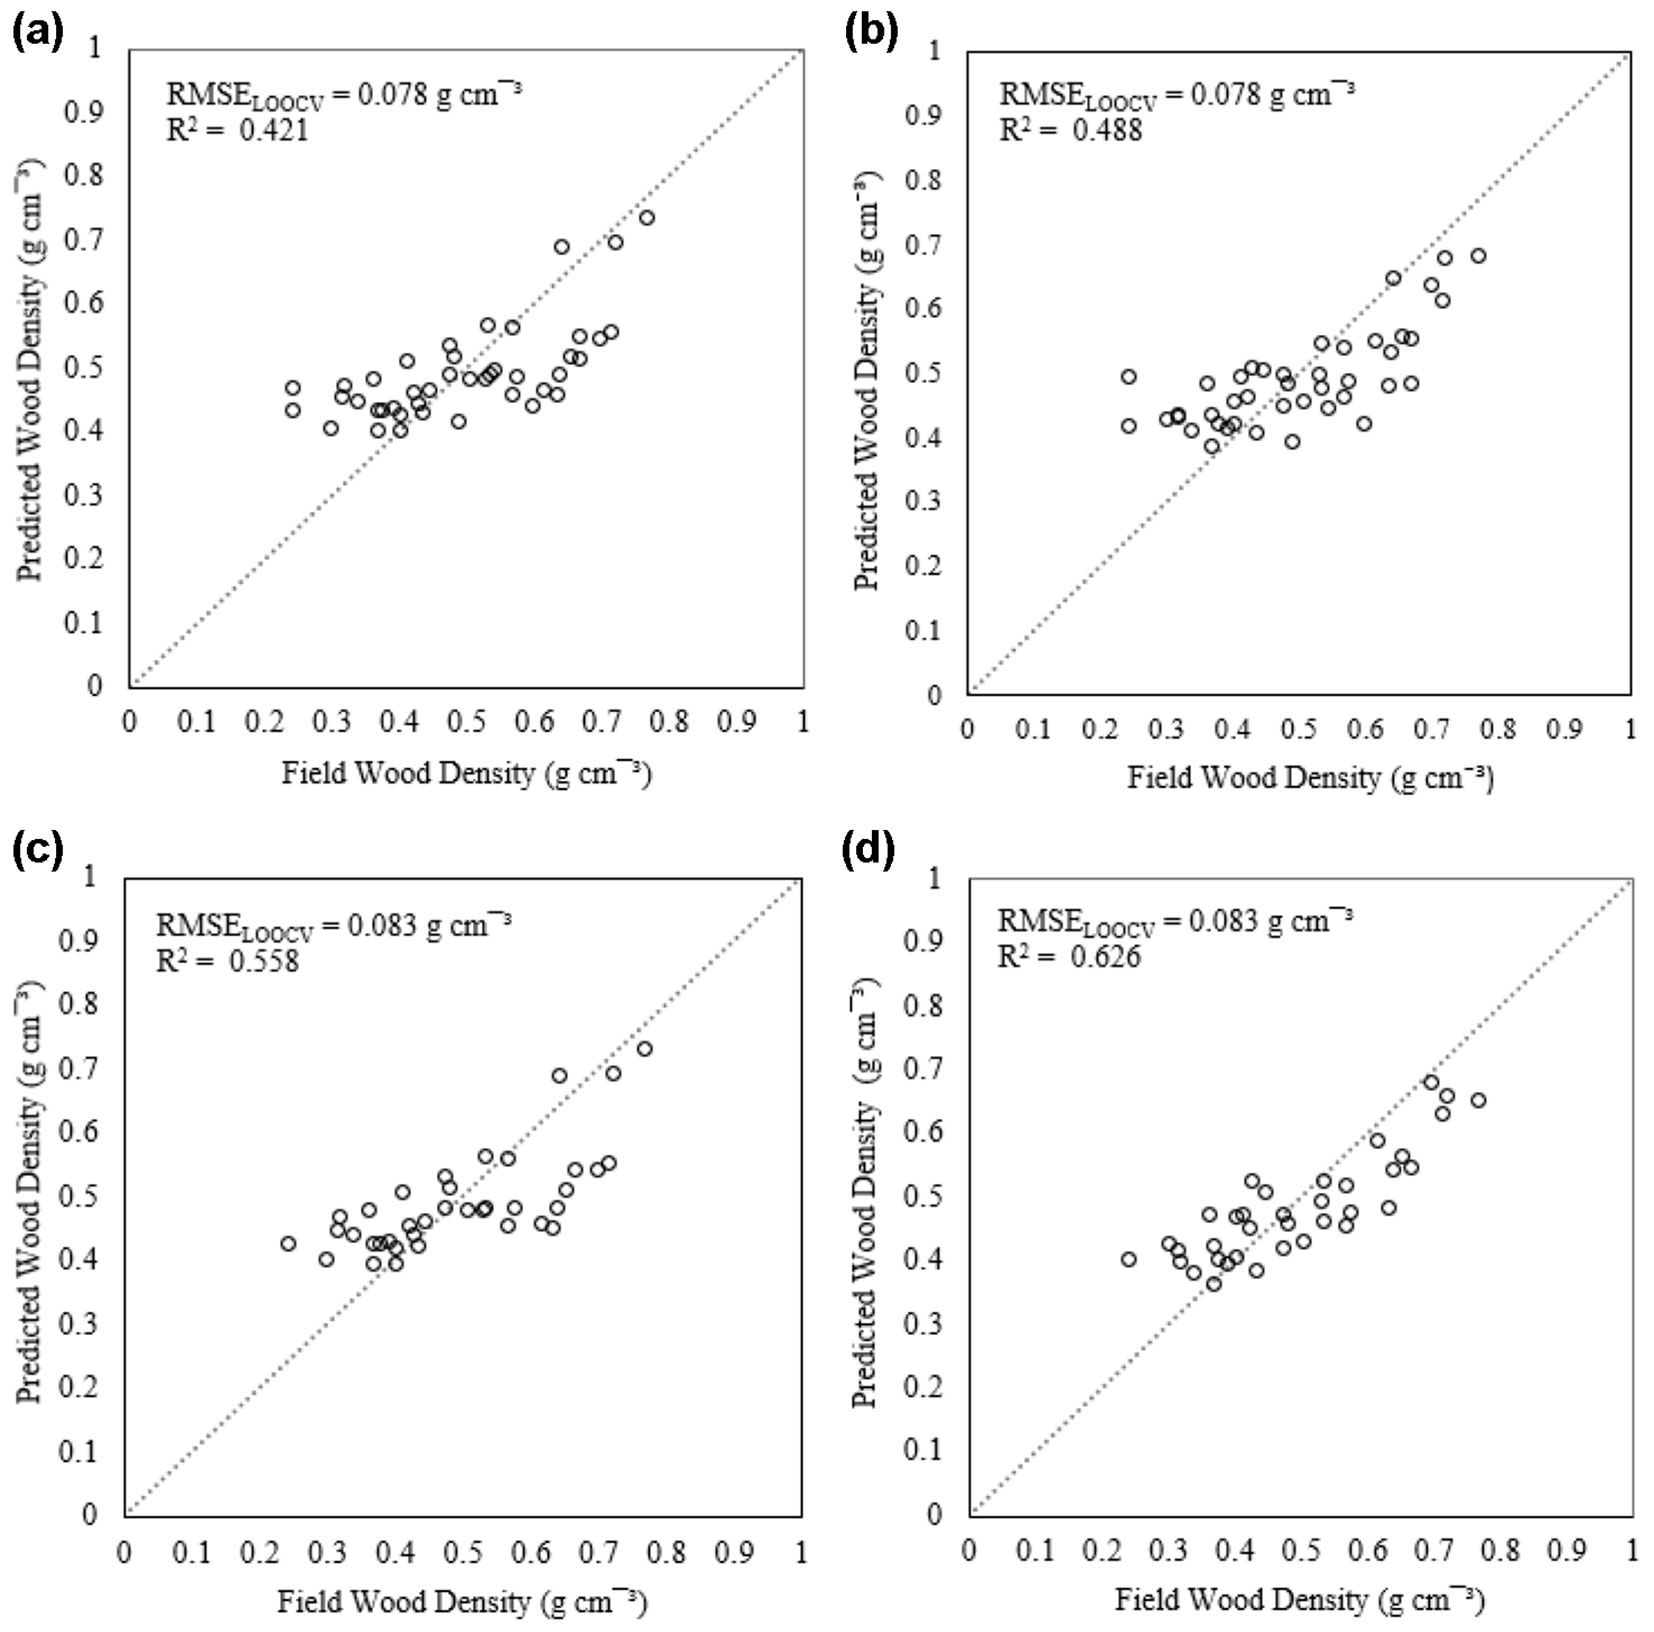
Tab. 4 summarizes the results of stepwise regression models developed to predict wood density (WD) before and after outlier removal. Before removing outliers, Model 1 had a single predictor (DRStD) that significantly predicted WD (F[1, 40] = 29.056, p <0.001), but the R2 was only 0.421. Model 2, which included a second variable (DRSlope), better explained variation in WD (adj-R2 = 0.462) and showed better fit, as indicated by a lower AIC (-189.554). The models showed moderate predictive performance, with MAE values of 0.083 g cm-3 and 0.078 g cm-3 for models 1 and 2, respectively.
Tab. 4 - Stepwise regression results between wood density and drilling resistance variables. (a) WD estimation models before outlier removal (n = 42); (b) WD estimation models after outlier removal (n = 37).
| Outliers | No | Model | R2 | R2adj | RMSE (%) |
AIC | F | VIF |
|---|---|---|---|---|---|---|---|---|
| (a) Before removal |
Model 1 | WD = 0.390 + 0.00113 DRStD | 0.421 | 0.406 | 15.691 | -186.367 | 20.056 | 1.000 |
| Model 2 | WD = 0.349 + 0.000734 DRStD + 2.215 DRSlope | 0.488 | 0.462 | 15.710 | -189.554 | 18.590 | 1.782 (DRStD) 1.782 (DRSlope) |
|
| (b) After removal |
Model 1 | WD = 0.384 + 0.0011 DRStD | 0.558 | 0.546 | 16.612 | -174.468 | 44.259 | 1.000 |
| Model 2 | WD = 0.320 + 0.000577 DRStD + 3.182 DRSlope | 0.626 | 0.604 | 16.843 | -178.582 | 28.414 | 1.806 (DRStD) 1.806 (DRSlope) |
All models constructed after outlier removal showed improved performance across all indicators except RMSE (Tab. 4). Model 1 (with DRStD) yielded an R2 of 0.558 (F[1, 35] = 44.259, p <0.001) and an RMSE of 16.759%. Model 2 included DRStD and DRSlope as predictors (F[2, 34] = 28.414, p <0.001). Moreover, the adj-R2 increased to 0.604 compared with the model before outlier removal. The model explained 60.4% of the WD variability with no multicollinearity issues (VIF < 5). The MAE values improved to 0.0764 g cm-3 and 0.0643 g cm-3 for models 1 and 2, respectively.
Fig. 2 shows the scatterplots of field WD and predicted WD before and after outlier removal. The scatterplots show improved alignment of predicted values with the 1:1 line, especially for model 2 after outlier removal. This suggests a stronger correspondence between predicted and observed wood densities. Considering model explanatory power and error, we selected model 2 after outlier removal to predict WD.
Fig. 2 - Field wood density (WD) versus predicted WD. (a) Model 1 before outlier removal; (b) Model 2 before outlier removal; (c) Model 1 after outlier removal; (d) Model 2 after outlier removal. Outlier removal significantly improved the model’s adjusted R2. The highest adjusted R2 increased from 0.614 to 0.771 after outlier removal.
To further examine model sensitivity to functional form, we fitted an additional regression model using a log-transformed dependent variable (Field WD). The log-transformed model resulted in lower prediction error, with RMSE values of 0.041 and relative RMSE ranging from 8.36% to 9.14%, compared with RMSE values of 0.078-0.083 and relative RMSE of 15.69-16.84% for the original linear models. However, the adjusted R² values of the linear models after outlier removal (0.406-0.604) were higher than those obtained from the log-transformed models (0.346-0.571). Predicted WD values from the log-transformed models were back-transformed to the original scale using a Baskerville correction factor. Given the objective of explaining variation in wood density across mixed dipterocarp species, model selection prioritized explanatory power (adj-R²) alongside prediction error. Accordingly, Model 2 after outlier removal was retained as the final predictive model, while the log-transformed formulation was used as an additional robustness assessment.
Aboveground biomass estimates using different wood density values
Tab. 5shows the results of the paired t-test to compare the means of groups: (i) database WD vs. field WD; (ii) field WD vs. predicted WD. There were significant differences (t[36] = 10.234, p <0.001) between field WD (mean = 0.495, SD = 0.137) and database WD (mean = 0.723, SD = 0.100). Database WD values, used here as species-level reference benchmarks rather than directly comparable measurements, were substantially higher than field-measured WD on average (mean difference = 0.228; 95% confidence interval: 0.183-0.273). In contrast, there was no significant difference (t[36] = -0.217, p = 0.830) between field WD (mean = 0.495, SD = 0.137) and predicted WD (mean= 0.499, SD = 0.126). Tab. 6 shows the effects of WD values from different methods on AGB estimation. AGB with field WD was used as the reference for the comparison. AGB estimation using predicted WD resulted in a significantly lower RMSE (25.933%) than AGB using database WD (RMSE = 32.260%). AGB derived from predicted WD showed a relatively small underestimation of the reference AGB (122.71 kg), whereas AGB based on database WD produced a substantially larger positive deviation (4063.29 kg).
Tab. 5 - Comparing the mean difference between database WD and predicted WD to field WD.
| Parameter | Database WD vs. Field WD |
Predicted WD vs. Field WD |
|
|---|---|---|---|
| Paired Student’s t | 10.234 | -0.217 | |
| Degrees of freedom | 36 | 36 | |
| Probability (2-tailed) | <0.001 | 0.83 | |
| Mean Difference | 0.228 | -0.004 | |
| Standard Error | 0.022 | 0.017 | |
| 95% Confidence Interval | Upper | 0.273 | 0.031 |
| Lower | 0.183 | -0.040 | |
Tab. 6 - Total AGB estimates using different wood density values.
| Reference | Relative RMSE (%) | Total AGB (kg) |
Over (+) or Under (-) estimation | |
|---|---|---|---|---|
| (kg) | (%) | |||
| Field WD | - | 13372.470 | - | - |
| Database WD | 32.260 | 17435.760 | +4063.290 | +30.382 |
| Predicted WD | 25.933 | 13249.763 | -122.707 | -0.918 |
Discussion
As nature-based carbon credits become increasingly mainstreamed into climate change mitigation strategies through carbon market mechanisms, more carbon-credit-oriented projects are expected in tropical regions. Accurate estimation of aboveground biomass (AGB) is fundamental to these initiatives and typically relies on allometric equations that incorporate wood density (WD) as a key variable. However, current approaches to determining WD depend entirely on species identification and values retrieved from existing databases, which often fail to account for intra-specific or local variability. In this study, we revisited the application of the resistograph to develop a predictive model for WD in dipterocarps of northern Borneo, offering a potentially more accurate alternative to database-derived estimates.
The resistograph operates on the principle that wood density is positively correlated with resistance to needle penetration during drilling. Although widely used for assessing wood quality and decay in trees, its application for estimating wood density (WD) in tropical forests remains relatively limited. Moreover, existing studies have primarily focused on single species, including Pinus taeda ([15]) and Eucalyptus globulus subsp. pseudoglobulus ([18]), with more recent investigations on standing Eucalyptus plantations in Indonesia ([29]) and woods of selected Brazilian tree species ([8]). These studies typically employ simple linear regression models using a single predictor variable, i.e., drilling resistance (DR).
Consistent with previous single-species studies that reported weak to strong correlations between DR and WD ([15], [18], [8], [29]), we also observed a broad range of correlations in our data except for two DR variables. The strong positive correlations between field WD and several resistograph variables, such as DRMean, DRStD, and DRSlope, validate its importance for tropical species, comparable to correlations reported in temperate tree species ([15]) and matching recent findings from Indonesian eucalypts ([29]).
Our study employed multiple linear regression to predict WD across several dipterocarp species. In an Indonesian study, single-predictor models yielded coefficients of determination (R2) ranging from 0.52 to 0.76 ([29]). Similarly, Da Silva et al. ([8]) reported variable wood WD model performance across Brazilian native species, with R² values as low as 0.32 for Joannesia princeps Vell and as high as 0.80 for Libidibia ferrea var. parvifolia Benth and Astronium concinnum (Engl.) Schott. Some studies have also explored resistograph-based WD models using multiple linear regression ([1], [27]). Our results demonstrated that model explanatory power improved from 55.8% to 62.6% when two predictors were included. Nevertheless, predicting WD across a larger region may require including site factors ([31]).
Model selection in ecological regression involves balancing explanatory power and predictive accuracy, as different metrics reflect distinct objectives ([33]). In this study, the primary goal was to characterize the relationship between DR and WD across multiple dipterocarp taxa; thus, adjusted R2 was prioritized as the main criterion. RMSE and relative RMSE were considered complementary measures of predictive performance. Although log-transformed models reduced RMSE, the linear model was retained because it provided slightly higher explanatory power and more straightforward interpretation of WD responses to DR variables. Moderate adj-R2 values are common in ecological predictive models due to inherent biological and environmental variability ([33]), and the performance observed here aligns with uncertainty ranges reported for tropical biomass estimation ([6]).
Comparison between the predicted WD and field WD revealed no significant difference in means. In contrast, the significant discrepancy between database WD and field measurements reveals systemic limitations in current WD estimation practices. This is likely because database WD values are averaged across multiple locations, introducing measurement errors, inconsistencies, and potential biases ([26]). The higher root mean square error (RMSE) for database WD (23.90%) compared to predicted WD (16.84%) further supports the superiority of resistograph-based estimates in reflecting true WD at a given site and potentially across regions with similar habitat conditions. These inaccuracies propagated to AGB estimates, with database values producing 32.26% RMSE compared to 25.93% based on resistograph predictions, which is nearly a 20% improvement in precision. Such overestimations could substantially distort carbon credit valuations, potentially inflating market transactions.
Several limitations should be acknowledged. First, resistograph measurements from healthy trees may still be influenced by internal decay, which can distort resistance readings and reduce the reliability of predicted WD ([22]). Future studies should investigate how decay affects WD predictions. Second, trees in this study were identified only to the genus level, whereas global WD databases are typically organized by species; species-level comparisons would allow more rigorous validation. Third, the sample may not capture the full variability of dipterocarp WD across environmental gradients. Broader geographic sampling could help account for landscape-scale variability. Finally, examining the relationship between DR and green wood density could provide insights into wood mechanical behavior during drilling, as resistograph measurements are influenced by natural moisture content.
Despite these limitations, this study demonstrates that resistograph-based methods offer a practical, scalable, and accurate alternative to conventional approaches for estimating WD in tropical tree species. The ability to obtain field WD estimates non-destructively is particularly valuable for long-term forest monitoring, carbon accounting, and sustainable forest management in data-poor tropical regions.
Conclusions
This study evaluated the potential of using resistograph-derived drilling resistance (DR) variables to estimate wood density (WD) in dipterocarp species of northern Borneo. We demonstrated that field-based WD could be accurately predicted from DR profiles, outperforming current practice using database WD values. Our two-variable model, using DRstd and DRSlope, provided the best balance of predictive power and model stability. This study confirms that database-based WD led to a relatively significant overestimation of AGB, whereas resistograph-based predictions closely matched field measurements and produced more accurate AGB estimates. These findings highlight the limitations of relying solely on global WD databases for local forest carbon assessments and suggest a promising role for resistograph technology in improving the accuracy of tropical forest biomass inventories without species identification.
Accurate AGB estimation is a prerequisite for developing carbon stock as a new green product in forestry. While the resistograph-based model demonstrates strong potential for WD prediction, its broader application for biomass estimation should be approached with caution. A more taxonomically and geographically diverse dataset is necessary to enhance model robustness and generalizability. Although further validation at the species level and in trees with internal decay is warranted, the approach outlined in this study provides a viable and effective tool for enhancing the precision of forest carbon accounting in tropical ecosystems.
Acknowledgements
This project was funded by the Fundamental Research Grant Scheme of the Ministry of Higher Education Malaysia (FRGS/1/2019/WAB07/UMS/01/1) and UMS Great Research Grant (GUG0447-1/2020). We thank Universiti Malaysia Sabah for support, and the Sabah Biodiversity Center for providing the Access License (JKM/MBS1000-2/2 JLD.12 (61)). Permission to sample trees was provided by the Sabah Forestry Department.
References
Gscholar
CrossRef | Gscholar
CrossRef | Gscholar
CrossRef | Gscholar
Authors’ Info
Authors’ Affiliation
Alexius Korom 0000-0001-7164-6392
Faculty of Plantation and Agrotechnology, Universiti Teknologi MARA Sabah, 88997, Kota Kinabalu, Sabah (Malaysia)
Wilson Vun Chiong Wong 0000-0001-7285-3908
Mui-How Phua 0000-0002-1205-3105
Faculty of Tropical Forestry, Universiti Malaysia Sabah, Jalan UMS, 88400, Kota Kinabalu, Sabah (Malaysia)
Corresponding author
Paper Info
Citation
Joseph J, Maripa RD, Wong WVC, Korom A, Phua M-H (2026). Species-independent estimation of dipterocarp wood density using drilling resistance: implications for carbon accounting. iForest 19: 369-375. - doi: 10.3832/ifor4894-019
Academic Editor
Paola Cetera
Paper history
Received: May 06, 2025
Accepted: May 08, 2026
First online: Sep 12, 2026
Publication Date: Oct 31, 2026
Publication Time: 4.23 months
Copyright Information
© SISEF - The Italian Society of Silviculture and Forest Ecology 2026
Open Access
This article is distributed under the terms of the Creative Commons Attribution-Non Commercial 4.0 International (https://creativecommons.org/licenses/by-nc/4.0/), which permits unrestricted use, distribution, and reproduction in any medium, provided you give appropriate credit to the original author(s) and the source, provide a link to the Creative Commons license, and indicate if changes were made.

Web Metrics
Breakdown by View Type
Article Usage
Total Article Views: 378
(from publication date up to now)
Breakdown by View Type
HTML Page Views: 89
Abstract Page Views: 152
PDF Downloads: 110
Citation/Reference Downloads: 0
XML Downloads: 27
Web Metrics
Days since publication: 10
Overall contacts: 378
Avg. contacts per week: 264.60
Article Citations
Article citations are based on data periodically collected from the Clarivate Web of Science web site
(last update: Jul 2026)
(No citations were found up to date. Please come back later)
Publication Metrics
by Dimensions ©
Articles citing this article
List of the papers citing this article based on CrossRef Cited-by.
Related Contents
iForest Similar Articles
Research Articles
Allometric relationships for volume and biomass for stone pine (Pinus pinea L.) in Italian coastal stands
vol. 6, pp. 331-335 (online: 29 August 2013)
Research Articles
Aboveground biomass and carbon estimations for Abies religiosa (Kunth) Schltdl. & Cham. in Mexico: regional allometric models
vol. 19, pp. 339-347 (online: 02 September 2026)
Research Articles
Voluntary carbon credits from improved forest management: policy guidelines and case study
vol. 11, pp. 1-10 (online: 09 January 2018)
Technical Reports
Regulation and future prospects of the Italian voluntary forestry carbon credit market
vol. 19, pp. 219-225 (online: 08 June 2026)
Research Articles
Estimation of aboveground forest biomass in Galicia (NW Spain) by the combined use of LiDAR, LANDSAT ETM+ and National Forest Inventory data
vol. 10, pp. 590-596 (online: 15 May 2017)
Research Articles
Outlook of the European forest-based sector: forest growth, harvest demand, wood-product markets, and forest carbon dynamics implications
vol. 11, pp. 315-328 (online: 18 April 2018)
Research Articles
Carbon stock in Kolli forests, Eastern Ghats (India) with emphasis on aboveground biomass, litter, woody debris and soils
vol. 4, pp. 61-65 (online: 05 April 2011)
Research Articles
Modeling aboveground carbon in flooded forests using synthetic aperture radar data: a case study from a natural reserve in Turkish Thrace
vol. 17, pp. 277-285 (online: 27 September 2024)
Research Articles
Effects of traditional forest management on carbon storage in a Mediterranean holm oak (Quercus ilex L.) coppice
vol. 11, pp. 344-351 (online: 18 April 2018)
Research Articles
Estimation of above-ground biomass and sequestered carbon of Taurus Cedar (Cedrus libani L.) in Antalya, Turkey
vol. 6, pp. 278-284 (online: 01 July 2013)
iForest Database Search
Search By Author
Search By Keyword
Google Scholar Search
Citing Articles
Search By Author
Search By Keywords
PubMed Search
Search By Author
Search By Keyword