Effects of traditional forest management on carbon storage in a Mediterranean holm oak (Quercus ilex L.) coppice
iForest - Biogeosciences and Forestry, Volume 11, Issue 2, Pages 344-351 (2018)
doi: https://doi.org/10.3832/ifor2424-011
Published: Apr 18, 2018 - Copyright © 2018 SISEF
Research Articles
Abstract
In the last decade, there has been increased interest in measuring and modeling storage in the five forest carbon pools: the aboveground and belowground biomass (living biomass), the deadwood and litter (dead biomass), and the soil (soil organic matter). In this paper, we examined carbon storage in a holm oak coppice stand in the Madonie Mountains in Sicily (Italy), which is a typical case of managed coppice stands. Today, traditional coppice practices are only applied to a small number of forested areas in Sicily, such as the selected site, because of the decline in demand for wood and charcoal. The dendrometric parameters of the stands were recorded, and silvicultural indices were calculated immediately after cutting as well as during and at the end of the rotation period; they showed the trends typical of coppices. The carbon stocks in the five carbon pools were quantified to investigate the effects of coppicing on carbon storage in this Mediterranean area. Results showed that the lowest living biomass values were observed in the first years following coppicing, except for litter carbon. Belowground biomass and the soil carbon stock did not vary significantly with coppicing. During the rotation period, the aboveground biomass was completely restored, and the balance of the carbon stocks indicates that coppicing is a sustainable forest management choice from the point of view of the carbon balance, given that the logged trees are generally used for bioenergy production.
Keywords
Carbon Pool, Aboveground Carbon, Belowground Carbon, Dead Carbon, Litter Carbon, Soil Carbon, Coppicing
Introduction
According to Intergovernmental Panel on Climate Change ([16]), carbon storage in forest ecosystems involves the following five carbon pools: the aboveground and belowground biomass (living biomass), the deadwood and litter (dead biomass), and the soil (soil organic matter). Forest carbon storage provides an important mechanism for mitigating climate change, and it is an essential ecosystem service that is classified as a regulating service ([24]). However, the role of forests as a carbon pool is only ensured if the proportion of living biomass exceeds the loss of carbon due to dying biomass, forest fires, and harvest. In the context of climate change, Mediterranean forests are considered vulnerable to the loss of biodiversity and carbon storage services ([12], [1]). Moreover, the projections of the effects of climate change in Mediterranean basin may lead to reduced productivity and lower resilience of forests ([41]). Therefore, estimating carbon stocks and their distribution in the different components of ecological and production systems is essential to understanding how carbon is allocated among labile and stable components. This information is also important for evaluating the quantity of carbon that can potentially be emitted into the atmosphere owing to natural or human-induced disturbances ([43]).
Interest in measuring and modeling carbon storage in forests has greatly increased over the last decade, and many studies have adopted a comprehensive approach to investigate the quantification of carbon stocks that accounts for all of the five carbon pools in forest ecosystems ([27], [7], [37], [25], [28], [38]). However, some studies focused on only one carbon pool, such as the soil ([46], [10], [34]), deadwood (logs, snags, fine and coarse woody debris - [14], [15], [30]) or living biomass ([35], [36]), while other studies have considered 4 carbon pools by omitting pools such as soil ([49]) or deadwood ([33], [39]). Pan et al. ([31]) attempted to quantify forest carbon pools at the global level and estimated the total stock to be 861 Pg of carbon with 45% in the soil (up to 1 m in depth), 42% in the above- and belowground biomass, 8% in deadwood and 5% in litter. Geographically, 55%, 32% and 14% of carbon is stored in tropical, boreal and temperate forests, respectively, which is why studies of the carbon pools in the Mediterranean region are required.
In recent years, some research has focused on the influences of forest management on carbon storage ([32]), and some studies have also investigated the distribution of carbon stocks among the different pools in the Mediterranean region ([2], [7], [37], [25], [28], [38]). However, most of those studies have been carried out in coniferous stands, except for De Simon et al. ([7]) and Oubrahim et al. ([28]) who investigated broadleaved stands.
The history of Mediterranean forests encompasses fragmentation, degradation and deforestation, natural expansion ([40]) and afforestation, and Sicilian forests reflect all of these dynamics. In Sicily, the typical forest stand is dominated by holm oak (Quercus ilex L.), which forms a discontinuous patchwork mainly located along the slopes of the primary mountain ranges. Holm oak coppices account for 28.650 hectares or approximately 10% of the forest area in Sicily ([3]), and play a significant role in the carbon balance of this region. In most of these stands, minimal or no silvicultural management has been applied in recent decades. Since these forests are generally characterized by a simplified structure and composition originated by past intensive coppicing, they urgently require silvicultural treatments to ensure both their ecological resilience and functioning as carbon pools. Only a few holm oak coppices are still managed, thus the reconstruction of historical management in most cases is practically impossible. Coppicing remains the only traditional forest management system used to provide firewood at the local scale.
The objectives of this study were (i) to quantify the carbon stocks in the five carbon pools (above and belowground biomass, deadwood, litter and soil) in a holm oak coppice stand generated by silvicultural felling practices carried out at different times and (ii) to investigate the effects of traditional forest management, in the form of coppicing, on carbon storage in a Mediterranean area by examining a significant example of correctly and timely managed stand in Sicily. The quantification of carbon in forest stands is currently of interest to forest managers since carbon storage can be significantly modified through silvicultural practices ([8]). This work contributes to the knowledge on carbon dynamics in a managed holm oak coppice in Mediterranean area.
Materials and methods
Study area
The study area is located in the Madonie Mountains (Sicily, Italy - 37° 53′ N, 14° 06′ E, elevation ~1000 m a.s.l.) within the B zone of the Madonie National Park, in the meso-Mediterranean vegetation belt. The selected forest stand is mainly composed of holm oak (Quercus ilex L.), downy oak (Quercus pubescens Willd.) and manna ash (Fraxinus ornus L.). According to data collected at the Castelbuono meteorological station over the period 1980-2003, the mean annual rainfall is 811 mm, and the corresponding mean air temperature is 14.5 °C. According to the USDA classification system, the soil in the plots is Lithic Xerorthents ([44]).
In the past, coppicing represented the main silvicultural management system aimed at firewood and charcoal productions in the Madonie Mountains ([5], [6]). The number of residents of the nine municipalities of the Madonie Mountains (Castelbuono, Petralia Soprana, Petralia Sottana, Castellana Sicula, Polizzi Generosa, Isnello, Gratteri, Collesano and Geraci Siculo) has decreased from 52.762 in 1951 to 31.258 in 2011 (-41% -[19]) due to emigration to other countries and internal migration. The trend of forest harvesting and its products (cutter timber and fuel wood) in Sicily ([18]) reflects the depopulation of the rural areas such as Madonie Mountains: (i) forest harvesting has decreased from 133.000 m3 in 1950 to 35.000 m3 in 2011; (ii) cutting timber has decreased from 36.000 m3 in 1950 to 16.000 m3 in 2011; and (iii) fuel wood has decreased from 97.000 m3 in 1950 to 20.000 m3 in 2011 ([20]). The gradual abandonment of any silvicultural treatments has consequently led these stands to a state of natural evolution, which is now the most common management system. Today, traditional coppicing practices are currently applied only to a small number of areas, such as the forest stand selected for study.
Four plots (A1, A2, A3, and A4) were established in the study area on the north-eastern slopes (Tab. S1 in the Supplementary material) that were characterized by coppice stands of different age (i.e., 40-year rotation) based on the past silvicultural felling age. In particular, felling occurred in 2013 in plot A1, 2009 in plot A2, 1993 in plot A3, and 1973 in plot A4.
Sampling of dendrometric and structural attributes
Field surveys were conducted in 2014, and one circular subplot with a 20-m radius was established in each plot. The subplots were as homogeneous as possible in terms of altitude, exposure and stand structure. For the dendrometric characterizations, all trees taller than 1.30 m were individually labeled, and their diameters at breast height (Dbh) ≥ 4 cm and heights (H) were measured in each subplot. Dbh values were measured for all shoots on each stool. Using these basic data, the following parameters were calculated for each plot: stem density (shoots ha-1), stool density (stools ha-1), mean tree diameter (Dm, in cm), mean tree height (Hm, in m) and basal area (G m2), and the whole shoot volume (V, in m3) was calculated using mathematical models developed by Tabacchi et al. ([45]). Moreover, three different deadwood components were sampled in each subplot: woody debris (WD), standing dead trees (SDT) and stumps (S). WD includes fallen dead trees and branches lying on the ground with a minimum top diameter (diameter of the narrowest section of the end of a piece of deadwood) of 3 cm and a minimum length of 20 cm; SDT includes all dead trees still standing with Dbh ≥ 3 cm; S includes the portions of trees remaining after cutting or, less frequently, the stems truncated by natural hazards less than 1.30 m and with a diameter at least 3 cm at the cut section or breaking section. All deadwood components were classified according to decay classes adopted for deadwood assessment by the Italian National Forest Inventory ([29], [9], [30]). To characterize the structure, measurements were taken along 10 × 12-m transects oriented to the cardinal directions within the core subplots owing to the homogeneity of the forest stand. In each transect, we recorded DBH and H of all living trees, the height of crown insertion (m), crown radius (mean of the radii taken at the four cardinal points), diameter of the cut section and the height of the stools (in the A1 and A2 plots), and the polar coordinates (angle and distance of each shoot and stool from the center of the subplot). Natural regeneration was also recorded along each transect; in particular, the origin of the plants from seeds or sprouts was determined by examining the form of the stem base and the belowground root system. All plants were classified based on different dimensional thresholds: h < 130 cm, h ≥ 130 cm and Dbh < 4 cm. The forest crown cover was determined using the Stand Visualization System (SVS) software ([23]), which generates graphic images of stand conditions and displays overhead, profile, and perspective views of a forest stand. Finally, we assessed the diversity of the holm oak coppice stands using three indices (see Tab. S2 in Supplementary material). First, the Shannon index (SH - [42]) accounts for species diversity; second, the Winkelmass index (W - [47]) describing the spatial distribution or horizontal structure of the stand; finally, vertical evenness (VE) index which describes the vertical structure ([26]). The SH index integrates both species number and the relative abundance of the different species, assuming values from 0 to ∞; values close to zero indicate low species diversity while high values indicate high species diversity. The W index reflects the regularity of the horizontal spatial distribution of trees in a forest and was calculated based on the number of reference trees (n=6) and the k trees closest to a randomly identified reference tree (k=4). The W index assumes values between 0 (regular distribution) and 1 (clumped distribution); values close to 0.5 indicate a random distribution. The VE index characterizes the vertical distribution of the coverage within a stand and was assessed using the TSTRAT function ([21]), which defines multiple vertical height cut-off points based on tree and crown lengths and assigns individual trees to the vertical strata depending on the position of tree crowns relative to these cut-off points. In this study, we set the lower strata limit at a height of 1.30 m based on field observations; all trees with heights below this lower limit were placed in the lower stratum. The VE index assumes values between 0 and 1; low VE values are characteristic of single-storied stands, whereas the theoretical maximum of 1 would result in vertically equally distributed trees.
Soil sampling
Soil sampling was performed at 10 randomly selected points in each subplot. For a given point, 20 undisturbed soil cores (0.05 m in height by 0.05 m in diameter) were collected following the removal of the litter layer at the depths of 0 to 0.05 m and 0.05 to 0.10 m. In the laboratory, the undisturbed soil cores were used to determine the initial volumetric soil water content, θi (m3 m-3), i.e., the antecedent moisture condition (soil water content at the time of sampling), and the dry soil bulk density, ρb (Mg m-3). Both quantities were measured using the oven-drying method and were averaged over the two depths. Ten disturbed soil samples (0 to 0.10 m in depth) in each subplot were also collected to determine the clay (cl), silt (si), and sand (sa) contents according to USDA standards ([13]). The soil organic carbon, SOC (kg Mg-1), of seven samples was measured by the Walkley-Black method.
Carbon stock estimation
To estimate the carbon stocks in the five forest carbon pools, the approach shown in Fig. 1 was adopted.
Fig. 1 - Flowchart describing the approach adopted for estimating forest carbon pools in the investigated stands.
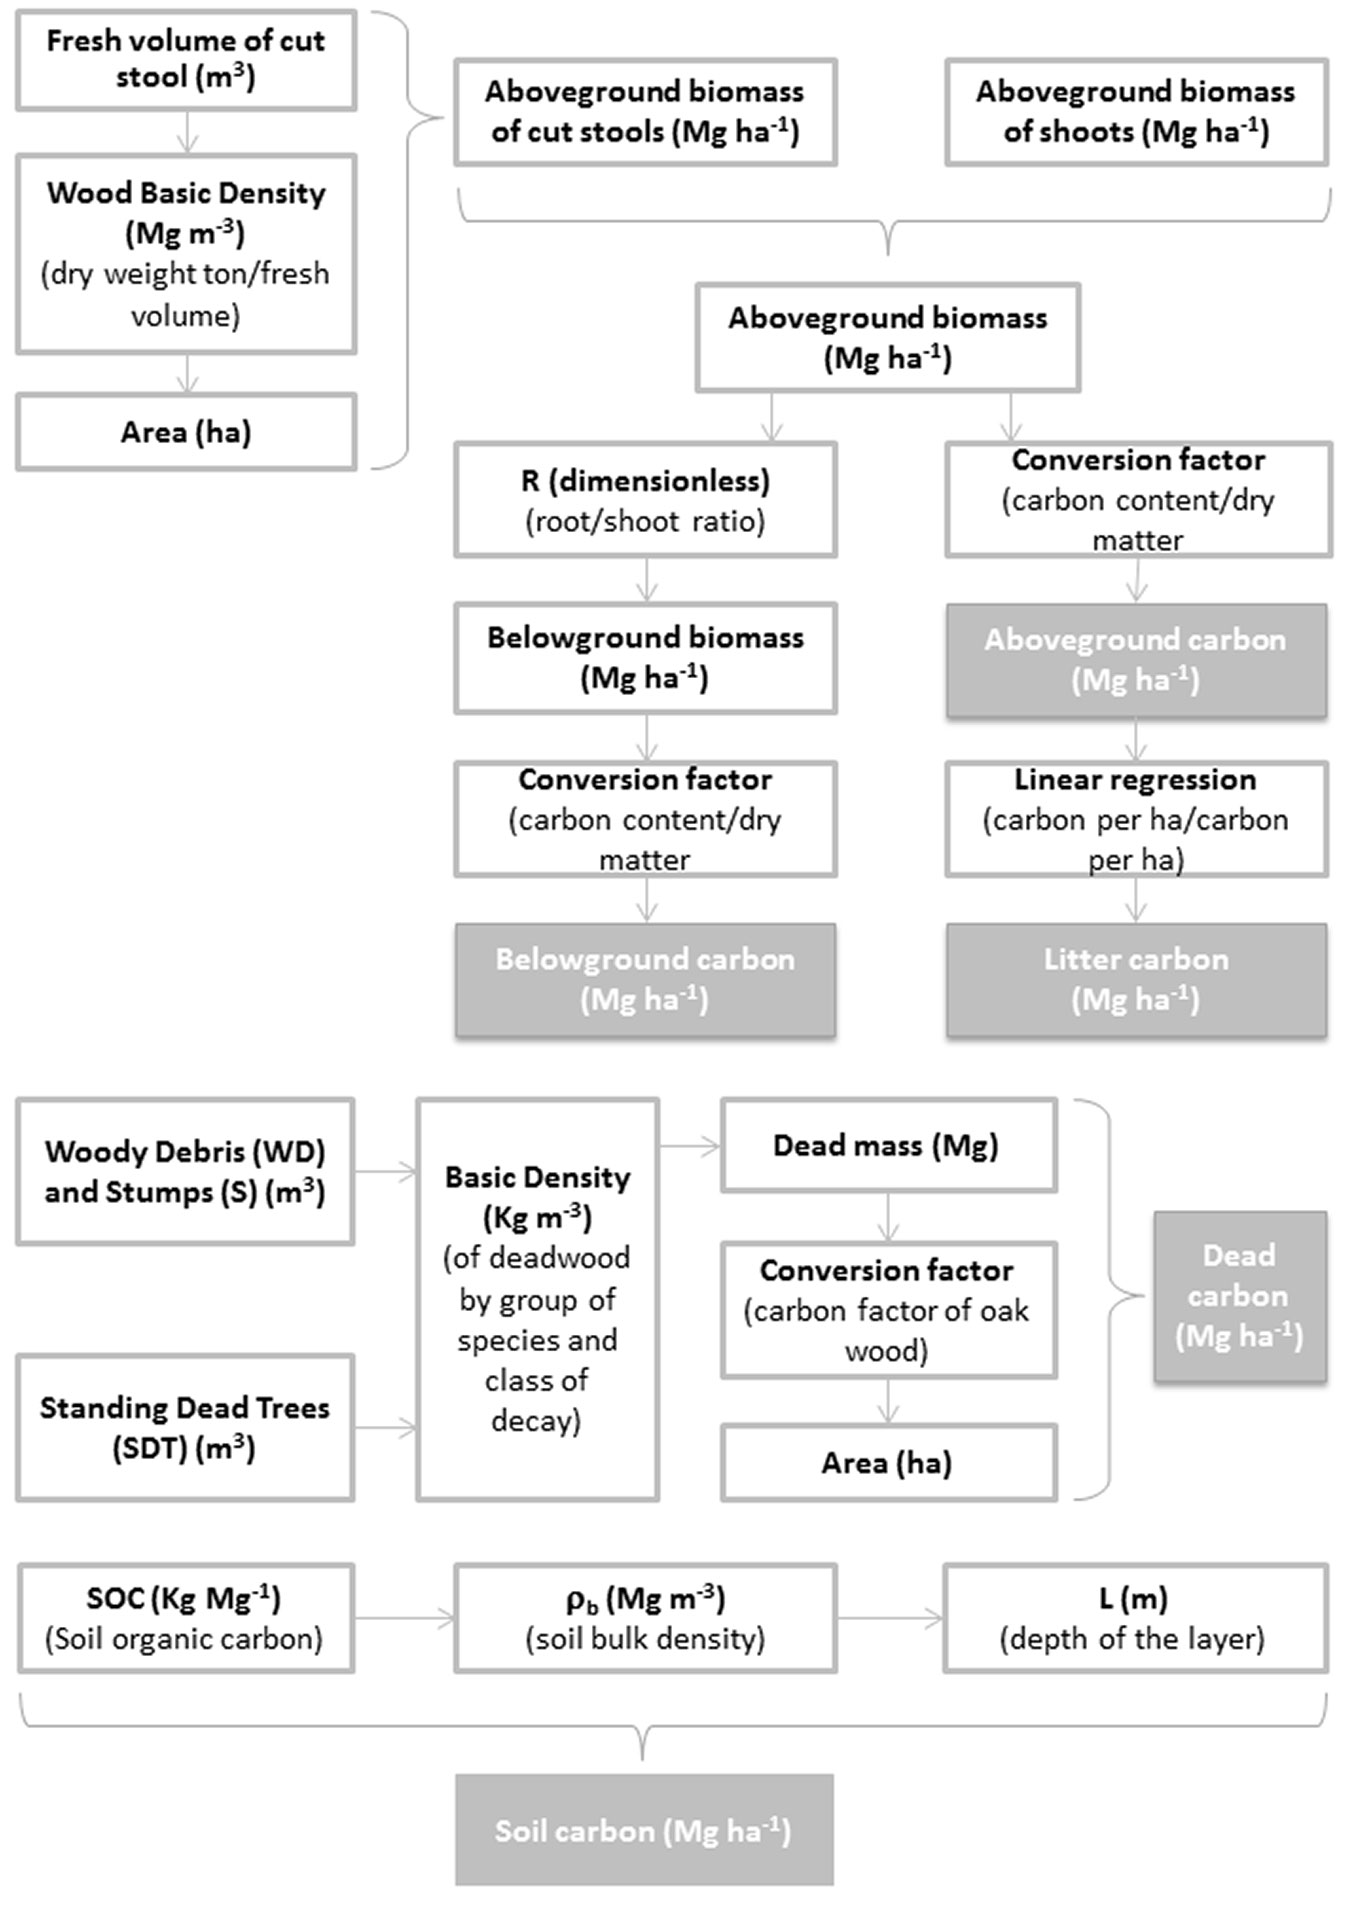
The biomass equations for holm oak, downy oak and manna ash developed by Tabacchi et al. ([45]) were used to estimate the dry weight of the aboveground biomass, ABVshoots (Mg ha-1), using the tree Dbh and the H of the shoots. In the recently cut A1 (in 2013) and A2 (2009) plots, the aboveground biomass (ABV) of cut stools was also estimated as follows (eqn. 1):
where V (m3) is the fresh volume of the cut stool, WBD (Mg m-3) is the wood basic density to convert the fresh volume to dry weight for each forest typology ([17]), and A (ha) is the area of the subplot. The fresh volume of the cut stools was calculated assuming a cylindrical shape for the cut stool as follows (eqn. 2):
where d (in m) is the average diameter of the cut section taking into account two perpendicular measures, and h (in m) is the height of the stool.
The aboveground biomass per unit area (Mg ha-1) was defined as the sum of the aboveground biomass of the shoots and the aboveground biomass of the cut stools. A 0.5 carbon fraction to dry matter conversion factor ([16]) was applied to obtain the aboveground carbon, Cabv (Mg ha-1), from the biomass.
The belowground biomass was estimated by applying a standard root/shoot ratio (dimensionless) for each forest typology to the aboveground biomass ([17]). In particular, we chose to use a coefficient equal to: (i) 1 for evergreen oak (i.e., holm oak); (ii) 0.2 for other oaks (i.e., downy oak); and (iii) 0.24 for other broadleaved species (i.e., manna ash). Additionally, the carbon fraction of dry matter conversion factor ([16]), which is equal to 0.5, was applied to obtain the belowground carbon, Cblw (Mg ha-1), from the biomass, but because these stands were managed as coppice, the belowground biomass, calculated for the 40-year-old stand, is assumed to remain constant after each cutting when shoot production begins.
Litter carbon, Clitter (Mg ha-1), was estimated from the amount of carbon in the aboveground biomass based on linear relationships between the stand biomass and litter for each forest typology; this approach has been used in many forest studies ([48], [11]). We applied the following relationship for evergreen oak coppices (eqn. 3):
where x is the aboveground carbon (Mg ha-1), and y is the litter carbon (Mg ha-1). Thus, it is assumed that the litter carbon is at least equal to 9.366 Mg ha-1 with no aboveground carbon.
Dead mass in the form of woody debris (WD), standing dead trees (SDT) and stumps (S) was estimated by recording all of the dead material in the subplots. In the case of WD and S, volume (m3) was calculated using the following relationship (eqn. 4):
where D (in m) is the maximum diameter, d (in m) is the minimum diameter, and L (in m) is the length/height of the dead material.
In the case of SDT, volume (V, in m3) was calculated using the standard biometric equation ([4] - eqn. 5):
where G (in m2) is the basal area, h (in m) is the height obtained from the hypsometric curve; and f is a standard stem form factor equal to 0.5.
To estimate the deadwood carbon stock, the volume (in m3) of each subplot was converted to dead mass (Mg) using the appropriate basic density (kg m-3) value for each deadwood category (broadleaves, in our case) and decay class ([9], [30]). Therefore, the dead mass was converted to deadwood carbon per unit area, Cdead (Mg ha-1), by applying an oak wood carbon factor equal to 0.4895 that was obtained by direct analysis ([22]).
The soil carbon stock per unit area, Csoil (Mg ha-1), was calculated using the following relationship (eqn. 6):
where SOC (kg Mg-1) is the soil organic carbon content, ρb (Mg m-3) is the soil bulk density, L (m) is the depth of the sampled layer, and the ratio 10000/1000 expresses Csoil in Mg ha-1.
Data analysis
Spearman’s correlation analysis was used to individuate the correlation between the species diversity index (SH index) and the stand structure indices (W and VE index). Differences in the carbon pools among plots were analyzed with Kruskal-Wallis one-way analysis of variance on ranks. If any significant differences were detected, a post-hoc Tukey’s Honestly Significant Difference (THSD) test was applied to the pairwise comparisons, and Dunn’s Method was applied for post-hoc pairwise multiple comparisons in the case of unequal treatment group sizes. For the basic soil properties considered in this investigation (cl, si, sa, θi, ρb, SOC), each dataset was summarized by calculating the arithmetic mean, ma, and the associated coefficient of variation, CV. The four plots were compared in terms of the basic soil properties (cl, si, sa, θi, ρb, SOC) using THSD test. The significance level for all tests was α=0.05.
Results and discussion
Dendrometric and structural aspects
For each forest plot, the values of all measured and derived stand parameters are reported in Tab. 1. Moving from plot A1 to plot A4, the complexity and closure of the forest stands increased with the age of the stems (shoots) since the last coppice felling (see Tab. S1 in the Supplementary material). For example, the crown cover index progressively increased from 34% in plot A1 to 97% in plot A4; similarly, the basal area (G) and the volume (V) of all shoots increased from A1 to A4 (Tab. 1). Conversely, the stool density decreased from the A1 to A4 plots, which can be explained by normal competition among plants for space and light over time.
Tab. 1 - Main dendrometric characteristics of the four investigated plots. (Dm): Mean diameter; (Hm): mean tree height; (G): basal area; (V): volume.
| Plot | Species | Crown cover (%) |
Stools (n ha-1) |
Shoots (n ha-1) |
Dm (cm) |
Hm (m) |
G (m2 ha-1) |
V (m3 ha-1) |
|---|---|---|---|---|---|---|---|---|
| A1- Age 1 | Holm oak | - | 1200.0 | 55.7 | 14.9 | 10.2 | 1.0 | 4.9 |
| Downy oak | - | 380.0 | 71.6 | 25.7 | 11.7 | 3.7 | 24.5 | |
| Manna ash | - | 999.6 | 79.6 | 13.9 | 10.4 | 1.2 | 6.4 | |
| Total | 34 | 2579.6 | 206.9 | - | - | 5.9 | 35.9 | |
| A2- Age 6 | Holm oak | - | 1066.0 | 87.5 | 20.5 | 12.9 | 2.9 | 16.2 |
| Downy oak | - | 238.0 | 95.5 | 34.5 | 13.5 | 8.9 | 70.6 | |
| Manna ash | - | 999.6 | 39.8 | 15.3 | 12.2 | 0.7 | 4.7 | |
| Total | 74 | 2303.6 | 222.8 | - | - | 12.6 | 91.5 | |
| A3- Age 20 | Holm oak | - | 1209.6 | 3199.0 | 8.6 | 7.5 | 18.6 | 66.5 |
| Downy oak | - | 95.5 | 262.6 | 17.0 | 8.2 | 6.0 | 28.6 | |
| Manna ash | - | 1050.4 | 1957.6 | 7.1 | 6.8 | 7.7 | 26.3 | |
| Total | 94 | 2355.5 | 5419.2 | - | - | 32.3 | 121.4 | |
| A4- Age 40 | Holm oak | - | 1496.1 | 2840.9 | 12.2 | 10.4 | 33.3 | 180.4 |
| Downy oak | - | 286.5 | 262.6 | 25.4 | 13.7 | 13.3 | 110.1 | |
| Total | 97 | 1782.5 | 3103.5 | - | - | 46.6 | 290.5 |
In the recently cut A1 (2013) and A2 (2009) plots, the percentages of natural regeneration with height < 130 cm were 100% (41.322 shoot ha-1) and 67% (21.916 shoot ha-1), respectively, and the corresponding percentages of sprout origin regeneration were 86% (35.447 shoot ha-1) in plot A1 and 90% (29.583 shoot ha-1) in plot A2 (Tab. S3 in the Supplementary material). In plots A3 and A4, the natural regeneration with height < 130 cm was less than in the other plots (A1 and A2) and equal to 90% (5.000 shoot ha-1) and 97% (7.750 shoot ha-1), respectively. In both plots, the natural regeneration was sprout origin (Tab. S3). Considering (i) that manna ash is a light-demanding species and (ii) that there is a higher density of sprout origin regeneration in more recently disturbed plots (A1 and A2), the lower abundance of standards in A3 (63.7 plants ha-1) and A4 (127.3 plants ha-1) suggests a tree-cutting effect; the openness of the canopy and light should have positively influenced seed germination and early seedling development.
The values of all structural indices calculated for each forest plot are reported in Tab. S4 (Supplementary material). Generally, all stands showed low species diversity, but the Shannon index values were higher in plots A1, A2 and A3, as three species (holm oak, downy oak and manna ash) were detected in the tree layers; contrastingly, only two species were found (holm oak and downy oak) in plot A4. Holm oak was dominant in all stands. Forest stands A1 and A2 were characterized by a clumped tree distribution with W index values equal to 0.71 and 0.83, respectively, whereas stands A3 and A4 were characterized by randomly distributed trees with W index values equal to 0.63 and 0.46. The vertical distribution of crowns obtained by TSTRAT consisted of three strata for the A2, A3 and A4 forest stands, which were characterized by VE values greater than 0.8, and two strata for the more recently cut stand (A1) with a VE value of 0.37. Except for the latter stand, the distribution of crowns into the strata was uniform since the crowns of all trees were within the vertical strata. There were no significant correlations (p>0.05) between any pair of indices (SH, W and VE).
Soil properties
The A1, A2, A3 and A4 forest plots were established very close together, no further than 600 meters apart which assured the pedological uniformity of the site; thus, the mean steepness values were very similar, varying from 48% (for A4) to 59% (for A3 - Tab. 2). Therefore, stand age represented the main factor that differed among these plots. Plots A3 and A4 did not differ significantly in terms of any basic soil property (Tab. 2), suggesting that the possible effects of soil alteration due to tree cutting did not last for more than 20 years.
Tab. 2 - Summary statistics of the basic soil properties for each forest stand. (Ns): sample size; (CV): coefficient of variation; (ρb): dry soil bulk density; (SOC): soil organic carbon. For a given variable, means followed by the same letter are not significantly different (p>0.05) according to Tukey’s Honestly Significant Difference test.
| Variable | Statistic | A1 | A2 | A3 | A4 |
|---|---|---|---|---|---|
| Slope (%) | Mean | 56.6 | 55.3 | 59.3 | 48.2 |
| Clay (%) | Ns | 10 | 10 | 10 | 10 |
| Mean | 17.2 ab | 14.9 a | 22.0 b | 21.2 b | |
| CV (%) | 23.0 | 41.9 | 8.2 | 14.2 | |
| Silt (%) | Ns | 10 | 10 | 10 | 10 |
| Mean | 37.5 a | 35.2 a | 34.5 a | 37.5 a | |
| CV (%) | 15.3 | 12.9 | 5.8 | 8.7 | |
| Sand (%) | Ns | 10 | 10 | 10 | 10 |
| Mean | 45.3 ab | 49.9 a | 43.4 b | 41.2 b | |
| CV (%) | 10.7 | 7.2 | 5.1 | 8.9 | |
| ρb (Mg m-3) | Ns | 20 | 20 | 20 | 20 |
| Mean | 0.914 a | 0.892 a | 0.863 a | 0.785 a | |
| CV (%) | 24.5 | 15.8 | 20.0 | 24.4 | |
| SOC (kg Mg-1) | Ns | 7 | 7 | 7 | 7 |
| Mean | 77.4 a | 76.1 a | 97.8 a | 102.7 a | |
| CV (%) | 24.3 | 20.9 | 26.6 | 28.0 |
A coppicing effect was detectable when the less disturbed plots (A3 and A4) were compared with more recently disturbed plots (A1 and A2). The soil in the latter plots was denser and had less organic carbon than in the former, but the effects of coppicing on ρb and SOC were statistically negligible. However, the plot disturbed 6 years ago (A2) had significantly more sand and less clay than the less disturbed plots (A3 and A4), and similar result was detected in the more recently disturbed plot (A1), although the differences were smaller and not significant. Accounting for the close proximity of the four stands, in particular plots A1 and A3, differences in soil texture likely resulted from coppicing. The soil in plot A2 remained exposed to the direct action of rainfall the longest, and it was also affected by some loss or weakening of stabilizing agents since the re-establishment of plant cover was rapid but not immediate (i.e., a couple of years). Therefore, the conditions in this plot particularly favored soil erosion and likely facilitated the removal of fine and easily transportable soil particles. The data collected in plot A1 were consistent with this interpretation since they suggested that the above-described phenomena began soon after coppicing.
Carbon storage
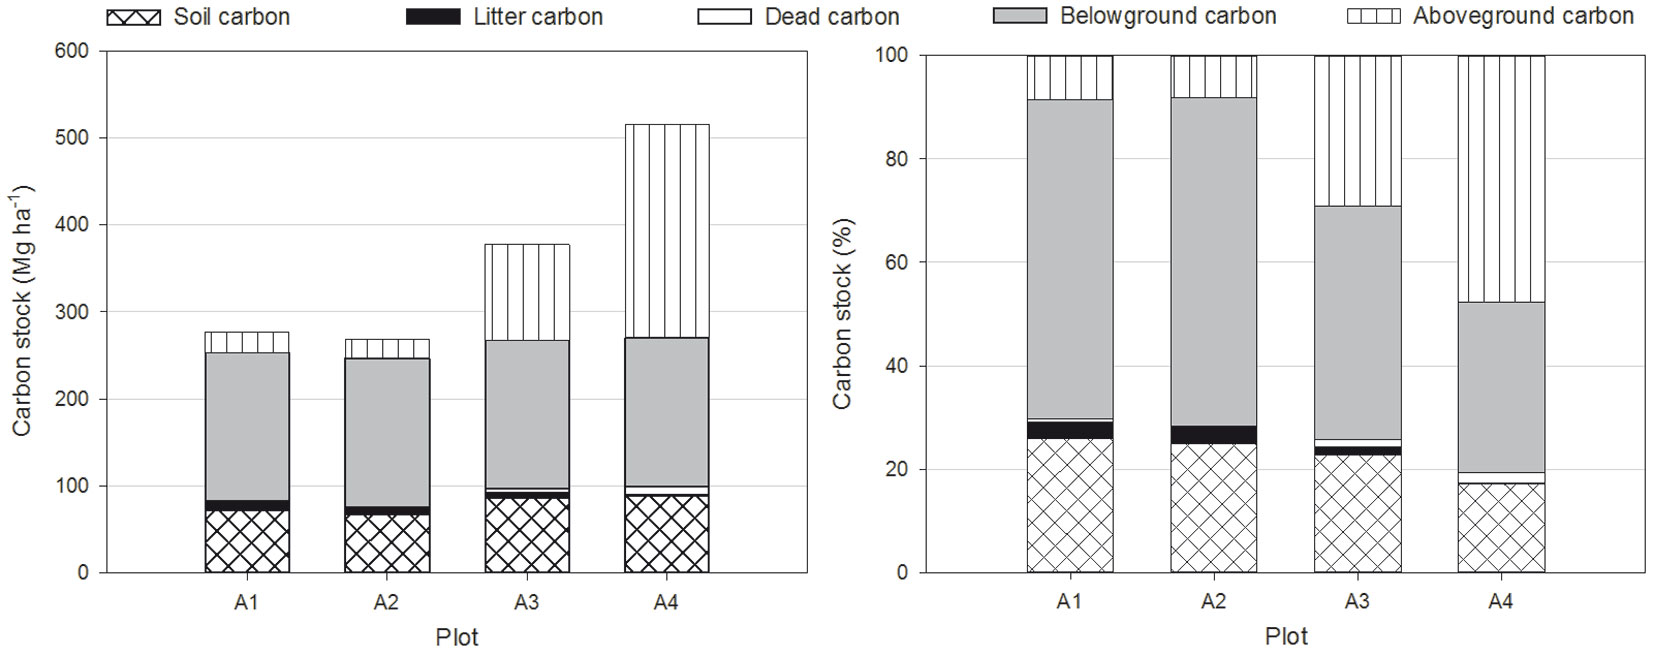
The aboveground carbon (Cabv) was higher in the older coppices (109.82 Mg ha-1 in A3 and 245.67 Mg ha-1 in A4) than in the recently cut plots (23.87 Mg ha-1 in A1 and 22.00 Mg ha-1 in A2) with significant differences between the plots, except for A1 and A2 (Tab. 3). The belowground carbon (Cblw) was 170.93 Mg ha-1 in plot A4 and was assumed to have remained constant over time. The litter carbon (Clitter) decreased from the recently cut plots (8.65 Mg ha-1 in A1 and 8.71 Mg ha-1 in A2) to the older coppices (6.08 Mg ha-1 in A3 and 2.02 Mg ha-1 in A4) with significant differences between the plots except for A1 and A2 (Tab. 3). The recently cut plots (A1 and A2) had low levels of carbon stored in the deadwood (Cdead), 1.61 Mg ha-1 in A1 and 0.06 Mg ha-1 in A2, with no significant differences between the two plots. In contrast, Cdead was higher in the older coppices (4.89 Mg ha-1 in A3 and 9.56 Mg ha-1 in A4) with no significant differences between the plots, but there were significant differences between plot A4 and the recently cut plots (A1 and A2 - Tab. 3). Soil carbon stock (Csoil) varied from 67.25 to 87.90 Mg ha-1 (Tab. 4). The lowest values for Csoil were observed in the stands with the lowest stand density with no significant differences between the four plot (Tab. 4). The total carbon stocks (Cstock) in plots A1, A2, A3 and A4 were 276.89 Mg ha-1, 268.95 Mg ha-1, 377.61 Mg ha-1 and 516.08 Mg ha-1, respectively (Fig. 2), and there were no statistically significant differences among the plots (Tab. 4). Cstock values of the studied stands were higher than those found for stands of other species under similar climatic conditions and sampling methods in Mediterranean forests, such as values of 86.5-159.5 Mg ha-1 reported by Oubrahim et al. ([28]) for Quercus suber L. stands in Morocco, 234.4-317.3 Mg ha-1 observed by Ruiz-Peinado et al. ([37]) for a reforestation of Pinus pinaster Ait. in degraded open woodlands of Quercus faginea Lamk. and Q. suber L. in Spain, and 197.1-276.8 Mg ha-1 recorded by Ruiz-Peinado et al. ([38]) for a reforestation of Pinus sylvestris L. established on natural forests of Quercus pyrenaica Willd. in Spain. The most important carbon pool identified in the studied stands was living biomass (70.4-80.7%) which included above and belowground carbon (Fig. 2). The next largest was the carbon soil pool (top 10 cm in our case) which accounted for 17.0-25.9% according to the stands. Finally, the remaining carbon being withheld in dead wood and litter (Fig. 2). Soils from the Mediterranean broadleaved forests are relatively poor in carbon; our results, therefore, fall well within the range of other observations ([10], [37], [25], [28], [38]). The results revealed an effect of coppicing on carbon storage in the living and dead biomass; except for litter carbon, the lowest carbon storage values were observed in the plots with the lowest stand density (A1 and A2), and basal area was explained by coppicing. In terms of soil carbon, coppicing caused an almost immediate loss of carbon, i.e., plot A2, which was followed by a slow recovery of the carbon pool over time as exhibited by the older coppices in plots A3 and A4 (Tab. 4). The Csoil value measured in the more recently disturbed plot A1 was consistent with this interpretation, since it is conceivable that these phenomena begin a few years after coppicing, but there were no statistically significant differences in soil carbon among the plots (Tab. 4). These results agree with those of other studies ([32], [37], [38]), which, on average, report little effect of harvesting on soil carbon, but this depends on the type of harvest.
Tab. 3 - Carbon stocks in the living and dead biomass of each forest stand. For a given carbon pool, values followed by the same letter are not significantly different (p>0.05) according to Tukey’s Honestly Significant Difference test.
| Plot | Living biomass | Dead biomass | ||
|---|---|---|---|---|
| Cabv (Mg ha-1) | Cblw (Mg ha-1) | Clitter (Mg ha-1) | Cdead (Mg ha-1) | |
| A1 | 23.87 a | 170.93 | 8.65 a | 1.61 a |
| A2 | 22.00 a | 170.93 | 8.71 a | 0.06 a |
| A3 | 109.82 b | 170.93 | 6.08 b | 4.89 ab |
| A4 | 245.67 c | 170.93 | 2.02 c | 9.56 b |
Tab. 4 - Soil carbon stocks (Csoil, Mg ha-1) and total carbon stock (Cstock, Mg ha-1) of each forest stand (± standard error). For a given carbon pool, means followed by the same letter are not significantly different (p>0.05) according to Tukey’s Honestly Significant Difference test.
| Plot | Csoil (Mg ha-1) | Cstock (Mg ha-1) |
|---|---|---|
| A1 | 71.83 ± 9.54 * a | 276.89 ± 31.37 * a |
| A2 | 67.25 ± 4.86 a | 268.95 ± 31.49 a |
| A3 | 85.89 ± 14.56 a | 377.61 ± 31.77 a |
| A4 | 87.90 ± 11.66 a | 516.08 ± 46.97 a |
Fig. 2 - Estimation of carbon stocks in the five carbon pools for each investigated plot.
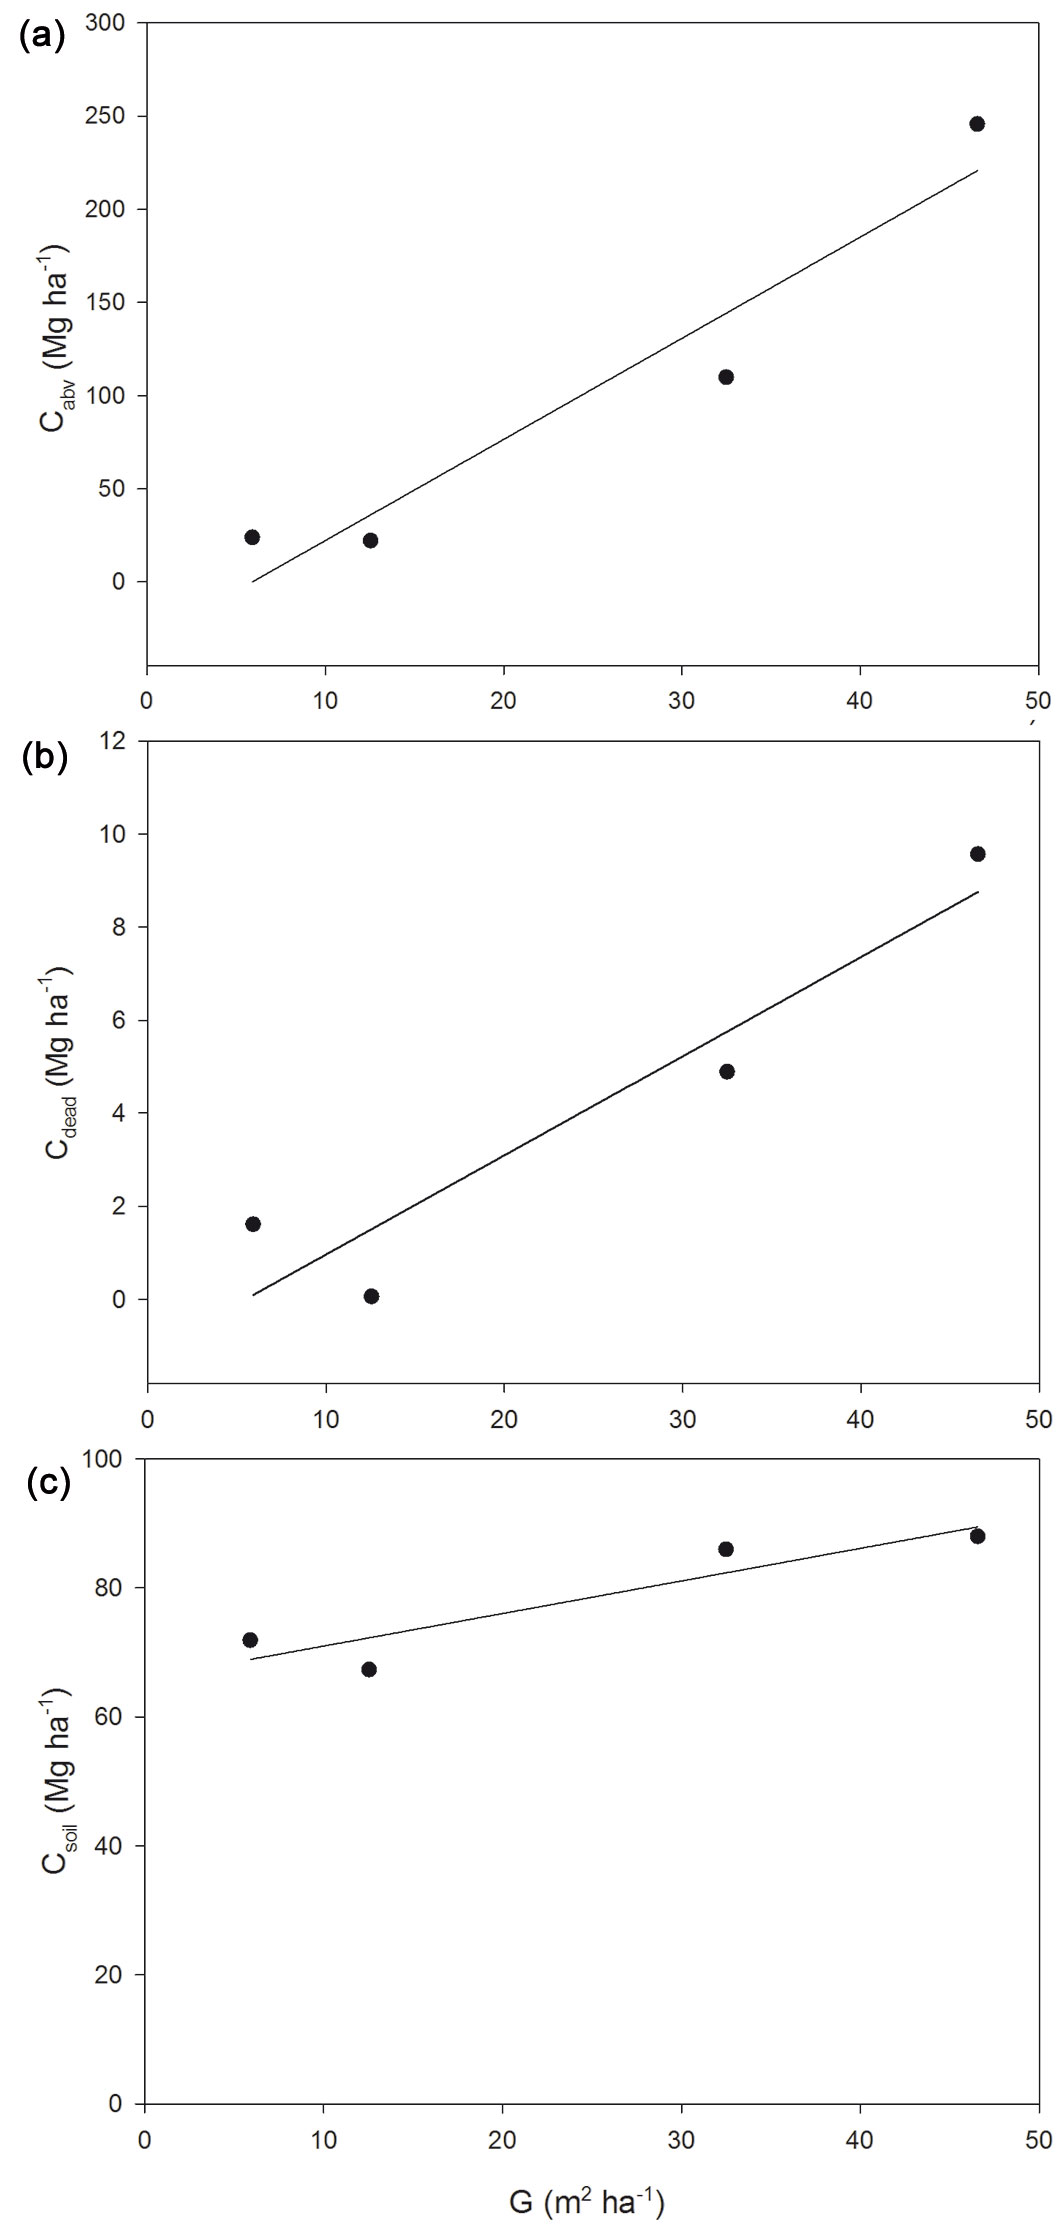
Taking into account the relationships between carbon stocks and the five dendrometric parameters (crown cover, number of stools, number of shoots, basal area and volume), the most appropriate parameter to describe the changes in the values of the carbon stocks among the four forest stands was basal area, G (m2 ha-1), since there were statistically significant relationships between this factor and the three carbon pools (aboveground carbon, dead carbon and soil carbon). In particular, Cabv, Cdead and Csoil significantly linearly increased with G (Fig. 3a, Fig. 3b, Fig. 3c). In all case, the correlations were very strong (R2 equal to 0.922, 0.890 and 0.845, respectively). The positive relationship found between Csoil and G has already been reported in the Mediterranean area ([28]). Therefore, these relationships, despite being obtained for a small number of plots in this study, could be applied under similar forest conditions (i.e., stand development, climate, topography, soil properties) to estimate carbon storage in the aboveground, dead and soil pools of holm oak coppice stands.
Fig. 3 - Relationships between basal area (G, m2 ha-1) and: (a) aboveground carbon (Cabv, Mg ha-1); (b) dead carbon (Cdead, Mg ha-1); and (c) soil carbon (Csoil, Mg ha-1).
Conclusions
This study examined managed holm oak stands that had been regularly coppiced under a 40-year rotation in the Madonie Mountains of Sicily. This case study is particularly significant given that, contrary to most Sicilian stands, few holm oak coppices are managed and the reconstruction of historical management in most cases is practically impossible. The trends in the dendrometric parameters and silvicultural indices of the stands immediately after cutting and during and at the end of the rotation period were typical of coppices, i.e., they were characterized by poor compositional and structural diversity with very limited diversification in the older stands.
A complete analysis of five carbon pools has been carried out. Living biomass was the main carbon pool, and, on average, no significant differences were found in terms of total carbon stock and soil carbon of each investigated forest stand. However, we observed an effect of coppicing on carbon storage in the living and dead biomass. Except for litter carbon, the lowest living biomass values were observed in the plots in the early stages of development after coppicing. The results of this study revealed that coppicing does not affect the carbon balance, endorsing the sustainability of this kind of management, at least from a four decades perspective, and from the point of view of total carbon stocks and the carbon stored in the soil. The limited number of investigated plot does not allow to draw conclusions of general validity on the relationship between basal area and three carbon pools (aboveground carbon, dead carbon and soil carbon) in the Mediterranean area. However, the data obtained in the present study improve understanding of the effects of coppicing on carbon storage in a Mediterranean holm oak stand. A long-term monitoring of the investigated stands, as well as the characterization of other managed coppices in Sicily and in the Mediterranean area would be useful for the development of an international database on the effects of coppice management on carbon storage.
List of abbreviations
The following abbreviations have been used throughout the paper:
- WD: woody debris
- SDT: standing dead trees
- S: stumps
- SVS: standing visualization system
- SH: Shannon index
- W: Winkelmass index
- VE: vertical evenness
- ABV: aboveground biomass
- WBD: wood basic density
- SOC: soil organic carbon
- THSD: Tukey’s honestly significant difference
Acknowledgments
This work is part of the research project “Development of innovative models for multiscale monitoring of ecosystem services indicators in Mediterranean forests (MiMoSe)” funded by the FIRB2012 program of the Italian Ministry of Universities and Research (Project coordinator: Lombardi F; Grant: RBFR121TWX_004). Thanks to Giovanni Gugliuzza for his availability, as owner of the study area.
SS, FGM and DSLMV performed the forest sampling and data elaboration. MI, GB and VP ivestigated soil characteristics. All authors contributed to the analysis of the results and to paper writing.
This work is dedicated to the memory of Sebastiano Cullotta, who led the Palermo Research Unit with great proficiency and humaneness.
References
Gscholar
CrossRef | Gscholar
CrossRef | Gscholar
Online | Gscholar
Gscholar
Gscholar
Gscholar
Gscholar
Gscholar
Gscholar
Gscholar
CrossRef | Gscholar
CrossRef | Gscholar
Gscholar
CrossRef | Gscholar
Gscholar
Gscholar
Gscholar
Authors’ Info
Authors’ Affiliation
Federico Guglielmo Maetzke
Massimo Iovino
Giorgio Baiamonte
Vincenzo Palmeri
Donato Salvatore La Mela Veca
Dipartimento Scienze Agrarie, Alimentari e Forestali, Università degli Studi di Palermo, v.le delle Scienze, 90128 Palermo (Italy)
Corresponding author
Paper Info
Citation
Sferlazza S, Maetzke FG, Iovino M, Baiamonte G, Palmeri V, La Mela Veca DS (2018). Effects of traditional forest management on carbon storage in a Mediterranean holm oak (Quercus ilex L.) coppice. iForest 11: 344-351. - doi: 10.3832/ifor2424-011
Academic Editor
Piermaria Corona
Paper history
Received: Mar 10, 2017
Accepted: Jan 28, 2018
First online: Apr 18, 2018
Publication Date: Apr 30, 2018
Publication Time: 2.67 months
Copyright Information
© SISEF - The Italian Society of Silviculture and Forest Ecology 2018
Open Access
This article is distributed under the terms of the Creative Commons Attribution-Non Commercial 4.0 International (https://creativecommons.org/licenses/by-nc/4.0/), which permits unrestricted use, distribution, and reproduction in any medium, provided you give appropriate credit to the original author(s) and the source, provide a link to the Creative Commons license, and indicate if changes were made.

Web Metrics
Breakdown by View Type
Article Usage
Total Article Views: 50784
(from publication date up to now)
Breakdown by View Type
HTML Page Views: 41129
Abstract Page Views: 4604
PDF Downloads: 3927
Citation/Reference Downloads: 16
XML Downloads: 1108
Web Metrics
Days since publication: 2992
Overall contacts: 50784
Avg. contacts per week: 118.81
Article Citations
Article citations are based on data periodically collected from the Clarivate Web of Science web site
(last update: Mar 2025)
Total number of cites (since 2018): 11
Average cites per year: 1.38
Publication Metrics
by Dimensions ©
Articles citing this article
List of the papers citing this article based on CrossRef Cited-by.
Related Contents
iForest Similar Articles
Research Articles
Carbon storage in degraded cork oak (Quercus suber) forests on flat lowlands in Morocco
vol. 9, pp. 125-137 (online: 08 August 2015)
Research Articles
Carbon stock in Kolli forests, Eastern Ghats (India) with emphasis on aboveground biomass, litter, woody debris and soils
vol. 4, pp. 61-65 (online: 05 April 2011)
Research Articles
Patterns of carbon allocation in a chronosequence of Caragana intermedia plantations in the Qinghai-Tibet Plateau
vol. 8, pp. 756-764 (online: 08 April 2015)
Research Articles
Soil stoichiometry modulates effects of shrub encroachment on soil carbon concentration and stock in a subalpine grassland
vol. 13, pp. 65-72 (online: 07 February 2020)
Review Papers
Comparative assessment for biogenic carbon accounting methods in carbon footprint of products: a review study for construction materials based on forest products
vol. 10, pp. 815-823 (online: 25 September 2017)
Research Articles
Impact of thinning on carbon storage of dead organic matter across larch and oak stands in South Korea
vol. 9, pp. 593-598 (online: 01 March 2016)
Research Articles
Soil C:N stoichiometry controls carbon sink partitioning between above-ground tree biomass and soil organic matter in high fertility forests
vol. 8, pp. 195-206 (online: 26 August 2014)
Research Articles
Estimating carbon dynamics in forest carbon pools under IPCC standards in South Korea using CBM-CFS3
vol. 10, pp. 83-92 (online: 13 October 2016)
Research Articles
Potential relationships of selected abiotic variables, chemical elements and stand characteristics with soil organic carbon in spruce and beech stands
vol. 14, pp. 320-328 (online: 09 July 2021)
Research Articles
Modeling aboveground carbon in flooded forests using synthetic aperture radar data: a case study from a natural reserve in Turkish Thrace
vol. 17, pp. 277-285 (online: 27 September 2024)
iForest Database Search
Search By Author
Search By Keyword
Google Scholar Search
Citing Articles
Search By Author
Search By Keywords
PubMed Search
Search By Author
Search By Keyword


