Ensemble modeling of Pinus cembroides Zucc. distribution under future CMIP6 climate scenarios in northern Mexico
iForest - Biogeosciences and Forestry, Volume 19, Issue 1, Pages 1-8 (2026)
doi: https://doi.org/10.3832/ifor4880-018
Published: Jan 10, 2026 - Copyright © 2026 SISEF
Research Articles
Abstract
This study employed ensemble species distribution models (SDMs) using the “biomod2” package and different General Circulation Models (GCMs) to assess the impacts of climate change on the potential distribution of Pinus cembroides in Mexico. Using presence and pseudo-absence data, along with bioclimatic variables from CHELSA v2.1, future habitat suitability was projected for the near future (2041-2060) and far future (2061-2080) under two CMIP6 scenarios (SSP245 and SSP585). Our results predict that under future climate conditions, P. cembroides will likely undergo substantial range contractions, with losses of approximately 65%-85% of the current suitable habitat and no colonization of novel areas. Temperature-related predictors, particularly Bio8 (mean temperature of the wettest quarter) and Bio9 (mean temperature of the driest quarter) were identified as the primary drivers of the species’ distribution. These results suggest that under warming scenarios, P. cembroides will be confined to high elevation refugia, thereby increasing fragmentation and reducing its adaptive capacity. Overall, our findings provide a critical baseline for adaptive forest management strategies, such as assisted migration and the conservation of high elevation refugia, to mitigate the impacts of climate change on P. cembroides.
Keywords
Biomod2, CHELSA, CMIP6, Pinus cembroides, Potential Distribution
Introduction
Climate change is altering forest ecosystems by modifying temperature and precipitation regimes ([38]). Consequently, species are migrating to higher latitudes and elevations to find suitable climatic conditions ([48]). Moreover, more frequent droughts, wildfires, and pest outbreaks are driving widespread tree mortality and ecosystem degradation, thereby threatening biodiversity and key ecosystem services, including carbon sequestration and water regulation ([6], [30]). Thus, forecasting species’ responses to climate-driven changes is essential for ecologists and land managers ([9]).
Mexico is particularly vulnerable to these climatic alterations. Mean annual temperatures have increased by approximately 0.7 °C over the past 50 years, accompanied by increased precipitation variability ([13], [46]). Projections under high-emissions scenarios indicate an additional warming of up to 4.5 °C by 2100, and a decline in soil moisture ([5]). Such changes have already increased mortality rates and suppressed radial growth in conifer forests at their xeric margins ([41]).
Pinus cembroides Zucc., commonly known as Mexican pinyon, occurs on dry, rocky soils throughout the Sierra Madre Oriental, Sierra Madre Occidental, and Trans-Mexican Volcanic Belt ([15], [43]). P. cembroides reaches up to 15 m in height and 30-70 cm in diameter ([33]). Nutrient limitations, particularly nitrogen and phosphorus, can restrict both root development and crown expansion in this species ([15]). Individual trees typically establish on mildly acidic substrates (mean pH: 5.3; H+ ≈ 25% of exchangeable cations) under warm xerophytic temperate climates, predominantly occupying ecotones between arid desert scrub and humid montane forests ([55]). Although P. cembroides exhibits exceptional drought tolerance, its distribution is primarily limited by temperature extremes during the wettest (Bio 8) and driest (Bio 9) quarters ([42]). Under future warming scenarios, models project range contractions exceeding 75%, confining populations to isolated high-elevation refugia and threatening genetic diversity and connectivity ([53]).
Species distribution models (SDMs) correlate species occurrences with environmental predictors, such as temperature, precipitation, and elevation, to estimate current habitat suitability and forecast future range shifts ([18], [26]). Algorithms include parametric regression (generalized linear models, generalized additive models), machine-learning methods (random forests, boosted regression trees, artificial neural networks), presence-only techniques (MaxEnt, surface range envelopes), and mechanistic models integrating species-specific physiology. These methods have been successfully applied to diverse taxa, including conifers in Mexico ([57], [25]), and provide critical projections to inform adaptive forest management, such as assisted migration and conservation of high-elevation refugia, to mitigate climate change impacts ([10]).
However, each SDM entails uncertainties arising from the methodology, data quality, and assumptions underlying future climate scenarios ([8]). To address these challenges, ensemble modeling approaches integrate predictions from multiple SDMs and general circulation models (GCMs), thereby enhancing the robustness of projections and reducing uncertainty ([60], [62]).
In this study, we assessed the impacts of climate change on the distribution of P. cembroides in Mexico. We first identified the key climatic drivers of its current range, and then projected habitat suitability under two climate scenarios (SSP245 and SSP585) for the periods 2041-2060 and 2061-2080 using an ensemble modeling framework. Finally, we mapped areas of habitat loss, stability, and potential gain. Employing multiple algorithms reduces model uncertainty and increases confidence in future suitability predictions.
Methodology
Species presence records
Occurrence records for P. cembroides were obtained from the National Forest and Soil Inventory and the National Biodiversity Information System ([14]). Duplicate records were removed to match the spatial resolution of the climate data and prevent model overfitting. Overall, 1696 occurrence records were obtained.
Environmental data
We analyzed 19 bioclimatic variables representing current and future climate conditions to quantify changes in the potential distribution of P. cembroides. Climate layers were derived from CHELSA v. 2.1, which integrates surface observations, satellite data, and the ERA5 reanalysis at approximately 1-km spatial resolution. ([36]). To reduce multicollinearity, we retained predictors with VIF<10 ([35] - Tab. 1). We focused on climate drivers, since broad-scale temperature and precipitation gradients determine range limits. In contrast, static factors (e.g., soil, topography) cannot be projected under future scenarios ([63]). This climate-only framework isolates the effects of climate change on habitat suitability ([47]). We then projected suitability for 2041-2060 (near future) and 2061-2080 (far future) under the SSP2-4.5 and SSP5-8.5 scenarios ([20]) using the Python package “chelsa-cmip6” ver. 1.0 ([37]). To address GCM uncertainty, we generated a multi-model ensemble (MME) by comparing monthly temperature and precipitation outputs against CRU observations ([29]). We evaluated model performance using the normalized standard deviation, centered root-mean-square error, Taylor skill score, pattern correlation coefficient, and mean bias ([29], [23]). These metrics guided the selection of models that best capture regional climate variability ([39]).
Tab. 1 - The bioclimatic variables analyzed to quantify changes in the potential distribution of P. cembroides.
| Variable | Description |
|---|---|
| Bio 2 | Mean diurnal range |
| Bio 3 | Isothermality |
| Bio 7 | Temperature annual range |
| Bio 8 | Mean temperature of wettest quarter |
| Bio 9 | Mean temperature of driest quarter |
| Bio 12 | Annual precipitation |
| Bio 14 | Precipitation of driest month |
| Bio 18 | Precipitation of warmest quarter |
| Bio 19 | Precipitation of coldest quarter |
Ensemble modelling
We implemented ensemble distribution modeling in R using the “BIOMOD2” v. 4.2-2 package ([51]). We included nine correlative modeling algorithms: Generalized Linear Models (GLM - [44]), a parametric regression framework; Generalized Additive Models (GAM - [31]), which use spline-based smoothing; Generalized Boosted Models (GBM - [54]), a gradient-boosted ensemble of decision trees; Classification Tree Analysis (CTA - [11]), based on CART; Flexible Discriminant Analysis (FDA - [32]), discriminant analysis with nonparametric smoothing; Artificial Neural Networks (ANN - [52]), feed-forward neural networks; Maximum Entropy (MaxEnt - [50]), a presence-only maximum-entropy method; Random Forest (RF - [11]), a bootstrap-aggregated decision-tree ensemble; and, Surface Response Envelopes (SRE - [12]), a climatic-envelope model based on predictor ranges. Each model was trained on 75% of the data and evaluated on the remaining 25% ([50]). We generated 10.000 random pseudo-absences for each model using a random cross-validation strategy ([27]). Default algorithm parameters were used to minimize overfitting. To enhance robustness, each algorithm was run three times ([38]). We assessed performance using the area under the ROC curve (AUC, 0-1), partial AUC (pAUC, FPR ≤ 0.10), and True Skill Statistic (TSS, -1 to 1), retaining only models with TSS > 0.8 for ensemble integration ([21], [40], [35]). The AUC indicates relatively good to excellent model performance when values exceed 0.8 and 0.9, respectively ([21]). pAUC provides a firmer foundation for evaluating predictions from ecological niche models ([49]). TSS combines sensitivity (true positive rate) and specificity (true negative rate) to assess a model’s ability to predict presence and absence. The closer the TSS is to 1, the higher the prediction accuracy ([4]). Only models with TSS > 0.8 were retained for ensemble integration. Finally, we used BIOMOD_EnsembleModelling to generate two consensus projections: EMmean (unweighted mean) and TSS-weighted mean to reduce model-specific uncertainty ([34]).
Variable importance
To quantify the relative influence of each bioclimatic predictor on the distribution of P. cembroides, we employed the permutation-importance method ([17]). Each predictor was permuted in turn while holding all other variables constant; we then quantified the reduction in model predictions relative to the original output. We then corrected this reduction by accounting for the correlation between permuted and original predictions ([2]). Larger corrected reductions indicate greater variable importance, whereas a zero reduction denotes no contribution.
Spatial distribution
We computed the Habitat Suitability Index (HSI) for each model as the predicted probability of species occurrence. We derived the ensemble HSI by averaging predictions from the EMmean and EMwmean methods. We then normalized raw HSI values (0-1000) to a scale of 0-1. Suitability classes were defined as highly suitable (HIS ≥ 0.8), moderately suitable (0.6 ≤ HIS < 0.8), marginally suitable (0.4 ≤ HIS < 0.6), and unsuitable (HIS < 0.4 - [59]).
Results
Model evaluation
The final ensemble models EMmean and EMwmean achieved average AUC values of 0.948 and 0.949 across replicates (Tab. 2). During calibration, AUCs were 0.987 for EMmean and 0.999 for EMwmean. On independent validation data, AUCs were 0.954 and 0.955, with TSS of 0.775 and 0.777, demonstrating high predictive accuracy for P. cembroides. Among individual algorithms, MaxEnt achieved the highest TSS (0.780), followed by GLM (0.772) and GBM (0.758). RF showed the highest AUC (0.957), followed by MaxEnt (0.947). The SRE model performed least favorably (AUC = 0.762; TSS = 0.524), indicating limited discrimination between the presence and absence of the species. ANN (TSS = 0.740, AUC = 0.914) and CTA (TSS = 0.736, AUC = 0.882) demonstrated moderate performance. pAUC (FPR ≤ 0.10) for single algorithms ranged from 0.50 (SRE) to 0.99 (RF), with intermediate values for CTA (0.74), FDA (0.71), GLM (0.81), MaxEnt (0.84), ANN (0.75), GBM (0.81), and GAM (0.76). These results demonstrate that integrating multiple algorithms into an ensemble enhances the reliability of species distribution predictions.
Tab. 2 - Mean and standard deviation evaluation metrics by algorithm for P. cembroides: True Skill Statistic (TSS), Area Under the Curve (AUC), and partial AUC (pAUC).
| Algorithm | TSS mean | TSS std | AUC mean | AUC std | PAUC mean | PAUC std |
|---|---|---|---|---|---|---|
| ANN | 0.740 | 0.001 | 0.914 | 0.047 | 0.662 | 0.097 |
| CTA | 0.736 | 0.014 | 0.882 | 0.013 | 0.692 | 0.004 |
| FDA | 0.728 | 0.012 | 0.919 | 0.005 | 0.678 | 0.002 |
| GAM | 0.735 | 0.020 | 0.930 | 0.005 | 0.734 | 0.001 |
| GBM | 0.758 | 0.012 | 0.946 | 0.004 | 0.821 | 0.002 |
| GLM | 0.772 | 0.022 | 0.942 | 0.004 | 0.779 | 0.002 |
| MAXENT | 0.780 | 0.024 | 0.947 | 0.005 | 0.841 | 0.018 |
| RF | 0.711 | 0.034 | 0.957 | 0.003 | 0.924 | 0.091 |
| SRE | 0.524 | 0.004 | 0.762 | 0.005 | 0.500 | 0.000 |
| EMmean | 0.775 | 0.018 | 0.948 | 0.004 | 0.885 | 0.021 |
| EMwmean | 0.777 | 0.016 | 0.949 | 0.004 | 0.890 | 0.019 |
Variable importance
Tab. 3 summarizes the mean importance scores for nine bioclimatic predictors across the nine algorithms, revealing substantial variability. Temperature predictors were the most influential: Bio 8 (mean temperature of the wettest quarter) ranged from 0.181 in GBM to 0.474 in MaxEnt (ensemble = 0.321); Bio 9 (mean temperature of the driest quarter) varied from 0.280 in GBM to 0.738 in CTA (ensemble = 0.171); Bio 3 (isothermality) scored 0.700 in GLM (ensemble = 0.277); and Bio 7 (annual temperature range) peaked at 0.887 in GLM (ensemble = 0.340). In contrast, precipitation predictors showed lower importance: Bio 2 (mean diurnal range, ensemble = 0.201), Bio 12 (annual precipitation, 0.184), Bio 14 (precipitation of the driest month, 0.043), Bio 18 (precipitation of the warmest quarter, 0.026), and Bio 19 (precipitation of the coldest quarter, 0.045). These results confirm that seasonal temperature extremes and variability (Bio 3, Bio 7, Bio 8, and Bio 9) primarily determine the distribution of P. cembroides, whereas precipitation variables play a subordinate role.
Tab. 3 - Mean variable importance scores of the selected bioclimatic variables for each algorithm: Artificial Neural Networks (ANN), Classification Tree Analysis (CTA), Flexible Discriminant Analysis (FDA), Generalized Additive Model (GAM), Generalized Boosted Model (GBM), Generalized Linear Model (GLM), Maximum Entropy (MAXENT), Random Forest (RF), Surface Range Envelope (SRE).
| Variable | ANN | CTA | FDA | GAM | GBM | GLM | MAXENT | RF | SRE |
|---|---|---|---|---|---|---|---|---|---|
| Bio 2 | 0.335 | 0.000 | 0.205 | 0.238 | 0.000 | 0.520 | 0.042 | 0.045 | 0.039 |
| Bio 3 | 0.008 | 0.045 | 0.051 | 0.049 | 0.028 | 0.700 | 0.085 | 0.043 | 0.041 |
| Bio 7 | 0.000 | 0.000 | 0.177 | 0.163 | 0.000 | 0.887 | 0.088 | 0.132 | 0.081 |
| Bio 8 | 0.292 | 0.322 | 0.212 | 0.215 | 0.181 | 0.357 | 0.474 | 0.114 | 0.002 |
| Bio 9 | 0.713 | 0.738 | 0.614 | 0.495 | 0.280 | 0.287 | 0.111 | 0.072 | 0.063 |
| Bio 12 | 0.145 | 0.063 | 0.105 | 0.265 | 0.058 | 0.230 | 0.250 | 0.051 | 0.101 |
| Bio 14 | 0.134 | 0.000 | 0.001 | 0.066 | 0.005 | 0.053 | 0.024 | 0.044 | 0.043 |
| Bio 18 | 0.027 | 0.000 | 0.035 | 0.036 | 0.006 | 0.014 | 0.020 | 0.049 | 0.036 |
| Bio 19 | 0.041 | 0.000 | 0.023 | 0.004 | 0.004 | 0.052 | 0.033 | 0.041 | 0.062 |
Response curves
Seasonal temperature extremes (Bio 2, Bio 3, Bio 7, Bio 8, and Bio 9) primarily limit the suitability of P. cembroides. Suitability declines sharply for the mean temperature of the wettest quarter (Bio 8) and the driest quarter (Bio 9) above 20 °C. Still, it remains at or above 0.6 between 15 °C and 20 °C (Fig. 1). We also observed moderate effects of isothermality (Bio 3) and annual temperature range (Bio 7), with suitability falling once Bio 7 exceeds roughly 25-30 °C.
Fig. 1 - Response curve of the EMwmean for Bio 12 (annual precipitation), Bio 14 (precipitation of driest month), Bio 18 (precipitation of warmest quarter), Bio 19 (precipitation of coldest quarter), Bio 2 (mean diurnal range), Bio 3 (isothermality), Bio 7 (temperature annual range), Bio 8 (mean temperature of wettest quarter) and Bio 9 (mean temperature of driest quarter).
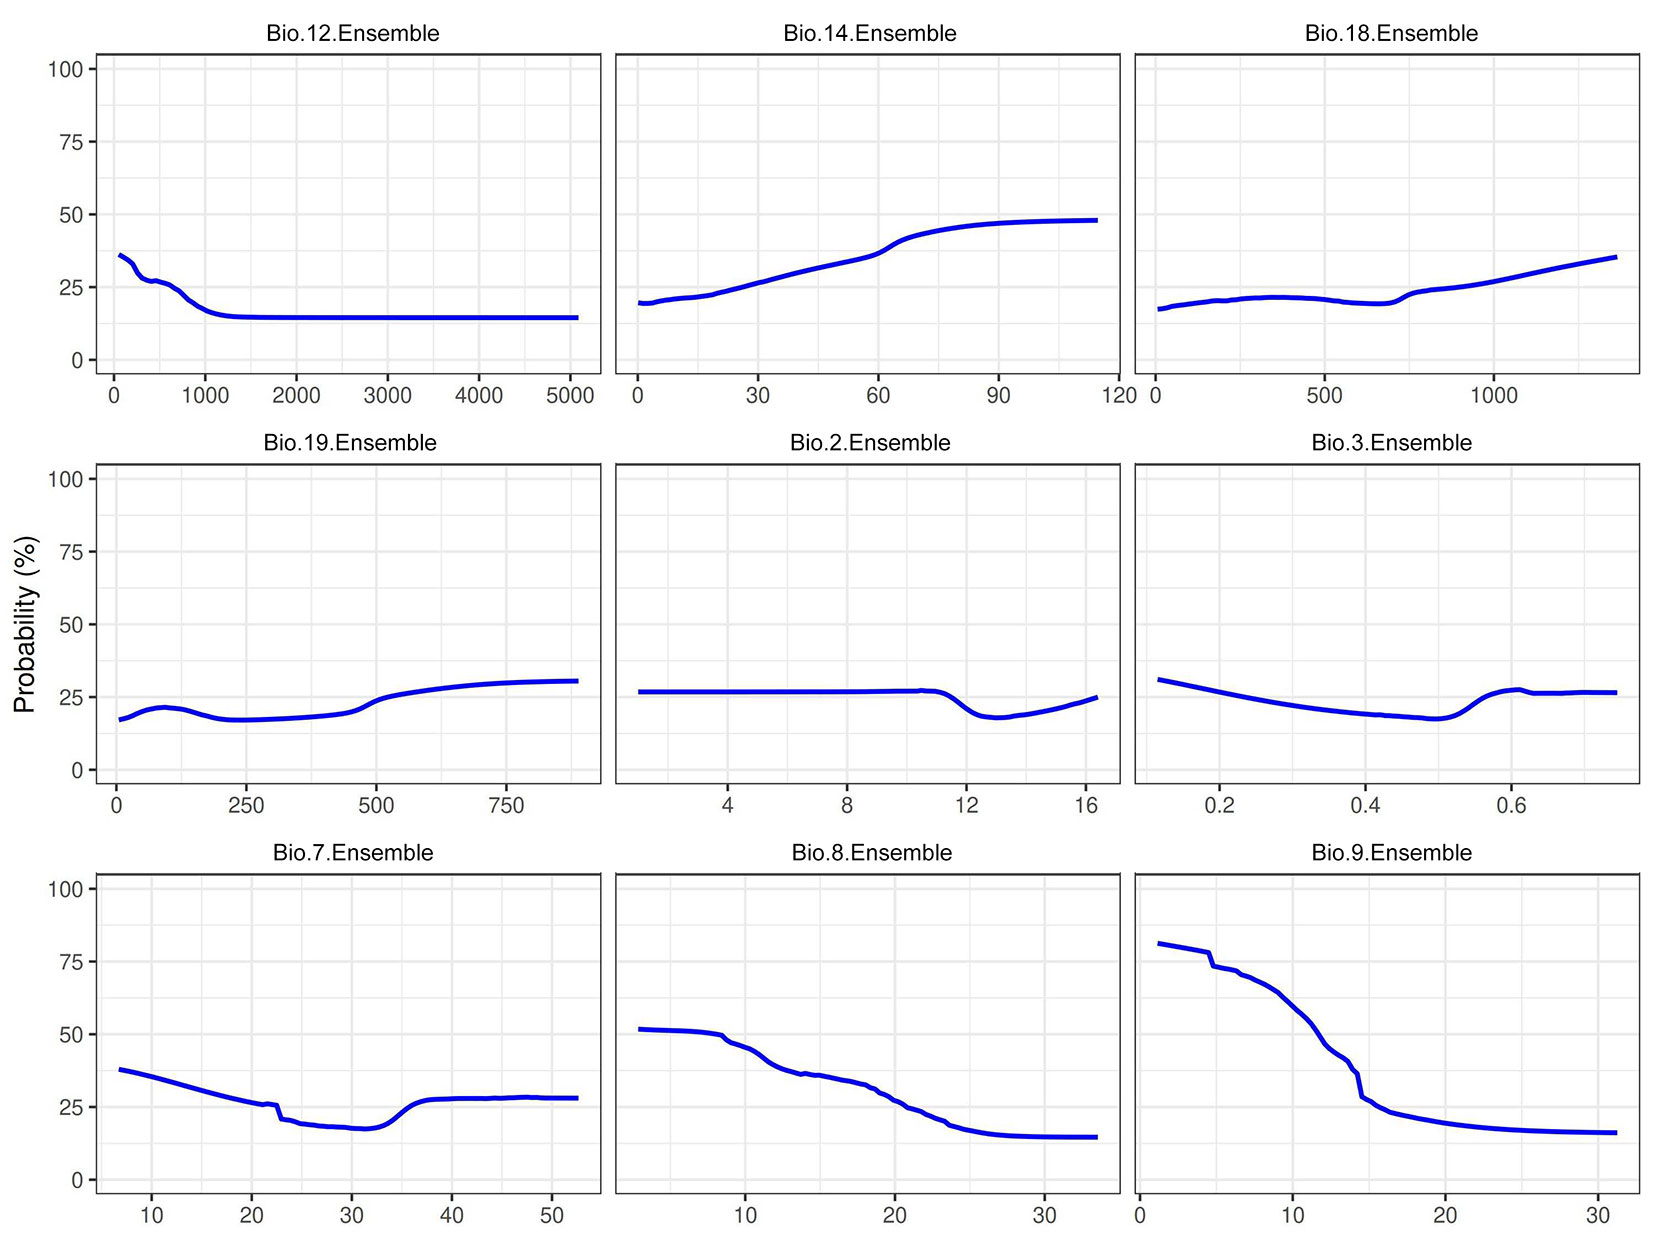
In contrast, precipitation predictors have a secondary influence. Habitat suitability persists under the semi-arid regimes typical of the species’ range and declines only modestly with reductions in annual or seasonal precipitation. These findings demonstrate that, despite its drought tolerance, P. cembroides remains vulnerable to elevated temperatures and reduced moisture, factors likely to constrain its distribution under future warming scenarios.
Current and future distribution
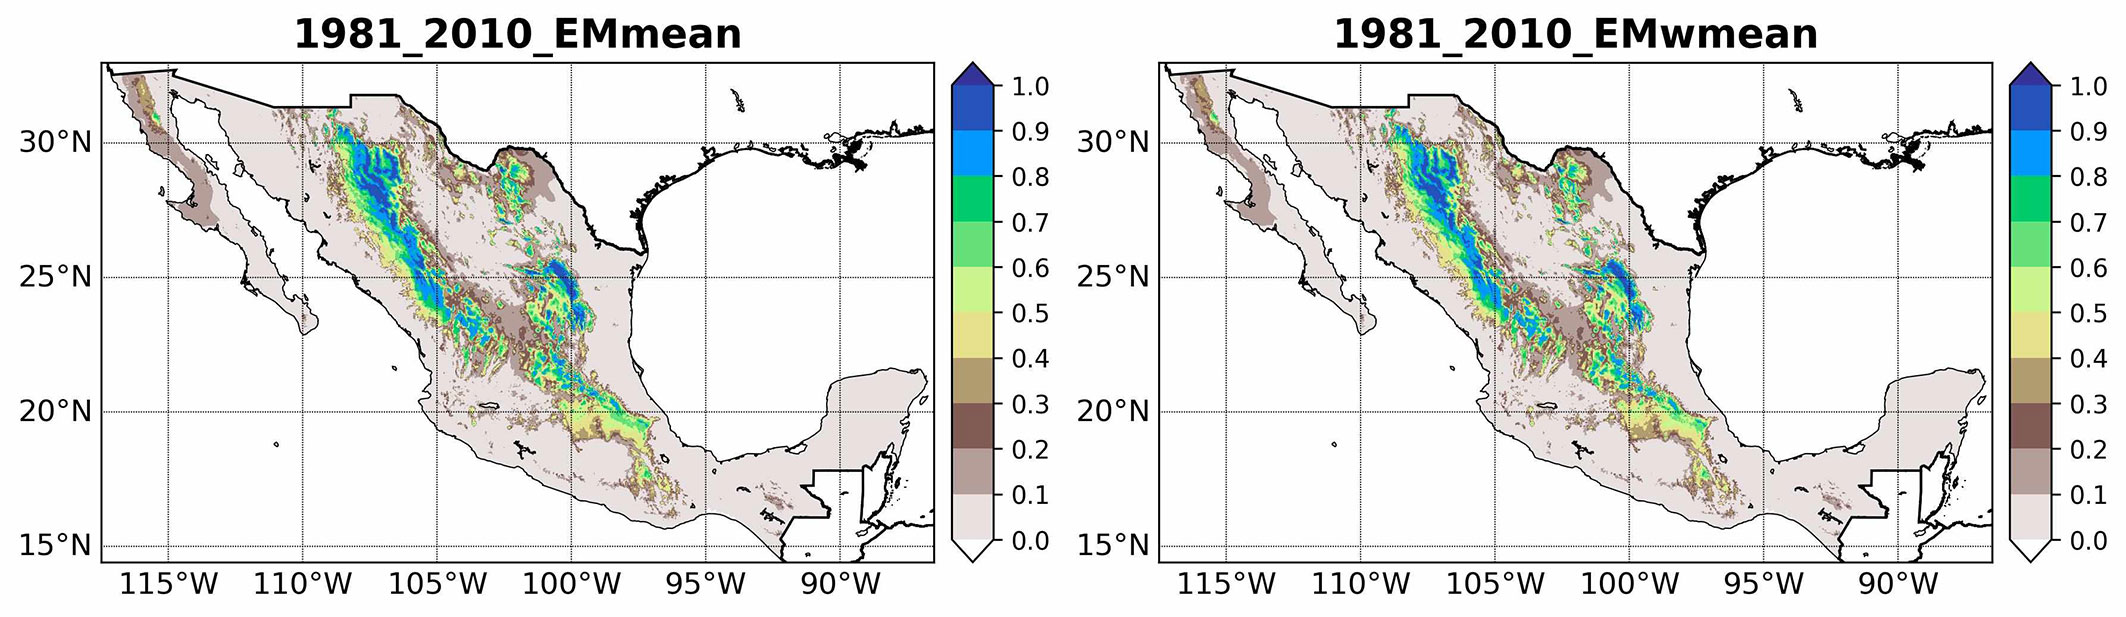
Under current climate conditions (1981-2010), the ensemble models EMmean and EMwmean identify P. cembroides primarily in mountainous regions (Fig. 2). Both approaches consistently indicate high suitability in the Sierra Madre Oriental and Sierra Madre Occidental, in particular, in the regions of Chihuahua, Durango, and Nuevo León, and along the Trans-Mexican Volcanic Belt. Total suitable area is estimated at 5.4 × 10⁵ km2 for EMmean and 5.2 × 10⁵ km2 for EMwmean. Although EMwmean extends slightly further into the southwestern Sierra Madre Occidental, both models converge on these mountain ranges as key refugia.
Fig. 2 - Current potential distribution of P. cembroides based on ensemble predictions derived from committee averaging (EMmean) and weighted mean (EMwmean) methods.
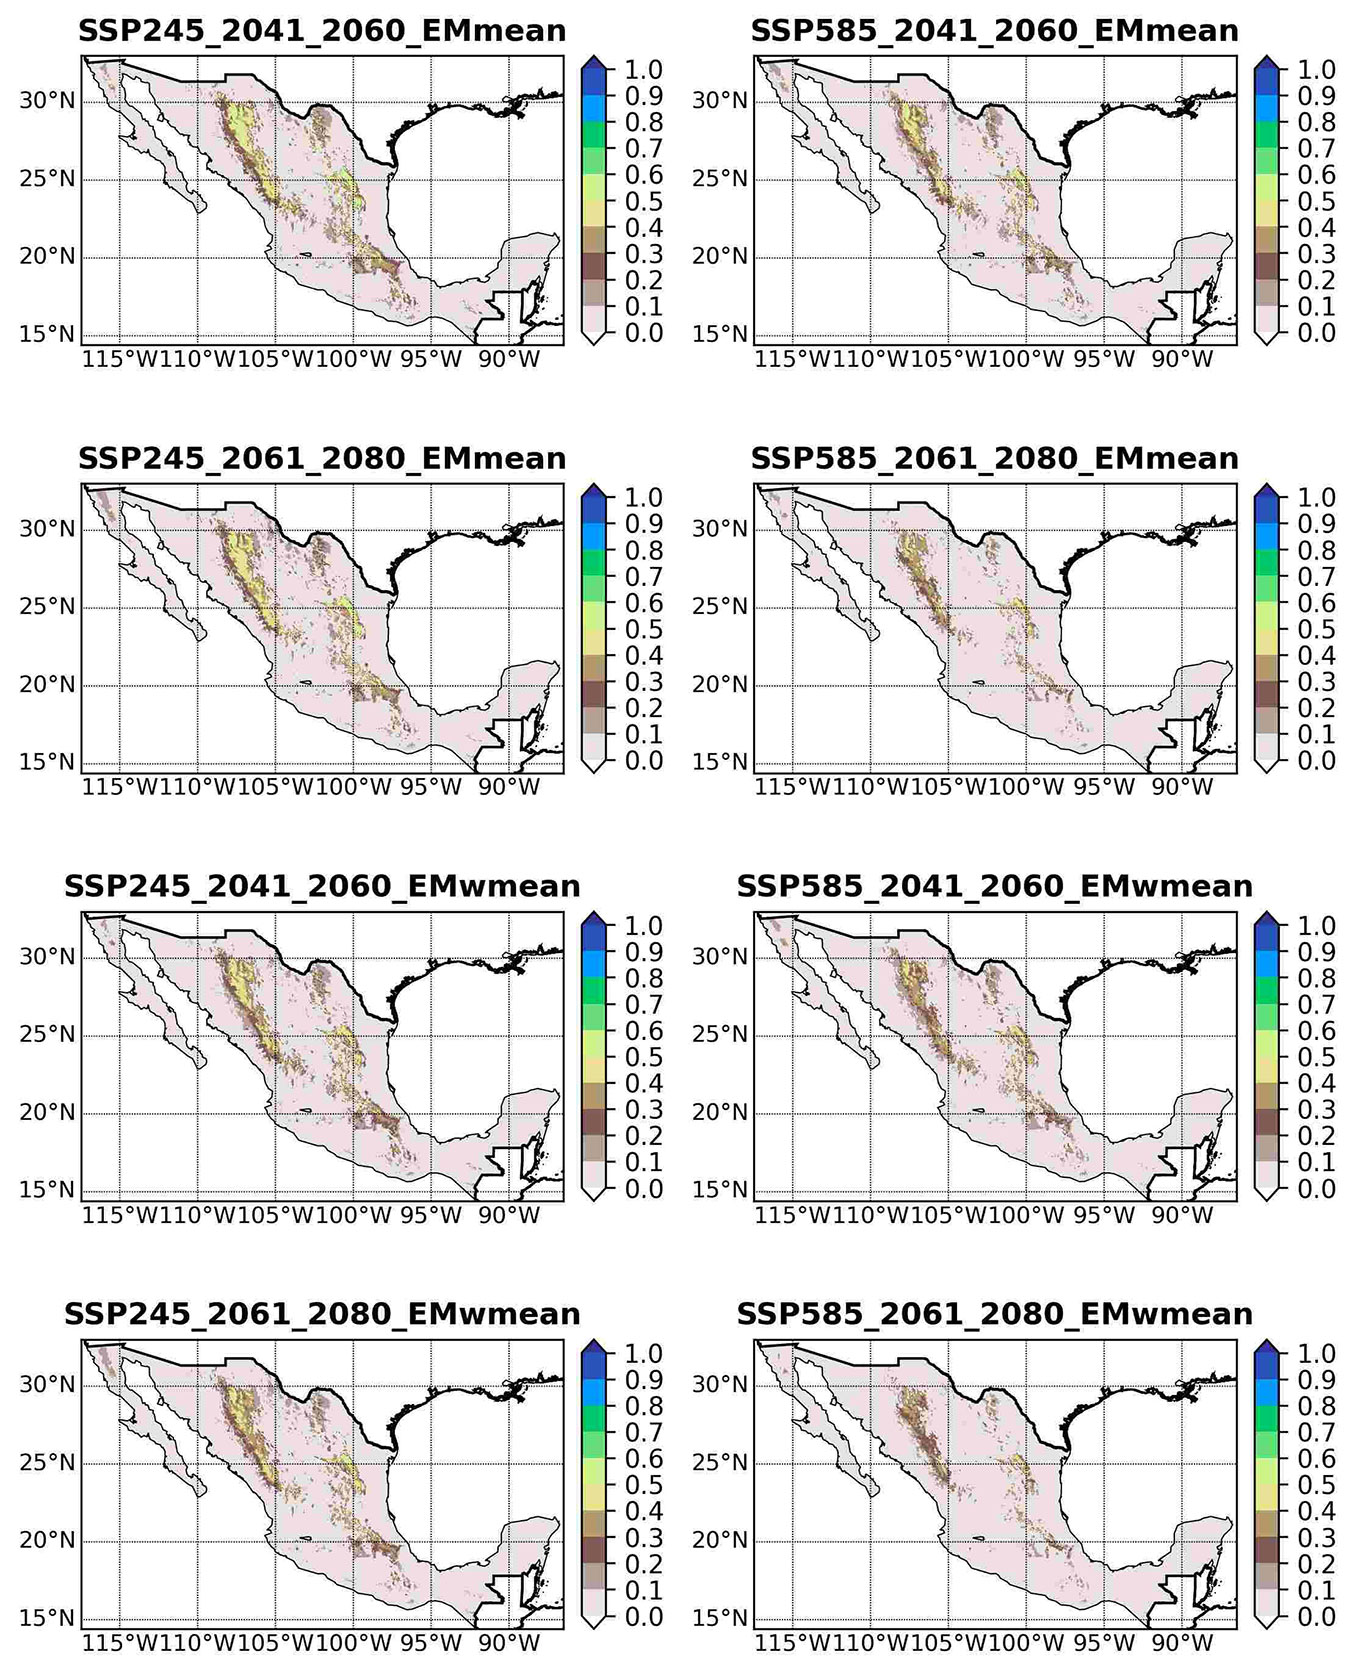
Under SSP245 (2041-2060), high-elevation areas retain moderate to high suitability (HIS ≥ 0.6) but occur in more fragmented patches than during the baseline period (Fig. 3). By 2061-2080, continuity of suitable habitat declines further, particularly in the central Sierra Madre Occidental, where areas with HIS ≥ 0.8 shrink sharply. Under the more extreme SSP585 scenario, losses intensify, and by 2061-2080, only isolated pockets of moderate suitability (HIS = 0.4-0.6) persist across northern and central Mexico. Although EMwmean occasionally predicts slightly larger clusters of moderate suitability, both ensembles agree on a pronounced contraction in the range.
Fig. 3 - Projected future distribution of P. cembroides under climate change scenarios SSP245 and SSP585 for the periods 2041-2060 and 2061-2080, based on ensemble predictions derived from committee averaging (EMmean) and weighted mean (EMwmean) methods.
Range-change statistics (Tab. 4) reveal severe losses under all scenarios. For 2041-2060, EMmean projects a 65.6% decline under SSP245 and 74.1% under SSP585; EMwmean estimates losses of 67.8% and 76.7%, respectively. The most extreme contractions occur during 2061-2080 under SSP585, with projected losses of 84.6% (EMmean) and 85.9% (EMwmean). No scenario predicts net habitat gain. These changes are particularly pronounced in northern Mexico, along both the Sierra Madre Oriental and Sierra Madre Occidental, where the current range is projected to decline significantly.
Tab. 4 - Summary of the range change statistics (in 105 km2) for P. cembroides under SSP245 and SSP585 scenarios in 2041-2060 and 2061-2080.
| Scenario | Ensemble | Loss | Stable | Gain | Loss (%) |
Gain (%) |
Change (%) |
|---|---|---|---|---|---|---|---|
| SSP245_2041_2060 | EMmean | 3.6 | 1.9 | 0.0 | 65.6 | 0.0 | -65.6 |
| SSP245_2041_2060 | EMwmean | 3.6 | 1.7 | 0.0 | 67.8 | 0.0 | -67.8 |
| SSP585_2041_2060 | EMmean | 4.0 | 1.4 | 0.0 | 74.1 | 0.0 | -74.1 |
| SSP585_2041_2060 | EMwmean | 4.0 | 1.2 | 0.0 | 76.7 | 0.0 | -76.7 |
| SSP245_2061_2080 | EMmean | 3.7 | 1.8 | 0.0 | 67.5 | 0.0 | -67.4 |
| SSP245_2061_2080 | EMwmean | 3.7 | 1.6 | 0.0 | 70.6 | 0.0 | -70.6 |
| SSP585_2061_2080 | EMmean | 4.6 | 0.8 | 0.0 | 84.6 | 0.0 | -84.6 |
| SSP585_2061_2080 | EMwmean | 4.5 | 0.7 | 0.0 | 85.9 | 0.0 | -85.9 |
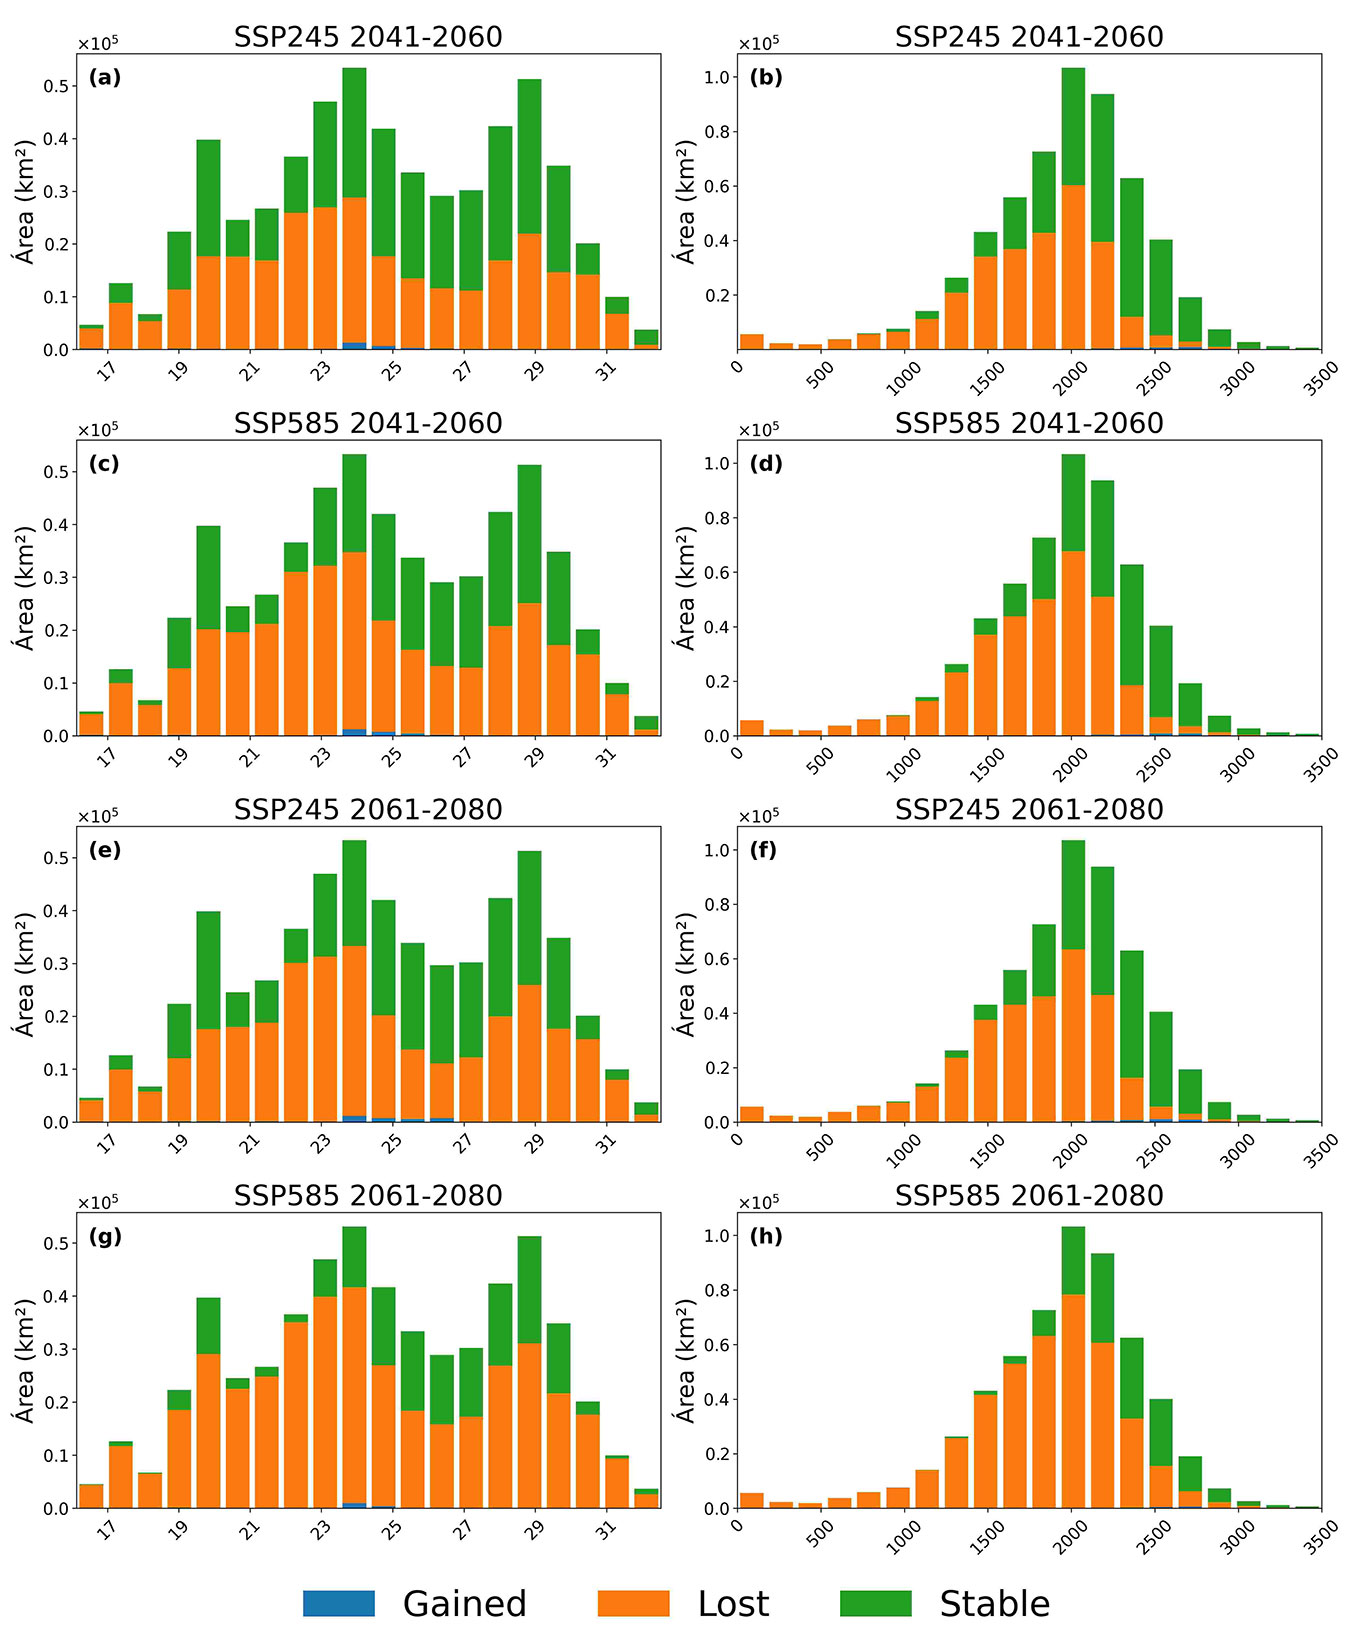
Fig. 4 shows that the stable category is most extensive between 22° and 26 °N and at elevations of 1500-2500 m a.s.l. Habitat gains remain marginal, accounting for less than 5% of the landscape, and are restricted to latitudes below 20° N and mid-elevations (1000-1500 m). Under SSP245 (2041-2060), approximately 25% of stable habitat is lost, whereas under SSP585 (2061-2080) losses exceed 50%, reflecting a pronounced contraction of the species’ current range.
Fig. 4 - Latitudinal and elevational distributions of potential habitat area for P. cembroides, showing area gained (blue), lost (orange), and stable (green) under SSP245 and SSP585 scenarios for 2041-2060 (top two rows) and 2061-2080 (bottom two rows) for EMmean (a-d) and EMwmean (e-h).
Discussion
Ensemble modeling and model performance
SDMs are essential tools for understanding the biogeographic patterns and potential future ranges of forest species, particularly under scenarios of rapid climate change ([19]). In Mexico, SDMs for Pinus have often relied on a single algorithm, such as MAXENT ([50]), due to its strong performance with presence-only data ([16], [43]). Nonetheless, predictions generated from individual models are vulnerable to algorithmic biases, which can lead to an underestimation of overall model uncertainty ([8]).
Our study demonstrates that the ensemble framework implemented in BIOMOD2 ([61]) yields robust and consistent projections by integrating multiple SDMs and GCMs. Averaging or weighting these projections effectively captures intermodel variability, thereby refining final habitat suitability maps ([23], [60]).
The consensus models achieved high evaluation metrics, with TSS values of 0.775 and 0.777 and AUC values of 0.945 and 0.949 for EMmean and EMwmean, respectively. These results are consistent with previous studies employing similar multi-model frameworks ([45]). Among individual models, MAXENT, GLM, GBM, and RF showed the highest predictive performance, whereas SRE, CTA, and FDA consistently underperformed in terms of TSS, AUC, and pAUC metrics ([35], [38], [45]).
Although ensemble approaches do not consistently yield improved predictive accuracy, our results underscore their value for species with narrow ecological tolerances, where even minor prediction errors can undermine conservation outcomes ([7]).
Environmental predictors
Seasonal temperature extremes emerged as the primary drivers of P. cembroides suitability. Bio 8 (mean temperature of the wettest quarter) and Bio 9 (mean temperature of the driest quarter) together accounted for the largest share of the variation in our ensemble models. This result is consistent with studies on Mexican conifers ([1], [22], [25], [42]), which also emphasize the key role of seasonal temperature variability in defining distributional limits.
Habitat suitability declined markedly when mean temperatures in the wet and dry quarters exceeded 20 °C, indicating thermal thresholds that delimit the climatic niche of P. cembroides. In contrast, precipitation variables exerted only marginal effects on suitability, indicating that, despite their tolerance of semi-arid regimes, temperature extremes impose a greater constraint than moisture availability. This finding aligns with previous studies demonstrating that seasonal temperature variability exerts a more decisive influence than precipitation in determining pine distributions ([1]).
Although macroclimatic drivers govern distribution patterns at broad spatial scales, local edaphic factors, such as soil depth, aspect, and nutrient availability, become critical at finer resolutions by modulating microclimatic conditions in heterogeneous landscapes.
Future distribution
Climate change poses a significant threat to coniferous forests in topographically complex regions such as Mexico. Previous projections based on WorldClim and CMIP5 scenarios indicated moderate to substantial habitat contraction for temperate, tropical, and semi-arid species ([24], [16]).
Our study employed high-resolution CHELSA v. 2.1 data and updated CMIP6 Shared Socioeconomic Pathway scenarios, predicting a 65%-85% reduction in suitable habitat for P. cembroides by 2080-2100. Losses are most severe under SSP585, which is characterized by elevated greenhouse gas emissions and intensified warming ([5]). These contractions suggest that remaining populations will be confined to fragmented, high-elevation refugia in the Sierra Madre ranges. Although local microclimates may allow persistence or even limited expansion in some areas ([53]), at regional to national scales, P. cembroides is expected to contract to elevations of 1500-2500 m and latitudes of 22°-26° N ([53], [10]). Projected altitudinal shifts of 300-500 m and habitat reductions of 60%-75% have been reported for Pinus hartwegii and Abies religiosa ([3], [43]). Pseudotsuga menziesii may lose over 80% of its Mexican range, persisting only in isolated high-elevation refugia ([43]). In contrast, Pinus oocarpa could gain a modestly novel habitat ([25]). These patterns demonstrate the importance of elevational connectivity and assisted migration for conserving genetic diversity under future warming, and highlight the role of scale-dependent processes in species distribution modelling.
Conservation implications and future research
The projected contraction of P. cembroides habitat under high-emission scenarios presents critical conservation challenges. Range reduction will exacerbate fragmentation and erode genetic diversity, a vulnerability already documented in Mexican conifer populations under climate-induced stress ([56]).
Assisted migration facilitates the translocation of vulnerable populations into regions projected to remain climatically suitable ([28]). Establishing ecological corridors further enhances connectivity among isolated stands, mitigating demographic risks associated with small populations.
Our emphasis on macroclimatic drivers underscores the importance of incorporating non-climatic factors into future Species Distribution Models (SDMs), including land-use change, soil properties, and species-specific biotic interactions ([58]). Such integrated models would produce more realistic projections, ultimately guiding more effective conservation interventions.
As occurrence records and high-resolution climate projections continue to improve, ongoing model recalibration will support adaptive forest management. This iterative framework will inform prioritization efforts and help secure the long-term persistence of P. cembroides and Mexico’s pine ecosystems under intensifying climatic stressors.
Conclusions
This study employed SSP245 and SSP585 projections from CHELSA v. 2.1 within a BIOMOD2 ensemble framework to assess the future distribution of P. cembroides. Both ensemble approaches (EMmean and EMwmean) and MAXENT consistently demonstrated high predictive accuracy, reinforcing their effectiveness in modeling semi-arid-adapted species.
Although the species exhibits considerable resilience, P. cembroides is anticipated to experience a marked range contraction with an estimated 65%-85% loss of its current habitat by the end of the century. High-elevation refugia are likely to remain climatically suitable, while the potential for new habitat emergence is minimal. These results highlight urgent conservation priorities. The severe loss and fragmentation of suitable areas will likely diminish genetic diversity and limit adaptive capacity. Proactive measures are essential, including assisted migration to more humid lowlands, protection of montane refugia, and establishment of ecological corridors to maintain connectivity. Overall, this study demonstrates the utility of ensemble SDMs for capturing climate-driven range dynamics and emphasizes the critical need for adaptive management strategies to mitigate the rapid impacts of climate change on P. cembroides.
Acknowledgements
JNM-S and GC-R thank SECIHTI (Secretaría de Ciencia, Humanidades, Tecnología e Innovación, Mexico City, MX) for the scholarships granted.
References
Gscholar
CrossRef | Gscholar
CrossRef | Gscholar
Gscholar
CrossRef | Gscholar
Gscholar
Gscholar
Gscholar
CrossRef | Gscholar
CrossRef | Gscholar
CrossRef | Gscholar
Gscholar
Gscholar
CrossRef | Gscholar
CrossRef | Gscholar
CrossRef | Gscholar
Gscholar
CrossRef | Gscholar
Gscholar
Gscholar
Gscholar
Gscholar
CrossRef | Gscholar
CrossRef | Gscholar
Authors’ Info
Authors’ Affiliation
Homero Gárate-Escamilla 0000-0003-2060-1463
Manuel De Luna 0000-0002-0746-0507
Gerardo Cuéllar-Rodríguez 0000-0003-4969-611x
Dept. de Ciencias Forestales, Universidad Autónoma de Nuevo León, Carretera a Cd. Victoria km 145, 67700 Linares (México)
Centro de Investigación Científica y de Educación Superior de Ensenada, Ensenada (México)
Corresponding author
Paper Info
Citation
Martínez-Sánchez JN, Cavazos T, Gárate-Escamilla H, De Luna M, Cuéllar-Rodríguez G (2026). Ensemble modeling of Pinus cembroides Zucc. distribution under future CMIP6 climate scenarios in northern Mexico. iForest 19: 1-8. - doi: 10.3832/ifor4880-018
Academic Editor
Maurizio Marchi
Paper history
Received: Apr 14, 2025
Accepted: Sep 02, 2025
First online: Jan 10, 2026
Publication Date: Feb 28, 2026
Publication Time: 4.33 months
Copyright Information
© SISEF - The Italian Society of Silviculture and Forest Ecology 2026
Open Access
This article is distributed under the terms of the Creative Commons Attribution-Non Commercial 4.0 International (https://creativecommons.org/licenses/by-nc/4.0/), which permits unrestricted use, distribution, and reproduction in any medium, provided you give appropriate credit to the original author(s) and the source, provide a link to the Creative Commons license, and indicate if changes were made.

Web Metrics
Breakdown by View Type
Article Usage
Total Article Views: 4408
(from publication date up to now)
Breakdown by View Type
HTML Page Views: 1850
Abstract Page Views: 1233
PDF Downloads: 1205
Citation/Reference Downloads: 2
XML Downloads: 118
Web Metrics
Days since publication: 183
Overall contacts: 4408
Avg. contacts per week: 168.61
Article Citations
Article citations are based on data periodically collected from the Clarivate Web of Science web site
(last update: Mar 2025)
(No citations were found up to date. Please come back later)
Publication Metrics
by Dimensions ©
Articles citing this article
List of the papers citing this article based on CrossRef Cited-by.
Related Contents
iForest Similar Articles
Research Articles
Distribution factors of the epiphytic lichen Lobaria pulmonaria (L.) Hoffm. at local and regional spatial scales in the Caucasus: combining species distribution modelling and ecological niche theory
vol. 17, pp. 120-131 (online: 30 April 2024)
Research Articles
Local ecological niche modelling to provide suitability maps for 27 forest tree species in edge conditions
vol. 13, pp. 230-237 (online: 19 June 2020)
Research Articles
Climate change may threaten the southernmost Pinus nigra subsp. salzmannii (Dunal) Franco populations: an ensemble niche-based approach
vol. 11, pp. 396-405 (online: 15 May 2018)
Research Articles
Potential natural vegetation pattern based on major tree distribution modeling in the western Rif of Morocco
vol. 17, pp. 405-416 (online: 22 December 2024)
Research Articles
Modelling diameter distribution of Tetraclinis articulata in Tunisia using normal and Weibull distributions with parameters depending on stand variables
vol. 9, pp. 702-709 (online: 17 May 2016)
Research Articles
The missing part of the past, current, and future distribution model of Quercus ilex L.: the eastern edge
vol. 17, pp. 90-99 (online: 22 March 2024)
Research Articles
Nearest neighbour relationships in Pinus yunnanensis var. tenuifolia forests along the Nanpan River, China
vol. 10, pp. 746-753 (online: 01 August 2017)
Research Articles
Spatial modeling of the ecological niche of Pinus greggii Engelm. (Pinaceae): a species conservation proposal in Mexico under climatic change scenarios
vol. 13, pp. 426-434 (online: 16 September 2020)
Research Articles
Modeling extreme values for height distributions in Pinus pinaster, Pinus radiata and Eucalyptus globulus stands in northwestern Spain
vol. 9, pp. 23-29 (online: 25 July 2015)
Research Articles
Spatio-temporal modelling of forest monitoring data: modelling German tree defoliation data collected between 1989 and 2015 for trend estimation and survey grid examination using GAMMs
vol. 12, pp. 338-348 (online: 05 July 2019)
iForest Database Search
Search By Author
Search By Keyword
Google Scholar Search
Citing Articles
Search By Author
Search By Keywords
PubMed Search
Search By Author
Search By Keyword


