Effects of water surplus over a secondary forest remain after 16 years in the Amazonia
iForest - Biogeosciences and Forestry, Volume 18, Issue 5, Pages 234-241 (2025)
doi: https://doi.org/10.3832/ifor4537-018
Published: Sep 06, 2025 - Copyright © 2025 SISEF
Research Articles
Abstract
Water and Nutrient Manipulation in a Secondary Forest (MANFLORA) was conducted in the eastern Amazon region over eight years. In this experiment, three treatments were established: Control (CTL), Litter Removal (REM), and Soil Irrigation (IRR) within the secondary forest. The objective was to understand the effects of resource management on forest dynamics after slash-and-burn agriculture. The floristic composition and vegetation structure were evaluated 16 years after the experiment’s conclusion. The absolute number of species and individuals varied among CTL, IRR, and REM. Hierarchical clustering based on Jaccard’s index revealed similarity in floristic composition between CTL and IRR, both for individuals ≥ 15 cm in circumference at breast height and those in natural regeneration. Nutrient shortage through litter removal and periodic irrigation did not significantly affect the vegetation structure, likely due to the greater adaptability of species to soil and climate changes. Regarding floristic composition, REM presented long-term losses, indicating that soil nutrient availability can be a critical factor for the recovery of floristic composition in secondary forests.
Keywords
Forest Succession, Resource Management, Structural Indicators, Composition Indicators
Introduction
Restoring degraded ecosystems, which involves strategies and techniques to reverse the damage caused by environmental degradation, has become a global necessity due to the crises threatening the integrity of life on Earth ([15]). Climate change, biodiversity loss and the decline of water reservoirs are current scientific concerns, resulting from the expansion of human activities such as agriculture and livestock, driven by the increasing demand for food ([7]).
In the Amazon, shifting agriculture has been the primary activity responsible for replacing natural forests with small-scale farming areas for centuries. Although considered a low-impact environmental activity due to its small scale, the increasingly shorter fallow periods are reducing the regeneration potential of ecosystems affected by shifting agriculture ([13]). On the other hand, maintaining forests adjacent to cultivated areas, combined with the resilience of Amazonian ecosystems, often allows positive trajectories of secondary vegetation restoration through natural regeneration ([12]).
Natural regeneration enables the recovery of ecosystem structure (biomass, basal area, and height) and composition (species richness and diversity), which implies a gradual recovery of the ecosystem functional characteristics, such as soil moisture and fertility ([11]). These characteristics are effective indicators of ecosystem restoration, as they reflect ecosystem conditions, particularly regarding abiotic variations like climate events and changes in the physical and chemical properties of soil ([4]). On the other hand, secondary forests are typically characterized by substantial increases in height and diameter of trees in the early stages of succession, ensuring a high potential for carbon sequestration from the atmosphere ([33]). In this context, understanding the factors underlying the development of secondary forests is essential for achieving global restoration goals, including Brazil’s commitment to restore 12 million hectares by 2030 ([35]).
Resource availability, especially water and nutrients, is one of the key factors influencing plant development in forest ecosystems ([39]). This is particularly significant in the Amazon due to the high soil acidity and intense weathering, which result in low natural soil fertility and a high dependence on nutrient cycling for ecosystem maintenance ([23]). The decomposition of litter, i.e., the layer of forest residues deposited on the ground, stands out as the primary source of nutrition for the soil-plant system ([14]). The availability of elements like Ca and K in the soil are positively correlated with the decomposition rate ([34]), and nutrient return depends on the litter flux throughout the year ([50]).
Frequent and intense rains, which are common in much of the Amazon, promote the activity of soil entomofauna and microorganisms that directly contribute to litter decomposition ([38]). They are also responsible for the plant’s eco-physiological responses during its development, including radial stem expansion ([27]). For this reason, changes in weather patterns can result in significant disruptions to vegetation composition and forest dynamics, leading to losses in carbon storage.
The Water and Nutrient Manipulation in a Successional Forest project in the Eastern Amazonia (MANFLORA) was developed to understand the long-term effects of resource management on the dynamics of a secondary forest ([44], [45], [46]). In the MANFLORA’s experimental plots, the effects of nutrient reduction through the complete removal of all stored litter and periodic irrigation during drier periods were tested over eight years. The following question was addressed: Are there long-term effects on the floristic composition and structure of secondary forests in response to resource manipulation? This study hypothesizes that long-term irrigation and nutrient reduction would alter the floristic composition and structure of the secondary forest.
Materials and Methods
Study area
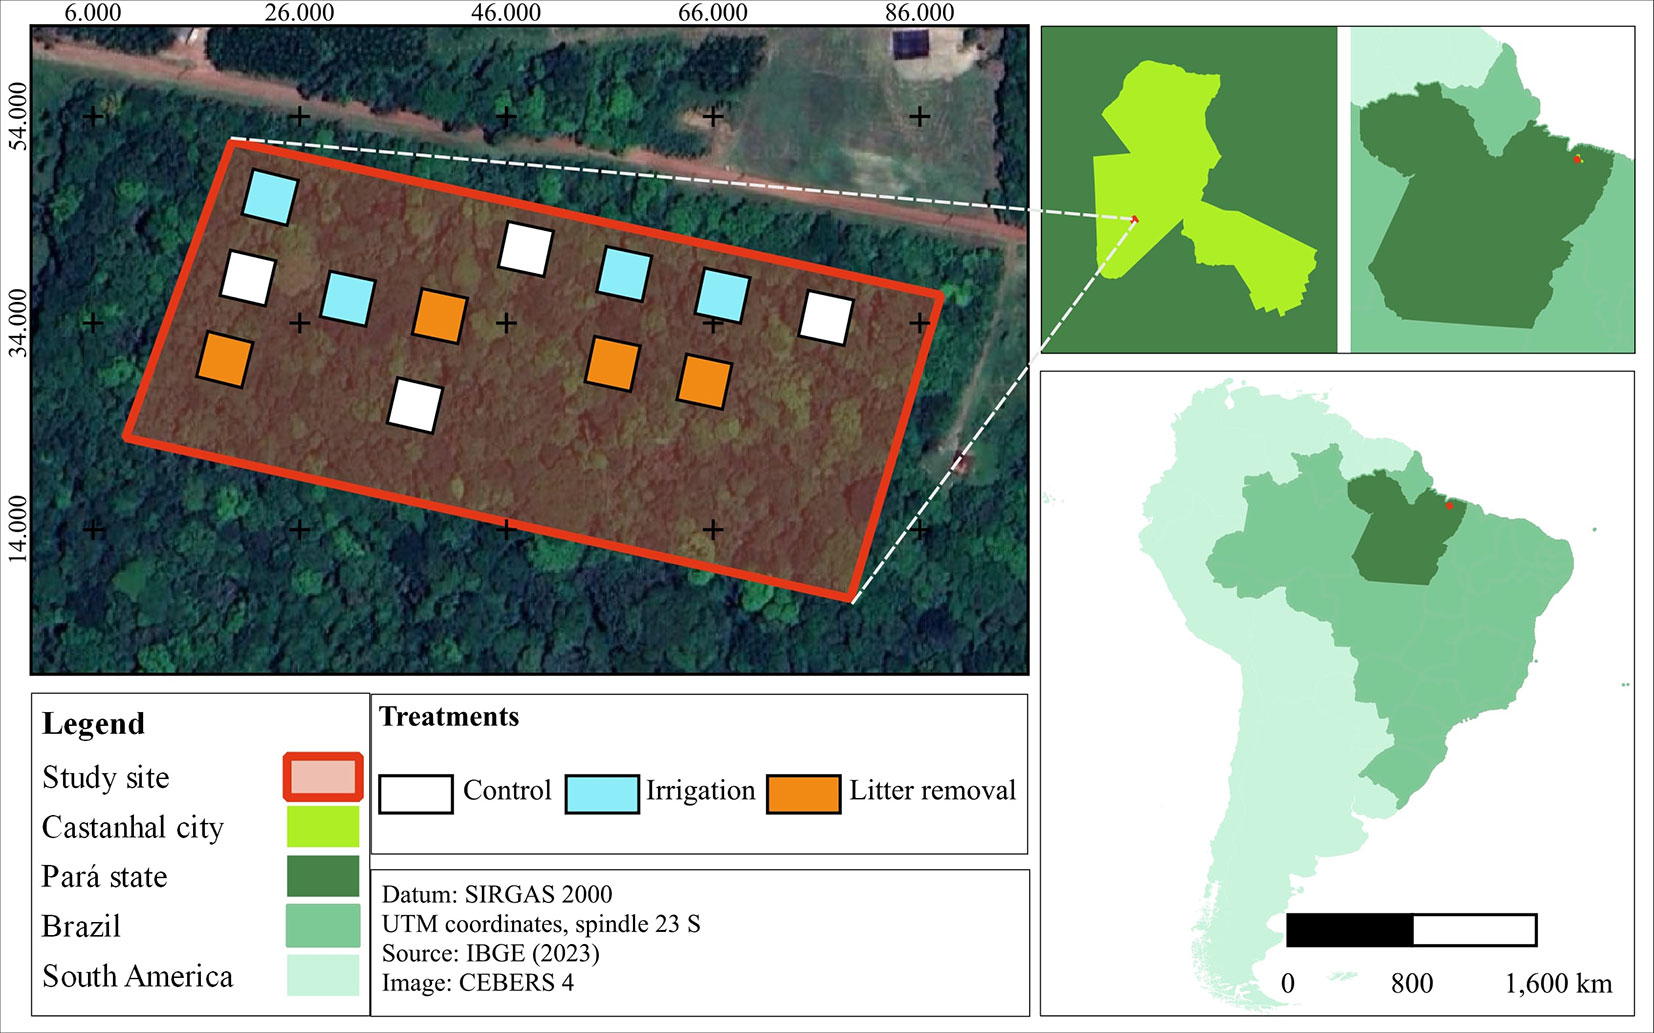
The study was conducted in the experimental plots of MANFLORA (01° 19′ 16″ S, 47° 57′ 50″ W), located at the Castanhal School Farm (Fazenda Escola de Castanhal - FEC), which belongs to the Federal Rural University of the Amazonia, in the municipality of Castanhal, Pará state, Eastern Amazonia, Brazil (Fig. 1). According to Köppen’s classification, the climate of the study area is Af3, with an average annual rainfall of 2000-2500 mm ([2]). The wettest period occurs from December to May, while the drier season spans from June to November ([37]). The topography is gently undulating, and the soils are identified as Yellow Ferrosols, characterized by low natural fertility ([43]). The original vegetation was classified as Dense Ombrophilous Forest; however, it is now predominantly composed of secondary forests ([25]).
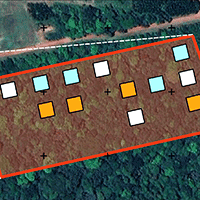
Fig. 1 - Fragment of secondary forest 16 years after the conclusion of the Water and Nutrient Manipulation in a Successional Forest in the Eastern Amazonia project (MANFLORA). Squares represent the plots assigned to Control (CTL), Irrigation (IRR), and Nutrient Removal (REM) treatments.
MANFLORA began in 1999 in a forest that had undergone 12 years of natural regeneration after the cessation of agricultural activity. It consisted of control plots (CTL) without human intervention and two resource management treatments: Soil Irrigation (IRR) and Litter Removal (REM). Four permanent plots, each measuring 400 m2 (20 × 20 m), were established for each treatment, with a minimum distance of 10 m among them. In the IRR treatment, 5 mm of water was supplied per day for 30 minutes during the lower precipitation months (July to November) using micro-perforated tapes. In the REM treatment, the litter deposited on the ground was removed entirely every two weeks through plastic rakes. The experiment was concluded in mid-2007, with the secondary forest at 20 years of age. In 2023, sixteen years after the experiment’s conclusion, an evaluation was carried out on ecological indicators related to the composition and structure of the vegetation.
Experiment design and data collection
The experimental design and spatial distribution of the permanent plots used in MANFLORA is displayed in Fig. 1 ([44], [45]). In these plots, we assessed floristic composition, both the horizontal and vertical forest structure, and estimated above-ground biomass (AGB).
Floristic composition and biomass estimation
A floristic inventory of all arboreal and shrub individuals with a Circumference at Breast Height (CBH) ≥ 15 cm was conducted within a 10 × 10 m area established within each 400 m2 plot (20 × 20 m). For these individuals, the total height (Ht) was also estimated. Additionally, a 2 × 2 m area was randomly placed within each subplot to assess natural regeneration (NR). Here, the Ht and CCH (Circumference at Collar Height) of all arboreal individuals with Ht ≥ 10 cm and CBH < 15 cm were measured, using rulers and calipers. When in situ identification was not possible, samples were collected and subsequently identified by comparing them with specimens from the IAN Herbarium of Embrapa Eastern Amazonia, in Belém, Pará, Brazil. Species were classified into ecological groups as pioneer, early secondary, late secondary, and climax, following the classification proposed by Gandolfi et al. ([17]). The conservation status of each species was classified as “Critically Endangered” (CR), “Vulnerable” (VU), or “Least Concern” (LC), according to the International Union for Conservation of Nature ([26]).
Above-ground biomass (AGB) was estimated using the allometric equation (eqn. 1) proposed by Chave et al. ([10]), with wood density data for each species from the Global Wood Density Database ([9]) for the Neotropical region. Total AGB (in kg) was the sum of AGB for all individuals in each treatment, which was subsequently converted into megagrams per hectare (Mg ha-1):
where ρ is the wood density (g cm-3), D is the tree diameter (cm), and H is the tree height (m).
Measures of alpha diversity
Alpha diversity indices were assessed using the Shannon index ([29]), Margalef index ([30]), Pielou’s evenness, and Simpson index ([5]).
Horizontal and vertical structure
The Importance Value Index (IVI) was calculated by summing the means of Relative Dominance (RDom), Relative Frequency (RFreq), and Relative Density (RDens) values, following the methodology proposed by Müeller-Dombois & Ellenberg ([31]). The Expanded Importance Value Index (EIVI) was calculated by summing the means of RDom, RFreq, RDens, Relative Sociological Position (PSR), and Relative Natural Regeneration (RNR) values, as per Finol ([16]).
Data analysis
Species and individual density data, as well as the estimated biomass, were checked for normality and homoscedasticity using the Shapiro-Wilk and Levene tests, respectively, both at a 5% significance level. Once these assumptions were met, analysis of variance (ANOVA, p < 0.05) was conducted. In cases of significant differences, averages between treatments were compared using the Tukey test (p < 0.05) for hypothesis testing. The similarity of species richness between treatments was evaluated through rarefaction curves for individuals. Sampling effort was standardized by the number of individuals in the sampled area ([21]), with the assistance of the “iNEXT” package in R software v. 4.2.0 ([8], [24], [36]). To assess floristic-structural dissimilarity, a binary matrix of species presence (1) and absence (0) was used to calculate the Jaccard’s index. Subsequently, hierarchical clustering was performed and visualized in a heatmap. Species richness data were analyzed using a Generalized Linear Model (GLM) with a Poisson link function, considering the treatment and ecological groups as factors.
Results
Floristic composition and biomass estimation
Using a threshold of CBH ≥ 15 cm, we recorded a total of 114 individuals of 32 species and 19 families in CTL, 85 individuals of 22 species and 15 families in REM, and 110 individuals of 29 species and 17 families in IRR, respectively. Regarding natural regeneration (NR), there were 108, 105, and 81 individuals of 11, 12, and 13 species in CTL, IRR, and REM, distributed in 9, 11, and 9 families in the same order.
Considering individuals with CBH ≥ 15 cm, nine species were found to be common across all treatments. Specifically, the CTL and IRR treatments each presented nine exclusive species, while REM had four unique species (Fig. 2A). In natural regeneration, three species (Acosmium lentiscifolium, Cecropia pachystachya, and Ocotea guianensis) occurred in all treatments. Additionally, two species were exclusive to CTL, five were exclusive to IRR, and six were exclusive to REM (Fig. 3A). The hierarchical clustering based on the Jaccard’s index indicated similarity in floristic composition between CTL and IRR, with greater distance between IRR and REM in both samples (Fig. 3b and Fig. 4b). However, AGB did not differ between treatments (F[2;9] = 1.296; p = 0.320), with averages of 64.16 ± 49.68 Mg ha-1, 77.36 ± 31.33 Mg ha-1, and 118.02 ± 62.01 Mg ha-1 for CTL, IRR, and REM, respectively.
Fig. 2 - Heatmap based on presence and absence of species (A) and dendrogram cluster with Jaccard dissimilarity (B), considering only individuals ≥ 15 cm in CBH, 16 years after Water and Nutrient Manipulation in a Successional Forest in the Eastern Amazonia project (MANFLORA). Control (CTL), Irrigation (IRR), Nutrient Removal (REM).
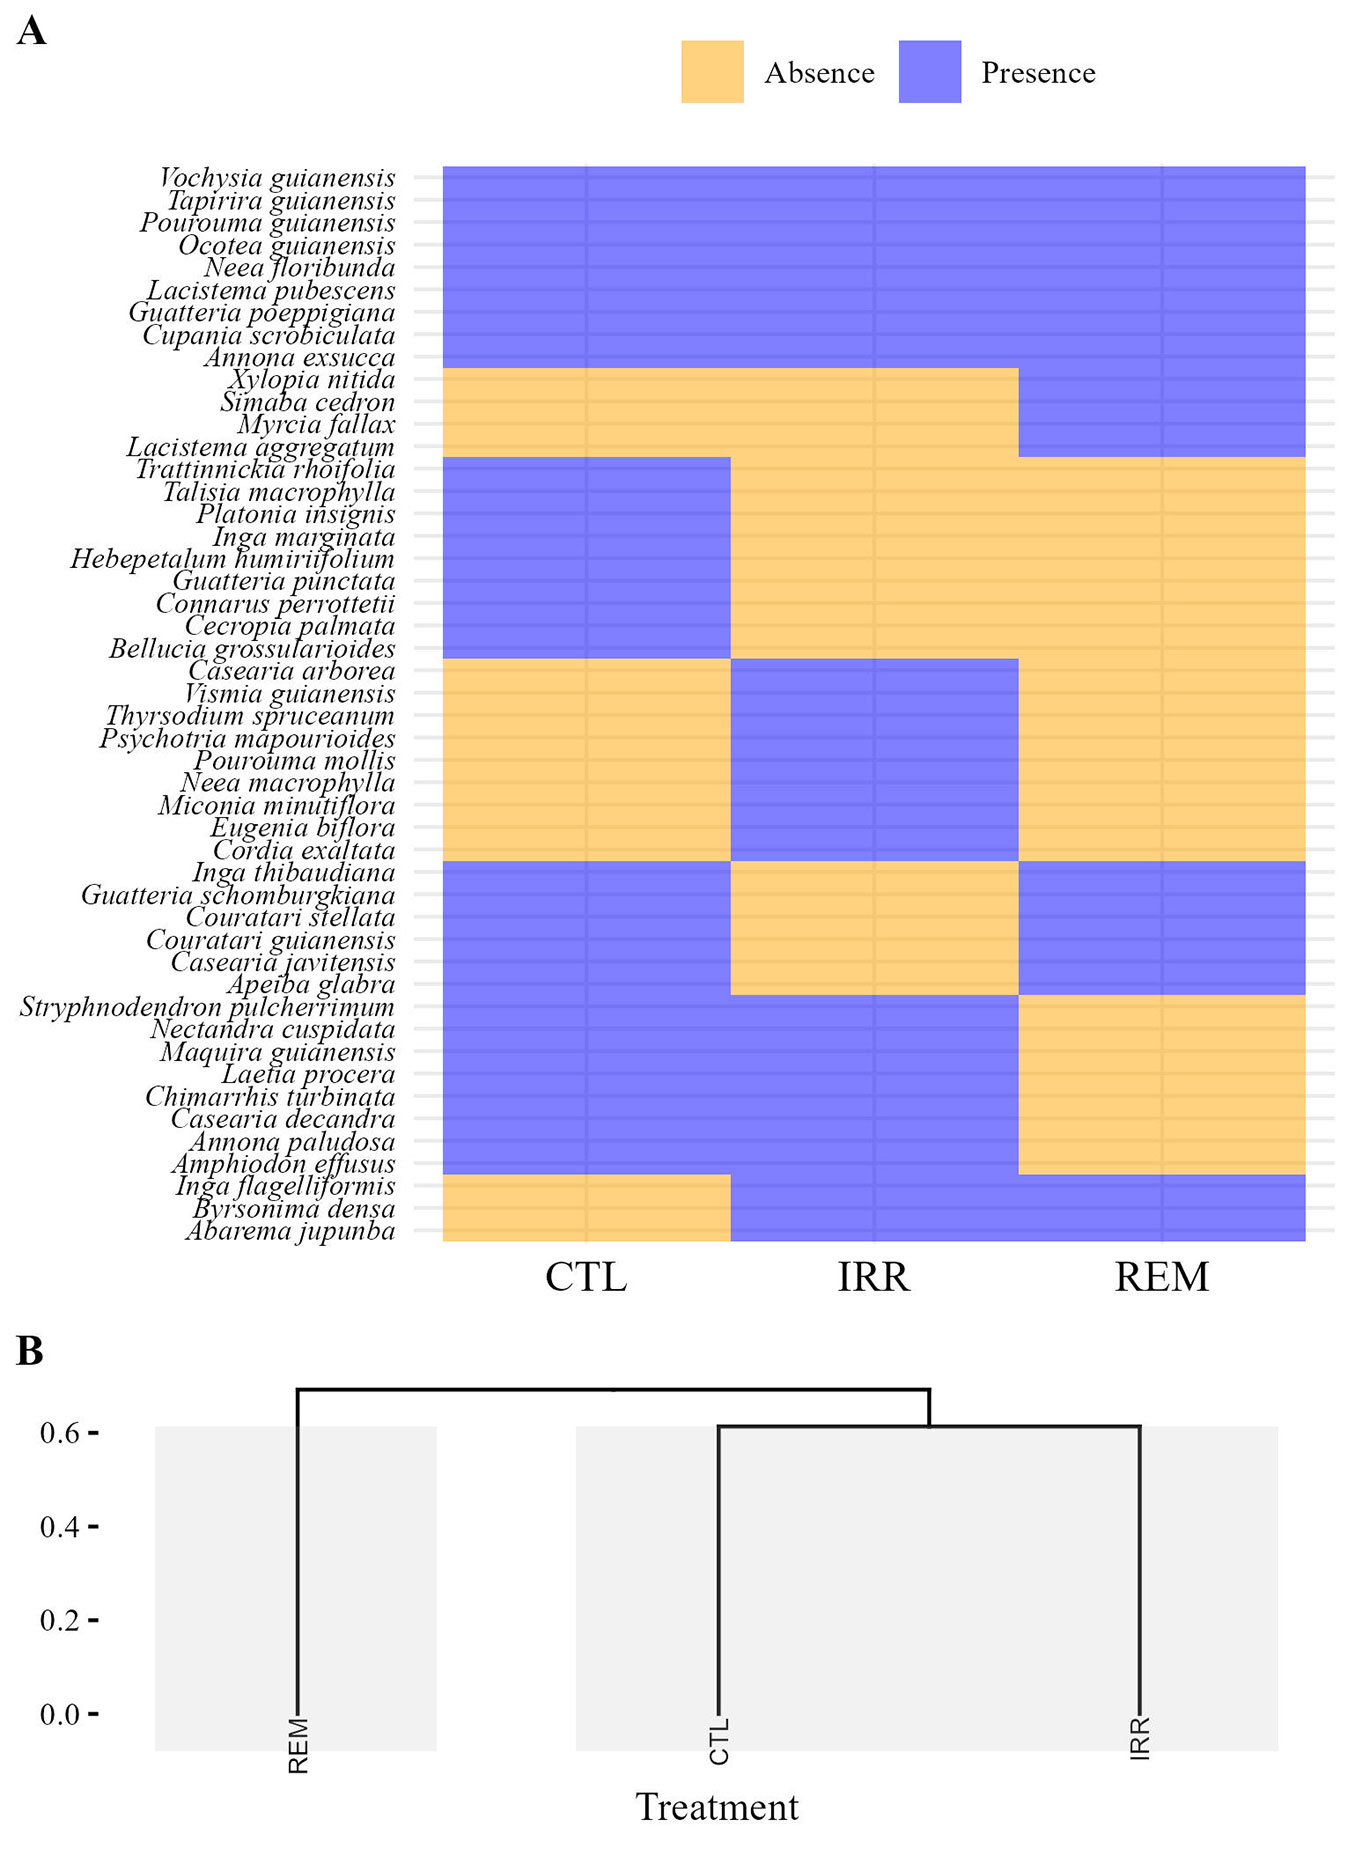
Fig. 3 - Heatmap based on presence and absence of species (A) and dendrogram cluster with Jaccard dissimilarity (B), considering only individuals from natural regeneration, 16 years after Water and Nutrient Manipulation in a Successional Forest in the Eastern Amazonia project (MANFLORA). Control (CTL), Irrigation (IRR), Nutrient Removal (REM).
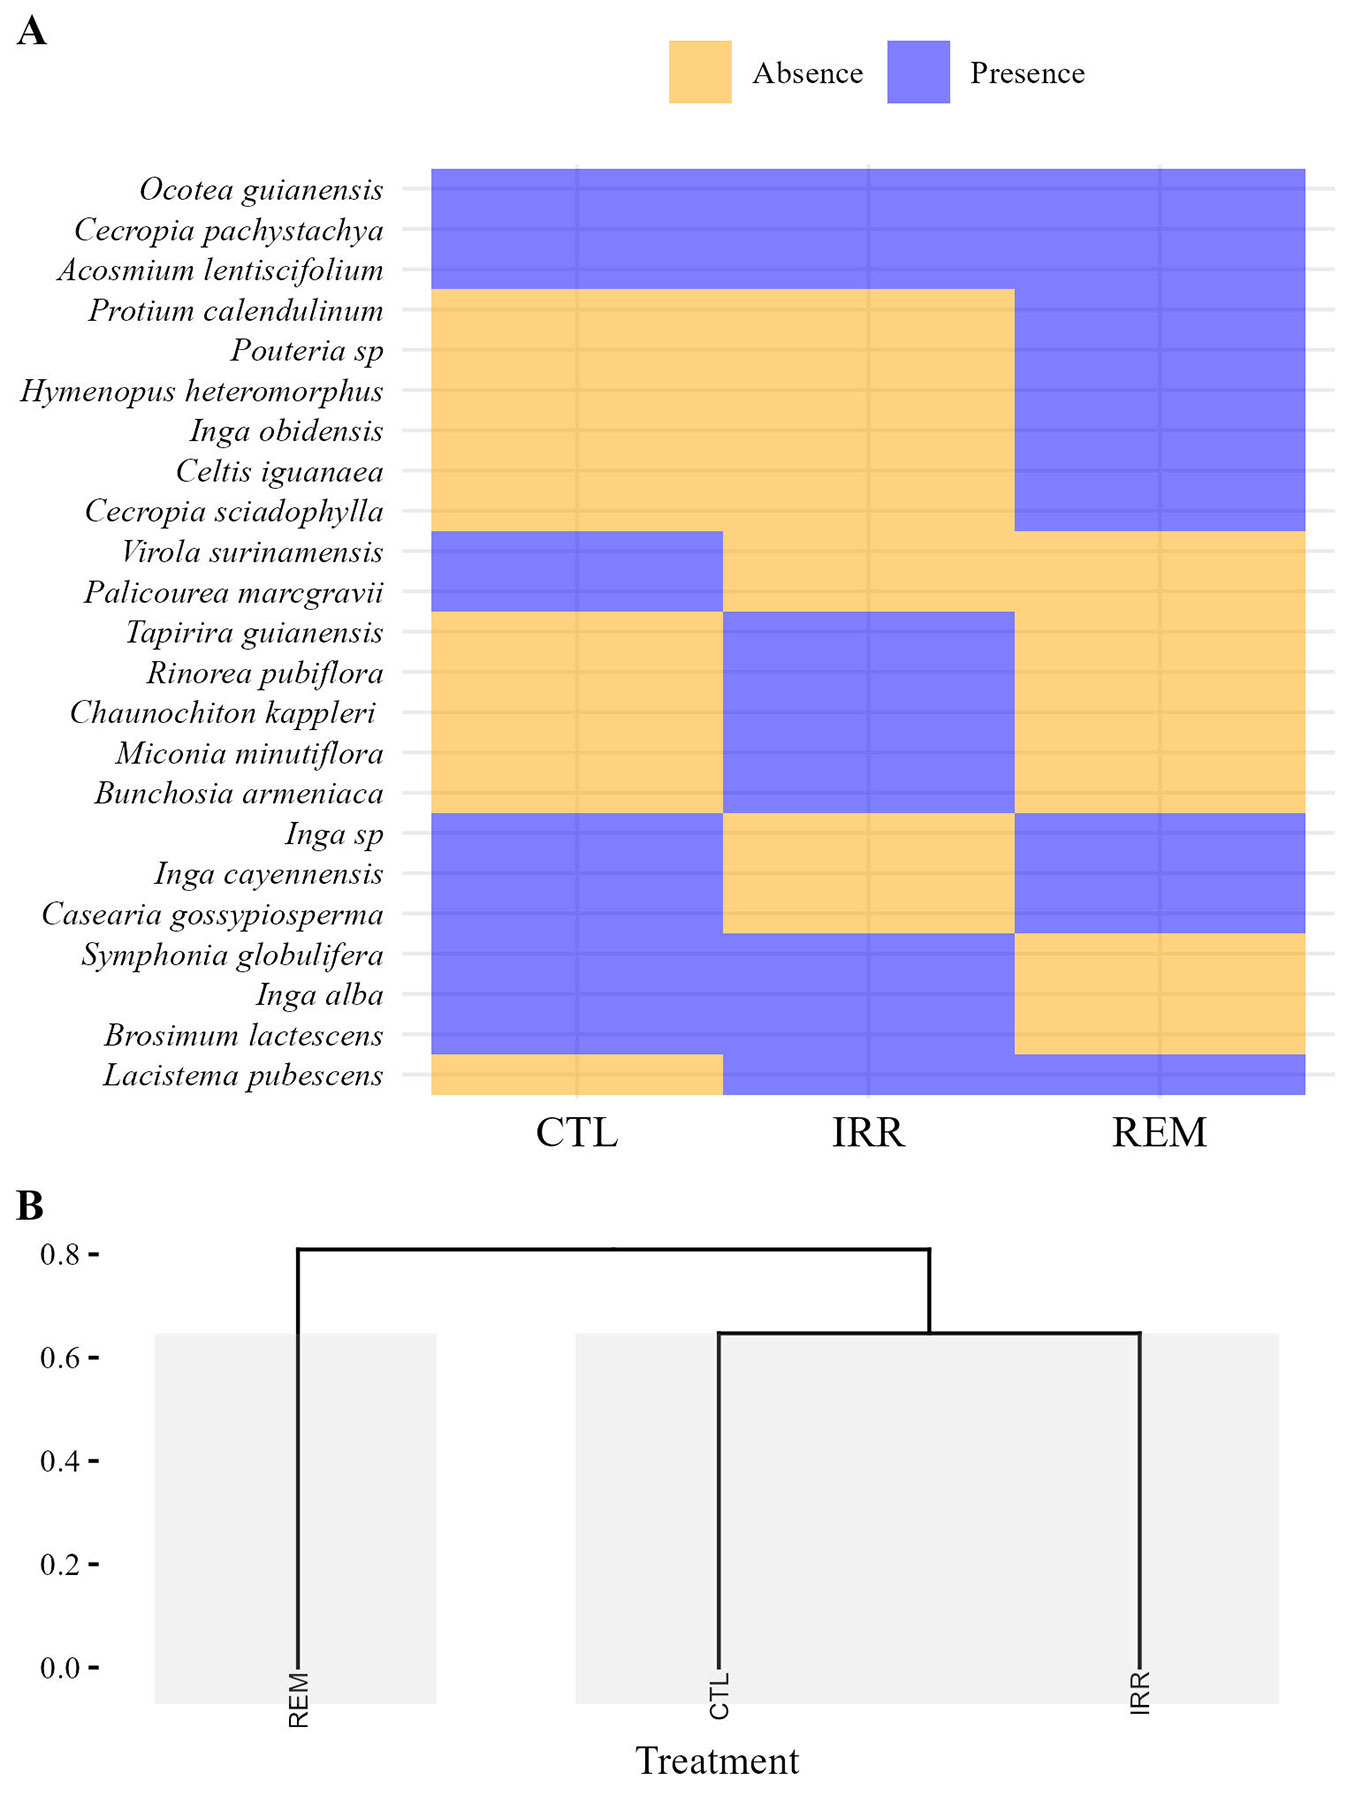
Fig. 4 - Average ± standard deviation (SD) of stand and species density of individuals with CBH ≥ 15 cm (a, b) and NR (c, d) in a fragment of successional forest, 16 years after Water and Nutrient Manipulation in a Successional Forest in the Eastern Amazonia project (MANFLORA). (CTL): Control; (IRR): Irrigation; (REM): Nutrient Removal; (ns): no significant difference between treatments for both stand and species density. Dots represent the species or individual density in sample units of the respective treatments.
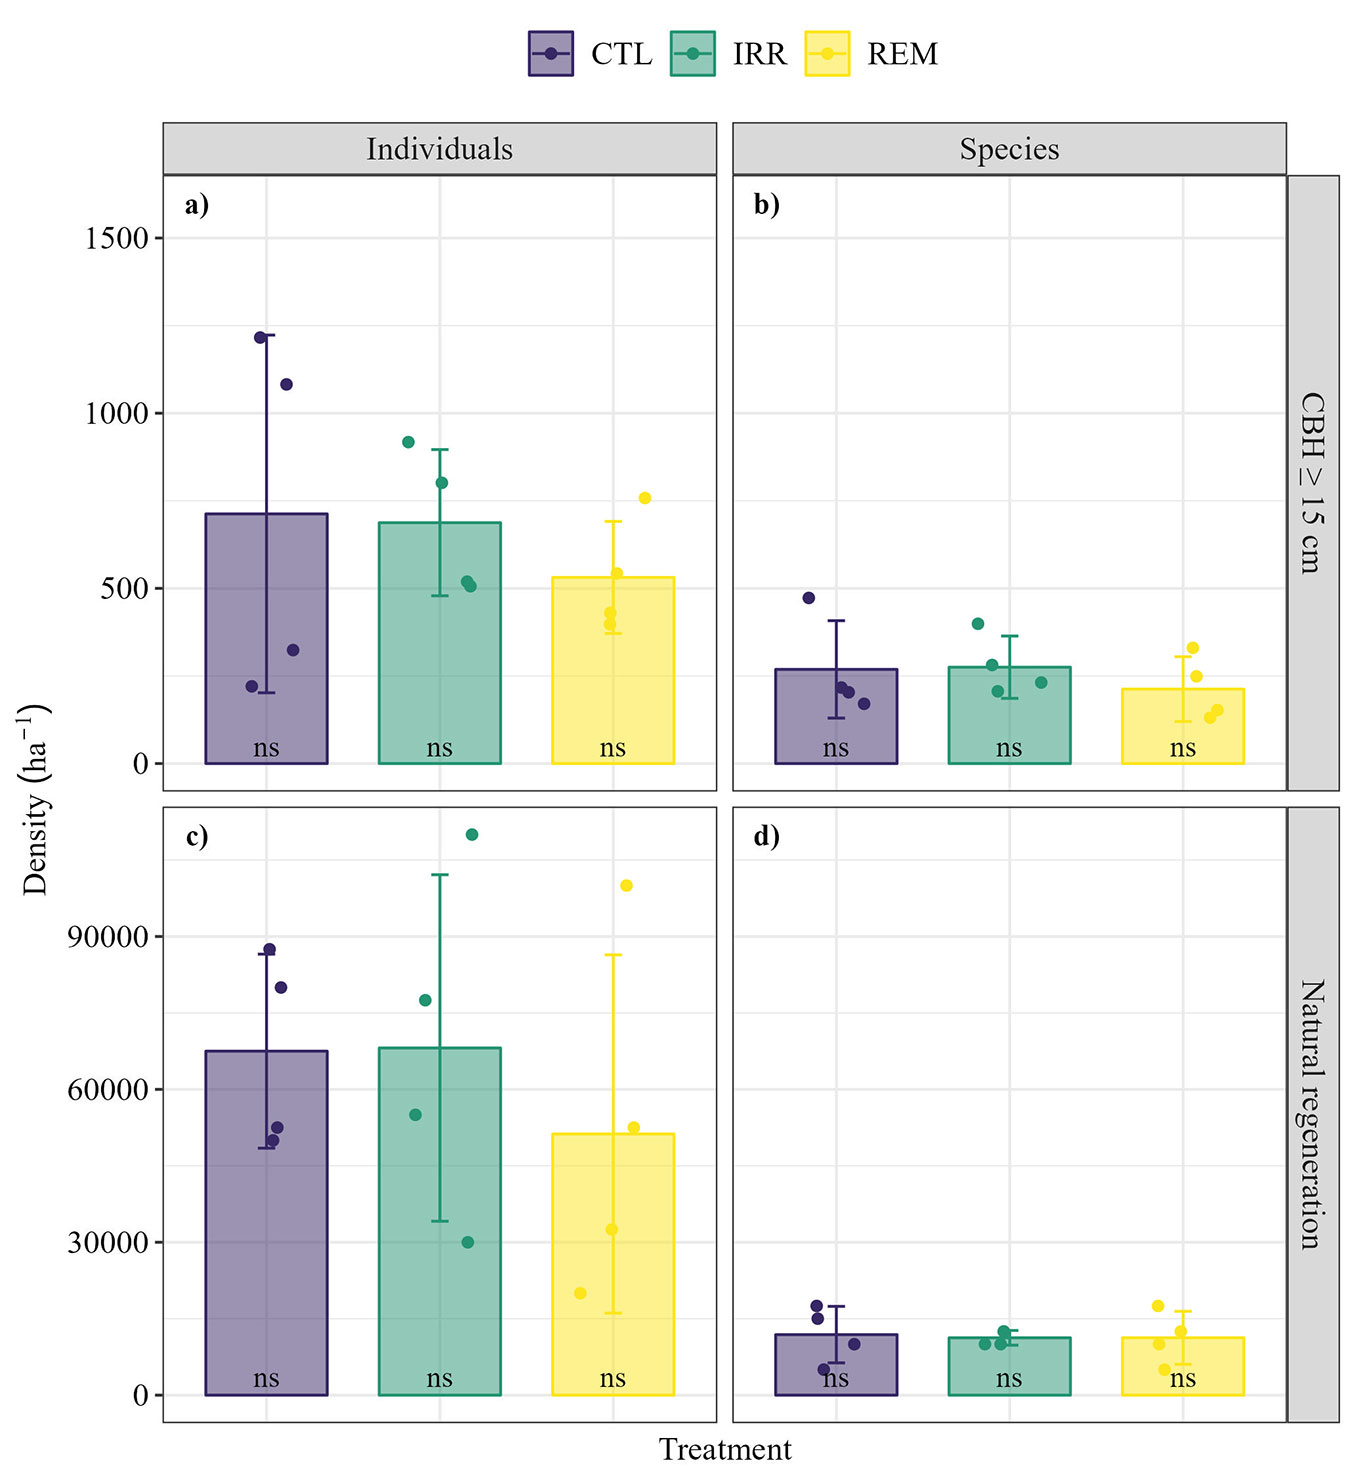
Stand density ranged from 531.25 ± 159.92 (standard deviation, SD) to 712.50 ± 510.51 individuals per hectare in REM and CTL, respectively (Fig. 4a), while for species, density ranged from 212.50 ± 92.42 to 275.00 ± 88.98 species per hectare for REM and IRR, respectively (Fig. 4b). However, in both cases, no significant differences were observed between treatments (p > 0.05 - Fig. 4). In terms of NR, there were no statistically significant differences either, with species density ranging from 11.250 ± 1.443 to 11.875 ± 5.443 species per hectare for IRR and CTL, respectively (Fig. 4c), and stand density ranging from 51.250 ± 35.148 to 68.125 ± 33.966 individuals per hectare for REM and IRR, in that order (Fig. 4d).
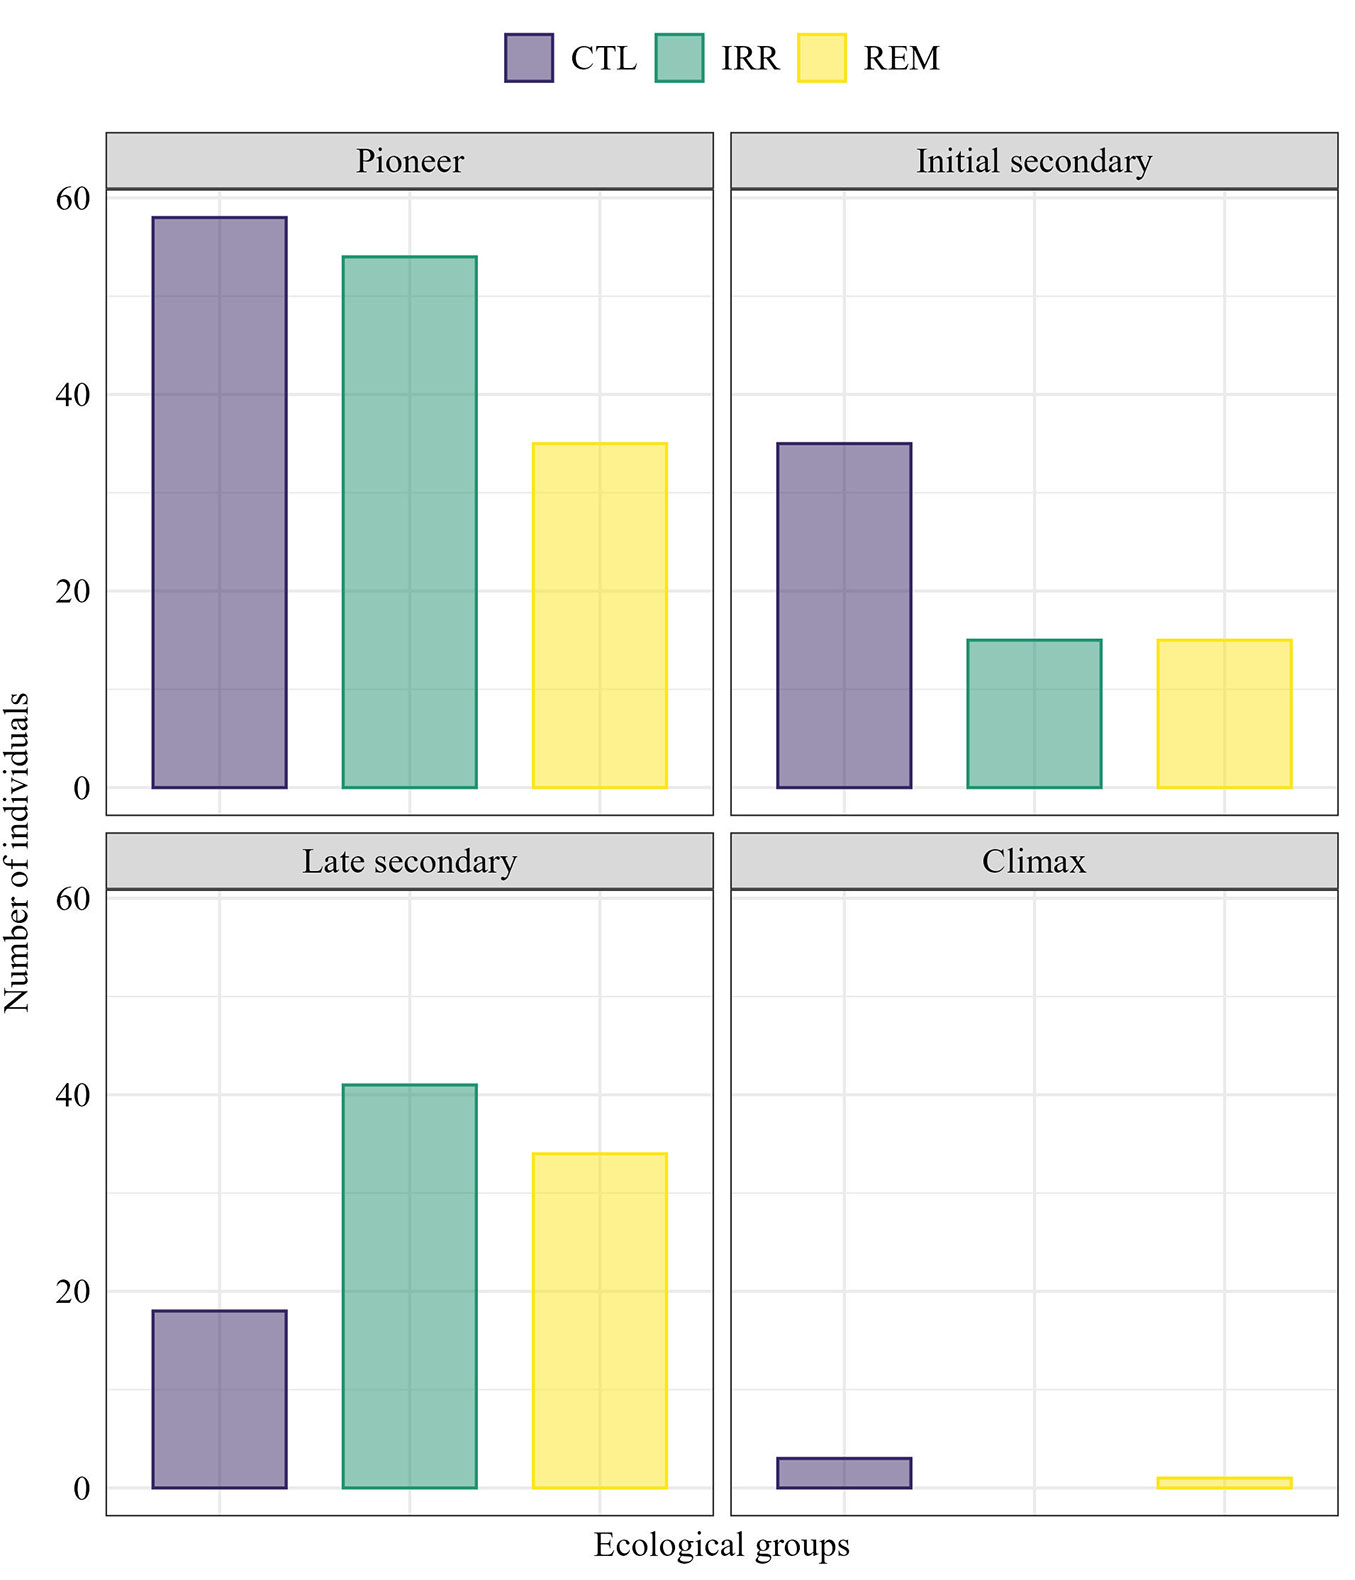
Pioneer species were predominant in CTL and IRR (Fig. 5). In the group of initial secondary species, most individuals (53.85%) corresponded to CTL. In contrast, IRR (44.09%) and REM (36.56%) had the highest proportion of individuals belonging to late secondary species (Fig. 5). However, regarding species richness, the GLM results did not indicate significant differences among ecological groups and treatments (Tab. 1). Regarding the conservation status of species, only a species classified as “VU” (Vulnerable) was found in REM and CTL, namely, Couratari guianensis Aubl. with one individual in each treatment. Two species (Platonia insignis Mart. and Couratari stellata A. C. Sm.) had no data registered in the IUCN Red List, and the remaining species found were classified as “LC” (Least Concern).
Fig. 5 - Number of individuals (CBH ≥ 15 cm) for each ecological group in 400 m2 of a successional forest fragment, 16 years after Water and Nutrient Manipulation in a Successional Forest in the Eastern Amazonia project (MANFLORA). (CTL): Control; (IRR): Irrigation; (REM): Nutrient Removal.
Tab. 1 - Generalized Linear Model (GLM) of Poisson explaining species richness of ecological groups in a successional forest fragment, 16 years after Water and Nutrient Manipulation in a Successional Forest project in the Eastern Amazonia project (MANFLORA). The predictor attributes were richness, treatments, and ecological groups. (IRR): Irrigation; (REM): Nutrient Removal.
| Coefficients | Estimate | Std. Error | z value | Pr (>|z|) |
|---|---|---|---|---|
| (Intercept) | -0.519 | 0.975 | -0.533 | 0.594 |
| [Treatment] IRR | -0.056 | 0.431 | -0.131 | 0.896 |
| [Treatment] REM | -0.167 | 0.434 | -0.385 | 0.701 |
| [Ecological group] Pioneers | 1.938 | 1.007 | 1.925 | 0.054 |
| [Ecological group] Initial secondary | 1.687 | 1.019 | 1.655 | 0.098 |
| [Ecological group] Late secondary | 1.808 | 1.013 | 1.785 | 0.074 |
Alpha diversity
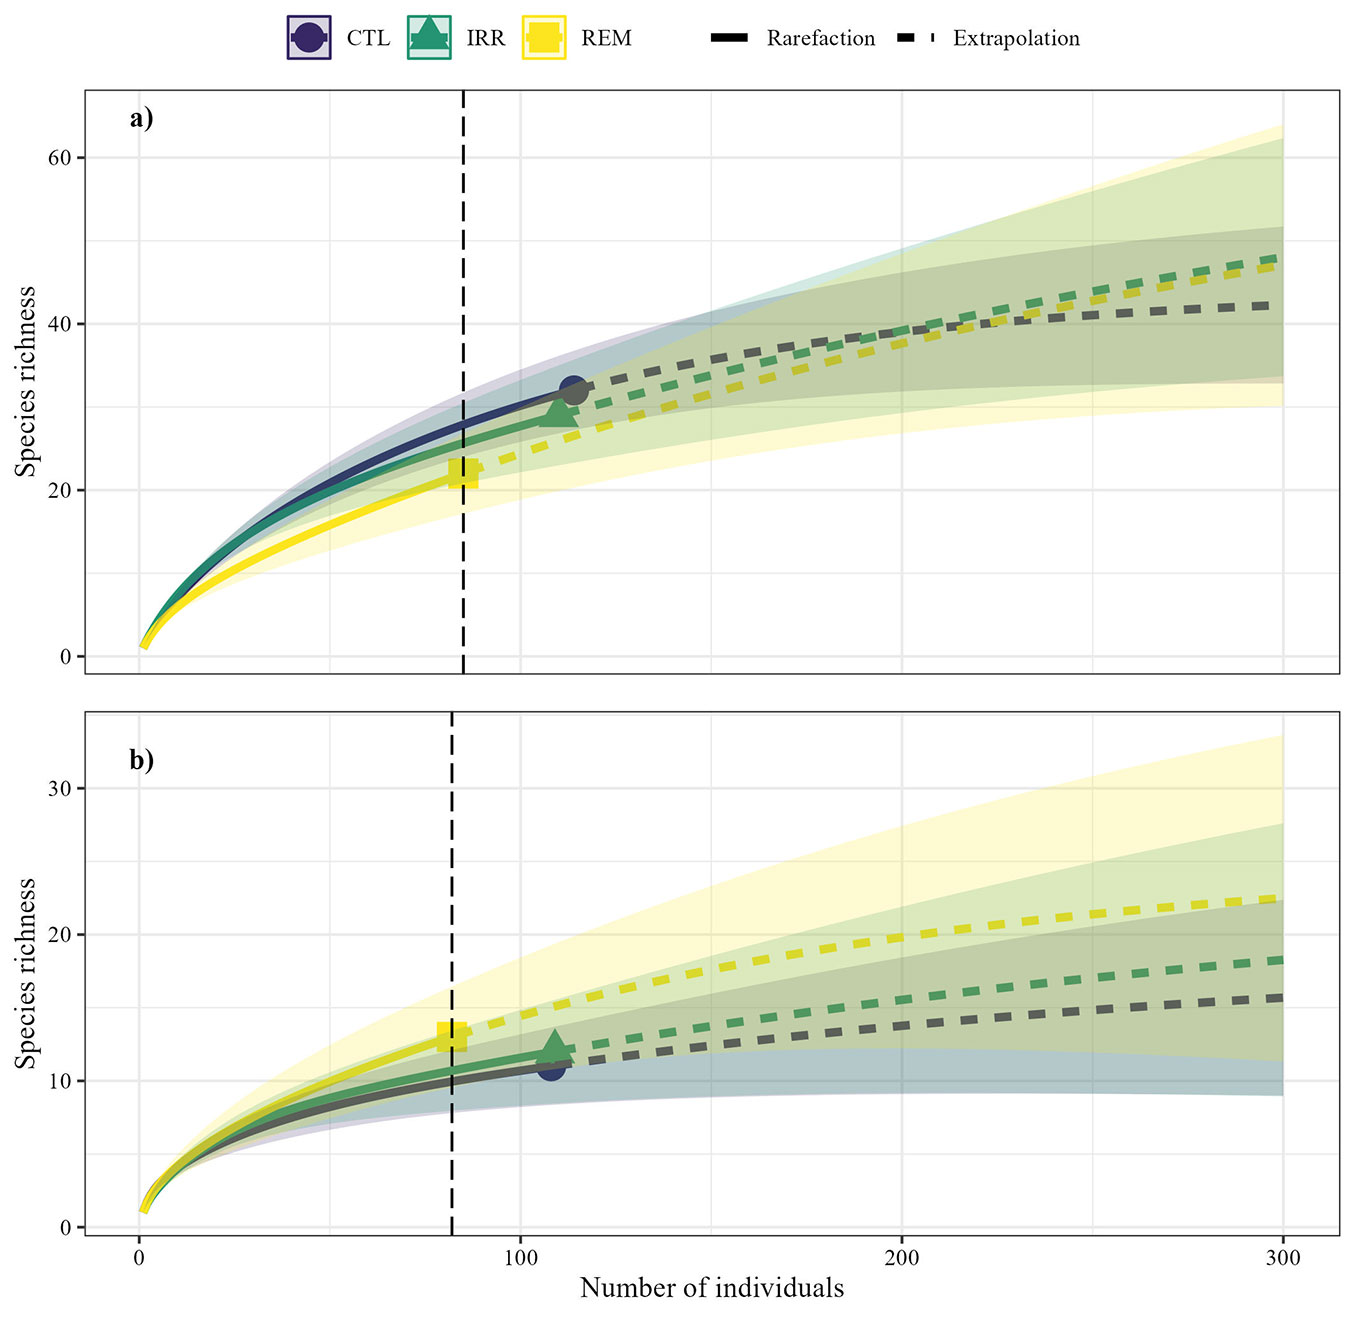
The overlap of confidence intervals in the rarefaction and extrapolation curves indicated similarity in species richness in both assessments (Fig. 6). Similarly, the alpha diversity indices of Margalef, Simpson, and Pielou were similar between CTL, REM, and IRR, while REM had the lowest Shannon diversity (Tab. 2).
Fig. 6 - Rarefaction curves based on samples in a secondary forest fragment, 16 years after Water and Nutrient Manipulation in a Successional Forest in the Eastern Amazonia project (MANFLORA). Considering only individuals ≥ 15 cm in CBH cm (a) and individuals from the natural regeneration (b). Solid lines represent the average of species richness observed, while dashed lines are the estimated species richness. The vertical line parallel to the y-axis corresponds to the rarefied species richness, calculated based on the number of individuals from the ecosystem with the lowest abundance. Shaded areas represent 95% confidence intervals. Control (CTL), Irrigation (IRR), Nutrient Removal (REM).
Tab. 2 - Alpha diversity measures for species with individuals ≥ 15 cm in CBH and natural regeneration in a successional forest fragment, 16 years after Water and Nutrient Manipulation in a Successional Forest project in the Eastern Amazonia project (MANFLORA). (CTL): Control; (IRR): Irrigation; (REM): Litter removal.
| Treatment | Margalef | Simpson | Shannon | Pielou |
|---|---|---|---|---|
| CTL | 0.18 | 0.89 | 2.84 | 0.76 |
| IRR | 0.16 | 0.87 | 2.73 | 0.76 |
| REM | 0.19 | 0.86 | 2.52 | 0.73 |
Horizontal and vertical structure
In all treatments, Myrcia fallax (Rich.) DC. showed the highest relative density and natural regeneration (Tab. 3). Lacistema pubescens Mart. showed a low IVI in IRR only (Tab. 3). After M. fallax, Cecropia pachystachya Trécul contributed the most to NR in all treatments. Among the species with the highest EIVI, five (M. fallax, Ocotea guianensis Aubl., L. pubescens, Guatteria poeppigiana Mart.) were common across all treatments. Tapirira guianensis Aubl. was exclusive to the treatments with resource changes, and Annona exsucca D.C. was among the highest EIVI only for CTL and IRR (Tab. 3).
Tab. 3 - Top ten species with the highest Importance Value Index (IVI) and Expanded Importance Value Index (EIVI) in a successional forest fragment, 16 years after the experiment termination: Control (CTL), Irrigation (IRR), and Litter Removal (REM) from the Water and Nutrient Manipulation in a Successional Forest in the Eastern Amazonia project (MANFLORA). (RDen): Relative Density (%); (RDom): Relative Dominance (%); (RFreq): Relative Frequency (%); (RSP): Relative Sociological Position (%); (RNR): Relative Natural Regeneration (%).
| Treatment | Species | RDen | RDom | RFreq | IVI | RSP | RNR | EIVI |
|---|---|---|---|---|---|---|---|---|
| CTL | Myrcia fallax | 23.87 | 0.26 | 6.45 | 10.19 | 21.74 | 40.57 | 18.58 |
| Cecropia pachystachya | 12.61 | 0.19 | 6.45 | 6.41 | 14.58 | 24.78 | 11.72 | |
| Lacistema pubescens | 14.86 | 14.38 | 4.84 | 11.36 | 16.25 | 0.00 | 10.07 | |
| Ocotea guianensis | 4.95 | 8.53 | 4.84 | 6.11 | 5.26 | 10.22 | 6.76 | |
| Cupania scrobiculata | 5.86 | 4.61 | 4.84 | 5.10 | 5.84 | 0.00 | 4.23 | |
| Connarus perrottetii var. angustifolius | 3.15 | 9.63 | 3.23 | 5.34 | 2.72 | 0.00 | 3.75 | |
| Annona exsucca | 3.60 | 7.83 | 3.23 | 4.89 | 2.78 | 0.00 | 3.49 | |
| Palicourea marcgravii | 2.25 | 0.33 | 3.23 | 1.94 | 2.60 | 6.07 | 2.90 | |
| Annona paludosa | 1.35 | 3.15 | 4.84 | 3.11 | 1.56 | 0.00 | 2.18 | |
| Guatteria poeppigiana | 1.35 | 5.54 | 3.23 | 3.37 | 0.17 | 0.00 | 2.06 | |
| IRR | Myrcia fallax | 31.05 | 0.07 | 5.00 | 12.04 | 23.95 | 54.03 | 22.82 |
| Pourouma guianensis | 10.50 | 8.66 | 6.67 | 8.61 | 12.56 | 0.00 | 7.68 | |
| Ocotea guianensis | 5.02 | 14.05 | 5.00 | 8.02 | 4.93 | 5.73 | 6.95 | |
| Lacistema pubescens | 6.85 | 5.34 | 6.67 | 6.29 | 7.75 | 2.26 | 5.77 | |
| Cecropia pachystachya | 5.02 | 0.46 | 5.00 | 3.49 | 6.61 | 10.02 | 5.42 | |
| Amphiodon effusus | 4.57 | 14.83 | 1.67 | 7.02 | 5.17 | 0.00 | 5.25 | |
| Tapirira guianensis | 5.48 | 3.12 | 3.33 | 3.98 | 6.37 | 6.73 | 5.01 | |
| Annona exsucca | 3.20 | 6.10 | 5.00 | 4.77 | 2.95 | 0.00 | 3.45 | |
| Guatteria poeppigiana | 2.74 | 5.83 | 5.00 | 4.52 | 1.51 | 0.00 | 3.02 | |
| Brosimum lactescens | 2.28 | 0.20 | 3.33 | 2.91 | 3.00 | 5.73 | 2.91 | |
| REM | Myrcia fallax | 27.54 | 0.94 | 6.12 | 11.53 | 12.94 | 43.73 | 18.26 |
| Lacistema pubescens | 17.96 | 32.20 | 8.16 | 19.44 | 10.66 | 2.71 | 14.34 | |
| Ocotea guianensis | 10.18 | 35.67 | 6.12 | 17.32 | 2.58 | 2.88 | 11.49 | |
| Cecropia pachystachya | 9.58 | 0.06 | 6.12 | 5.25 | 6.13 | 18.85 | 8.15 | |
| Guatteria poeppigiana | 4.79 | 4.35 | 6.12 | 5.09 | 1.94 | 0.00 | 3.44 | |
| Inga obidensis | 2.40 | 0.01 | 4.08 | 2.16 | 1.53 | 7.10 | 3.02 | |
| Cupania scrobiculata | 4.79 | 2.03 | 4.08 | 3.63 | 2.79 | 0.00 | 2.74 | |
| Casearia gossypiosperma | 3.59 | 0.13 | 2.04 | 1.92 | 2.30 | 5.63 | 2.74 | |
| Inga flagelliformis | 2.40 | 2.05 | 6.12 | 3.52 | 0.97 | 0.00 | 2.31 | |
| Tapirira guianensis | 1.20 | 3.52 | 4.08 | 2.93 | 0.20 | 0.00 | 1.80 |
Discussion
Understanding how resource management affects the long-term floristic composition and vegetation structure is crucial in the current context, given the urgent need to maintain the dynamics of secondary forests and optimize tropical forest restoration. Our initial hypothesis that periodic irrigation and nutrient reduction alter the floristics and structure of a secondary forest was partially supported, as residual effects of the treatments were evident only in species composition. This addresses the scientific question of the study and highlights the ecosystem’s structural resilience in the medium term.
Resource management and its influence on forest resilience
Although water deficit can reduce evapotranspiration rates by up to 20% in fragmented forest ecosystems ([32]) and is closely related to the loss of structural attributes of the ecosystem, such as above-ground biomass and soil density ([1]), our results showed that periodic irrigation and the reduction of nutrients through leaf litter removal had no residual effects on vegetation structure after 16 years. This is likely due to the greater tolerance of Amazonian tree species to edaphoclimatic changes ([18]). It is worth noting that pioneer species (i.e., early colonizers) are characterized by a strategy of rapid dispersal and reproduction. They maintain dominance in the first 20 years after a disturbance and can even interrupt succession when they hyper-dominate the ecosystem ([19]). In this study, although there were many pioneer species, a balance was achieved with species from other groups, especially late successional species, which showed a higher abundance in the treatments with resource manipulation.
The time required for the complete restoration of floristic composition in tropical forests remains a significant challenge for scientific research. Factors such as topography, climate, seed availability, and dispersion interfere with the restoration of forest diversity ([40]). However, the pattern revealed by the cluster dendrogram showed that soil nutrient availability can directly influence the long-term development of naturally regenerated individuals, probably because they require more nutrients to develop during the seedling stage. The similarity between CTL and IRR in floristic composition can be attributed to the efficient use of water by Amazonian trees ([18]), as the distribution of individuals may have been influenced by soil water availability. This finding is similar to the results reported by Kupers et al. ([28]), suggesting that inadequate irrigation may have compelled individual trees to optimize their water usage. This is particularly significant in tropical secondary forests, where nutrient manipulation impacts the above-ground productivity ([49]).
AGB values detected in this study support the evidence that human disturbances are the primary drivers of biomass reduction in tropical secondary forests, primarily due to the regeneration of low wood density species, such as pioneer and early secondary species ([6]). In secondary forests, biomass accumulation is influenced by a wide range of environmental conditions ([42]). Most species have low wood density, due to their rapid growth and little investment in radial structure ([3]), resulting in a lower potential for carbon storage in their tissues; for example, M. fallax had the highest EIVI in CTL, IRR, and REM. The predominance of this species may be related to its biological characteristics, including high dispersal efficiency and rapid colonization, allowing widespread regeneration in disturbed ecosystems. Furthermore, its antifungal and antibacterial properties promote the germination of its seeds ([20]).
The return of biomass is gradual, even with resource management
In tropical secondary forests, structural and compositional variables are key predictors of AGB accumulation, as highlighted by Villa et al. ([47]). Although compositional differences were observed, we found a similar forest structure among the treatments, indicating that the recovery of carbon stocks in ecosystems can be attributed to the rapid growth of native tree species, which leads to increased litterfall, organic carbon, and below-ground biomass ([41]).
The findings of the present study may also be related to the high abundance of thin individuals, characterized by low biomass and carbon stock. This is a feature of ecosystems in post-shifting cultivation ([48]). In addition, the presence of genera like Inga, Pourouma, and Cecropia, among the species with the highest IVI in all treatments, indicates that the studied ecosystem is still in a successional stage, as these species are indicators of disturbed ecosystems ([19]). Secondary forests can take up to a century to reach a carbon stock above-ground similar to that of primary forests. In forests subject to repeated burns, the rate of carbon accumulation recovery is 75% lower than in native forests and stabilizes between 11 and 40 years ([22]). The AGB tends to decrease with disturbance intensity and increase with the canopy cover of surrounding trees ([42]).
Conclusion
Carbon sequestration contributes to achieving the goals of reducing carbon emissions to the atmosphere as established in large-scale agreements such as the Bonn Challenge and the New York Declaration on Forests.
No significant effects of resource management on the structure of the secondary forest were identified 16 years after the completion of the MANFLORA experiment, highlighting the structural resilience of the ecosystem and tropical forests. However, the litter nutrient removal had long-term effects on floristic composition, suggesting that soil nutrient availability is a critical factor for floristic recovery in secondary forests.
Acknowledgment
This study was financed in part by the CAPES - Coordenação de Aperfeiçoamento de Pessoal de Nível Superior, Brazil - Finance Code 001. CAPES granted a master scholarship for JIMR (Process 88887.716287/2022-00), HFCP (Process 88887.805686/2023-00) and doctoral scholarship for VPO (Process 88887.644953/2021-00). The Ecosystem and Watershed Management Laboratory at the Federal Rural University of Amazonia served as the basis for processing data and samples.
References
Gscholar
CrossRef | Gscholar
CrossRef | Gscholar
CrossRef | Gscholar
Gscholar
Online | Gscholar
CrossRef | Gscholar
CrossRef | Gscholar
CrossRef | Gscholar
Gscholar
CrossRef | Gscholar
Gscholar
CrossRef | Gscholar
Gscholar
Gscholar
CrossRef | Gscholar
Online | Gscholar
CrossRef | Gscholar
CrossRef | Gscholar
Authors’ Info
Authors’ Affiliation
Walmer Bruno Rocha Martins 0000-0001-8795-1703
Hiago Felipe Cardoso Pacheco 0000-0002-1920-0227
Francisco de Assis Oliveira 0000-0002-3872-8342
Gustavo Schwartz 0000-0002-1717-4491
Graduate Program in Forestry Science, Av. Presidente Tancredo Neves, 2501, Belém, Pará, 66077-530 (Brazil)
Federal Rural University of Amazonia, Tv. Pau Amarelo, Capitão Poço, Pará, 68650-000 (Brazil)
National Institute of Amazonia Research, Av. Constelação Cruzeiro do Sul, Manaus, Amazonas, 69060-062 (Brazil)
Francisco de Assis Oliveira 0000-0002-3872-8342
Federal Rural University of Amazonia, Department of Agrarian Science, Av. Presidente Tancredo Neves, 2501, Belém, Pará, 66077-530 (Brazil)
Embrapa Eastern Amazonia, Tv. Dr. Enéas Pinheiro, Belém, Pará, 66095-903 (Brazil)
Corresponding author
Paper Info
Citation
Rodrigues JIM, Martins WBR, Oliveira VP, Pacheco HFC, Silva JRL, Oliveira FA, Schwartz G (2025). Effects of water surplus over a secondary forest remain after 16 years in the Amazonia. iForest 18: 234-241. - doi: 10.3832/ifor4537-018
Academic Editor
Paola Mairota
Paper history
Received: Dec 05, 2023
Accepted: Apr 03, 2025
First online: Sep 06, 2025
Publication Date: Oct 31, 2025
Publication Time: 5.20 months
Copyright Information
© SISEF - The Italian Society of Silviculture and Forest Ecology 2025
Open Access
This article is distributed under the terms of the Creative Commons Attribution-Non Commercial 4.0 International (https://creativecommons.org/licenses/by-nc/4.0/), which permits unrestricted use, distribution, and reproduction in any medium, provided you give appropriate credit to the original author(s) and the source, provide a link to the Creative Commons license, and indicate if changes were made.

Web Metrics
Breakdown by View Type
Article Usage
Total Article Views: 5615
(from publication date up to now)
Breakdown by View Type
HTML Page Views: 2176
Abstract Page Views: 1667
PDF Downloads: 1598
Citation/Reference Downloads: 0
XML Downloads: 174
Web Metrics
Days since publication: 323
Overall contacts: 5615
Avg. contacts per week: 121.69
Article Citations
Article citations are based on data periodically collected from the Clarivate Web of Science web site
(last update: Mar 2025)
(No citations were found up to date. Please come back later)
Publication Metrics
by Dimensions ©
Articles citing this article
List of the papers citing this article based on CrossRef Cited-by.
Related Contents
iForest Similar Articles
Short Communications
Towards cost-effective indicators to maintain Natura 2000 sites in favourable conservation status. Preliminary results from Cansiglio and New Forest
vol. 1, pp. 75-80 (online: 28 February 2008)
Research Articles
Application of indicators network analysis to support local forest management plan development: a case study in Molise, Italy
vol. 5, pp. 31-37 (online: 27 February 2012)
Research Articles
Enhancing forest biodiversity indicators in inventories through harmonized protocols
vol. 18, pp. 109-120 (online: 20 May 2025)
Research Articles
Bird response to forest structure and composition and implications for sustainable mountain forest management
vol. 19, pp. 18-27 (online: 11 January 2026)
Commentaries & Perspectives
The role of plant sociology in the study and management of European forest ecosystems
vol. 6, pp. 55-58 (online: 21 January 2013)
Research Articles
Early responses of biodiversity indicators to various thinning treatments in mountain beech forests
vol. 11, pp. 609-618 (online: 25 September 2018)
Research Articles
A new zoning index for detecting areas of biological importance applied to a temperate forest in Central Mexico
vol. 16, pp. 253-261 (online: 31 August 2023)
Research Articles
Indicators for the assessment and certification of cork oak management sustainability in Italy
vol. 11, pp. 668-674 (online: 04 October 2018)
Research Articles
Consistency among forest structure and biodiversity potential index (IBP): an assessment of stand structural complexity for floodplain poplar woodlands
vol. 18, pp. 335-343 (online: 04 November 2025)
Research Articles
An index of structural complexity for Apennine beech forests
vol. 8, pp. 314-323 (online: 03 September 2014)
iForest Database Search
Search By Author
Search By Keyword
Google Scholar Search
Citing Articles
Search By Author
Search By Keywords
PubMed Search
Search By Author
Search By Keyword


