Evaluation of estimation methods for fitting the three-parameter Weibull distribution to European beech forests
iForest - Biogeosciences and Forestry, Volume 15, Issue 6, Pages 484-490 (2022)
doi: https://doi.org/10.3832/ifor4145-015
Published: Dec 01, 2022 - Copyright © 2022 SISEF
Research Articles
Abstract
We evaluated three estimation methods for fitting the three-parameter Weibull distribution to even-aged European beech (Fagus sylvatica) forests by using experimental tree diameter data collected in 3709 sample plots (500 m2 each). The maximum likelihood estimation method (MLE), the method of moments (MOM) and the method of modified moments type 1 (MM1) were applied for fitting the Weibull function. The goodness-of-fit of stand parameters (total tree number, stand basal area, dominant stand diameter and mean quadratic diameter) was tested by MAE and RMSE, and the probability and cumulative density functions of trees per 5 cm diameter classes were additionally tested by the Kolmogorov-Smirnov test and compared with Kolmogorov-Smirnov’s D statistic. All three methods are suitable for estimating stand parameters based on the fitted Weibull function. Fitting the diameter distribution per 5 cm diameter classes at the plot level was less accurate due to the low number of trees or irregular diameter distribution of trees. The MM1 method was found to be the most suitable for fitting the three-parameter Weibull distribution to beech forests represented by data derived from small plots.
Keywords
Diameter Distribution Fitting, Weibull Function, Parameter Estimation, Inventory Data, Circular Sample Plots, Near-natural Forests, Fagus Sylvatica, Slovenia
Introduction
Tree diameter distribution is a key piece of information about forest stand structure ([30]) which forest managers use to evaluate recent forest management and make decisions about further silvicultural treatments ([6], [3]). Tree diameter distribution is integrated into several individual-tree and stand growth models ([33], [29], [13], [38]). In stand models, parameters of tree diameter distribution are often determined by regressions ([6]) in which easily measured stand parameters, such as stand basal area (BA), mean stand diameter and total number of trees (N), are used as explanatory variables ([22], [33]).
The tree diameter distribution of forest stands is described either by the frequency of trees per diameter class or by estimated parameters of the theoretical distribution ([16]). Theoretical tree diameter distributions can be defined based on the number of trees per diameter class ([7]) or the BA of trees per diameter class ([15], [37]). Fitting the diameter distribution with the BA of trees provides better access to the right part of the distribution, representing large-sized (and more valuable) trees, while fitting with N provides better fitting at the left part of distribution (i.e., small-sized trees).
Several distribution functions have been used for fitting diameter distribution to forest stands, including exponential, beta, normal, lognormal, Johnson’s SB, Weibull and others ([25]). Since its introduction by Bailey & Dell ([2]), the Weibull distribution ([43]) has been widely used in forest science due to its flexibility, the relative simplicity of parameter estimation, and its closed cumulative density functional form. The Weibull distribution function describes a wide range of unimodal distributions from reversed-J shaped to exponential and normal ([2]). Its special feature is the independency of its parameters, at least at the particular position of the 63.2th percentile ([9], [44]). Since this percentile strongly correlates with the quadratic mean diameter (QMD) of monospecific and regular stands as an easily obtained stand parameter ([33]), the Weibull function has often been applied for fitting diameter distribution to forest stands. However, Weibull distribution has often been applied in plantations or densely planted forest stands ([2], [7], [19], [32]) and much less frequently in natural forests. In Europe, the Weibull distribution has been fitted for pure ([31], [22], [33]) and mixed stands ([20], [37]).
Different estimation methods can be applied to fit the Weibull distribution ([46], [19], [14]). Maximum likelihood estimation (MLE) is the most common method used in forestry ([33], [32]), while the method of moments (MOM - [19]) or Bayes estimation ([41]) have been applied rather less frequently. For estimating parameters of diameter distribution functions, which is the first step in developing a stand model ([32]), it is important to employ an adequate estimation method. However, studies on evaluating estimation methods for fitting the Weibull distribution are quite limited ([46], [19], [11], [39], [1]), and clear procedures and criteria for defining the most appropriate method are lacking.
Estimation methods for fitting Weibull distributions have mainly been evaluated based on generated data ([21], [14], [8], [39], [27], [1]), while comparative studies based on empirical data are less frequent. They have been conducted in pine plantations ([19], [39]), spruce-fir forests ([46]) and pine forests ([11]), but comparative studies in broadleaved forests are lacking. European beech (Fagus sylvatica L., hereafter beech) is one of the most common trees species in Central Europe ([4]). To our knowledge there is no evidence regarding which estimation method is the most appropriate for fitting the Weibull distribution function to beech forests. Various data sources can be applied for fitting the Weibull function, national forest inventories (NFI) being only one of them. In most European countries, the NFI is an important source of tree data, enabling its possible application to stand modeling ([16]). However, little is known about whether data from small sampling plots are appropriate for the parametrization of the Weibull function ([25], [37]). Therefore, the main objectives of our study were (i) to fit the three-parameter Weibull distribution function to even-aged beech stands based on data from small sampling plots by using three estimation methods; (ii) to estimate the adequacy of the three estimation methods for fitting the Weibull distribution to beech forests; and (iii) to assess the suitability of small circular plot inventory data for fitting diameter distribution to the Weibull function.
Material and methods
We used data from the permanent sampling plots (n ≈ 98.000) of the Slovenia Forest Service ([35]), which are distributed systematically across the forest area of Slovenia. The plots are circular and concentric; trees of 10-29 cm in diameter at breast height (DBH) were measured in 200 m2 plots (radius = 7.98 m), and trees of DBH ≥ 30 cm in 500 m2 plots (radius = 12.62 m). To scale up the number of trees to 1 ha, trees within the respective circles were weighted with a representation factor of 50 or 20. In order to study even-aged beech stands only, we included plots in which the share of beech exceeded 80% of the total BA. Plots with fewer than 10 trees were discarded ([28], [24], [46]). The Gini index is a measure of the structural diversity of forest stands ([10], [17]) and ranges from 0 to 1, where higher values indicate more heterogeneous forest stand structure. We analyzed plots with even-aged stand structure, defined by Gini index < 0.33. The Gini index was calculated using the basal area of individual trees on each plot ([17]). To divide even-sized (even-aged) and uneven-sized stands, k-means cluster analysis was performed, resulting in two clusters divided at the given Gini index of 0.33. To validate such classification, the Sokal Micherer measure of similarity was calculated between the two clusters based on Gini index and the field assessment of stand heterogeneity. The McNemara χ2 test indicated a significant similarity between clusters (p < 0.05); therefore, we adopted 0.33 as an adequate threshold. This was in accordance with the literature, as Duduman ([10]) defined this threshold at 0.35 and O’Hara et al. ([23]) at 0.3.
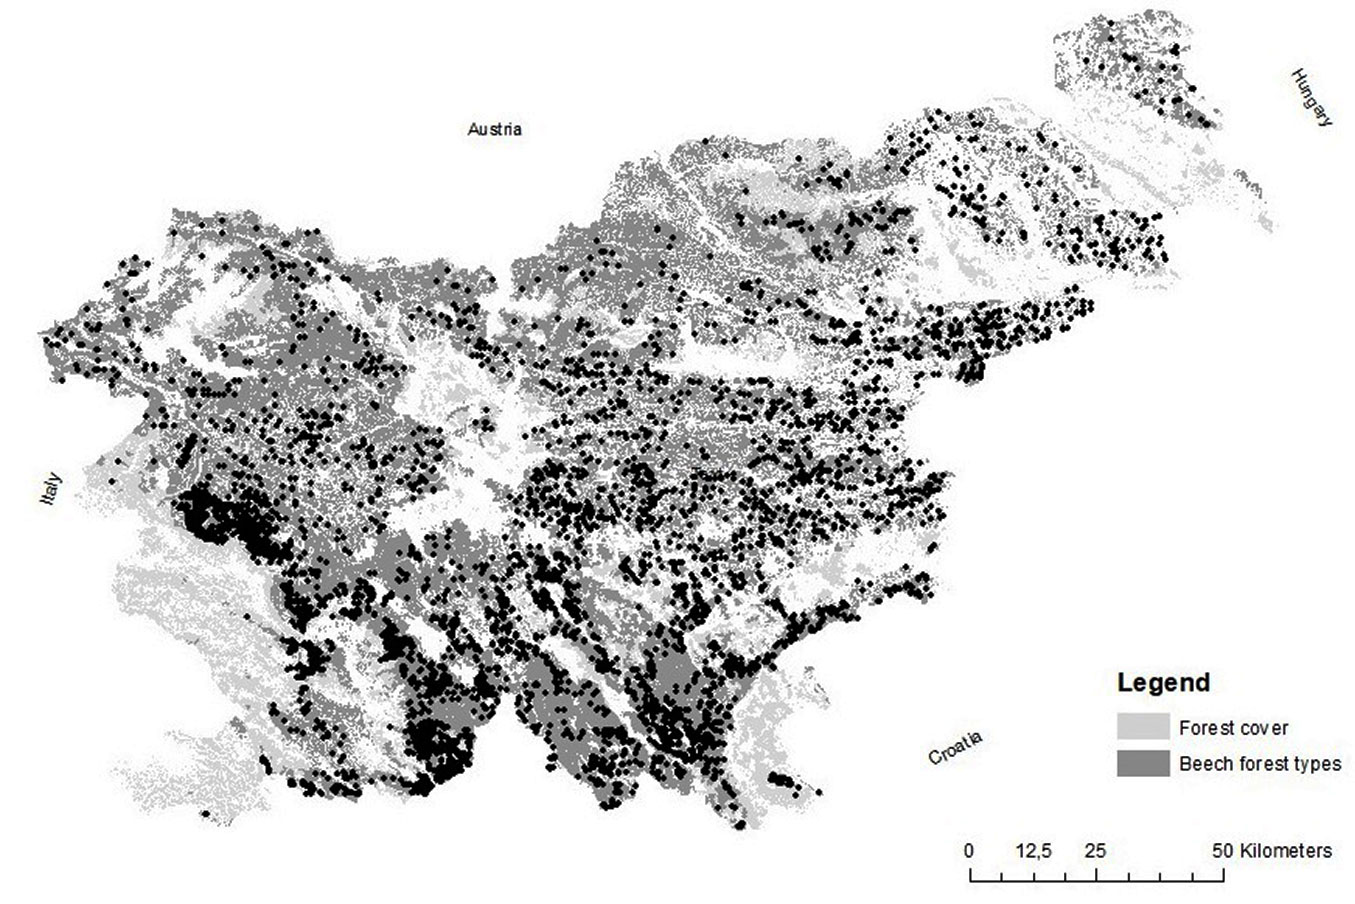
Beech is the main tree species in Slovenian forests, representing 33% of the total growing stock ([35]). The total area of beech forests amounts to approximately 7500 km2, representing 70% of the potential natural forest vegetation in Slovenia (Fig. 1). They are classified into several beech forest types ([5]). The elevation of beech plots ranges from 161 to 1655 m a.s.l. Even-aged beech stands are characterized by relatively high stand BA and large quadratic mean diameter (QMD) and dominant diameter (DDOM - Tab. 1).
Fig. 1 - Location of sample plots (black dots, n = 3709) in beech forests of Slovenia.
Tab. 1 - Stand characteristics of even-aged beech stands (n = 3709). (SD): standard deviation.
| Parameter | Label | Mean | SD | Min | Max |
|---|---|---|---|---|---|
| Number of trees per hectare | N | 540.69 | 207.81 | 230 | 1320 |
| Number of trees per plot | NPL | 16.02 | 4.48 | 10 | 45 |
| Minimum diameter (cm) | DMIN | 11.92 | 3.55 | 10 | 25 |
| Maximum diameter (cm) | DMAX | 51.57 | 8.92 | 20 | 90 |
| Dominant stand diameter (cm) | DDOM | 42.05 | 6.79 | 15.00 | 65.50 |
| Mean quadratic diameter (cm) | QMD | 29.07 | 5.32 | 12.78 | 47.20 |
| Stand basal area (m2 ha-1) | BA | 33.73 | 9.43 | 4.64 | 70.68 |
| Gini index of heterogeneity | Gini | 0.26 | 0.05 | 0.00 | 0.33 |
The three-parameter Weibull function ([43]) was used to characterize the diameter distribution. The probability density function (PDF) has the following form (eqn. 1):
where A, B and C are the location, scale and shape parameters, respectively, and x is the independent variable, i.e., DBH in our study. The location parameter A identifies the lower bound of the diameter distribution, i.e., the minimum diameter ([2]). When the distribution starts at zero, the three-parameter PDF function becomes a two-parameter PDF function. The scale parameter B corresponds to the 63.2th percentile of the distribution ([33]), while parameter C defines the shape of the Weibull distribution ([2]). When C < 1 the distribution is reversed-J-shaped, and when 1 < C < 3.6 the distribution is mound-shaped and positively skewed. When C ≈ 3.6 it is approximately equivalent to the normal distribution, and when C > 3.6 the distribution becomes progressively negatively skewed. The average skewness of all plots (n = 3709) was 0.5, ranging from -1.0 to 4.3, while the average kurtosis was -0.3, ranging from -1.9 to 19.9.
Parameters A, B and C were estimated using three estimation methods: the method of maximum likelihood (MLE), the method of moments (MOM) and the method of modified moments type 1 (MM1) using the R package “ForestFit” ([40]). For each plot, the parameters were iteratively searched. The estimation methods do not always converge ([1]). In order to detect non-convergence of estimates, we cleaned extremely deviated values of parameters A, B and C and predicted BA and N with the method for detecting outliers using the interquartile range ([34] - eqn. 2):
where x is the parameter under observation, q1 and q3 are the first and third quartiles of the distribution of x and IQR is the interquartile range of parameter x. In total, almost 42% of the plots were excluded from the analysis due to the outlier rule. Of this proportion, 28% were excluded due to the extreme deviation of parameters A, B and C and 14% due to extremely deviated BA or N predictions. Most of these plots were excluded due to deviated values obtained by the MLE method. The percentages of excluded plots due to deviated values of Weibull function parameters were 24%, 6% and 7% of the total plot number for the MLE, MOM and MM1 methods, respectively. The final dataset encompassed 3709 sampling plots (Fig. 1).
The three estimation methods for fitting the Weibull function were evaluated based on: (i) the number of excluded plots due to deviated values; (ii) comparison of the observed and predicted values of stand parameters; and (iii) comparison of the observed and predicted values of parameters within DBH classes.
Stand parameters (i.e., N, BA, DDOM and QMD) for the observed and fitted distributions were compared using the mean absolute error (MAE) and the root-mean-square error (RMSE). Since parameter C defines the shape of distribution, we analysed the Pearson’s correlation between the shape parameter C and the Gini index as a measure of stand homogeneity. To test for differences between the fitted and observed diameter distributions for the 5 cm DBH classes, several tests were used: the Kolmogorov-Smirnov (KS) goodness-of-fit test by using the cumulative density function (CDF); KS’s D statistic, which is the maximum difference between empirical and fitted CDF ([48]); and the MAE and RMSE, both based on the PDF for each 5 cm DBH class by using relative frequencies of trees per DBH class, which enabled comparison of plots regardless of the number of trees. Finally, we calculated the mean values of MAE, RMSE and KS’s D statistic for each estimation method. Estimated Weibull distributions from the three analysed methods were illustrated with three plots showing typical distribution: approximately normal, right skewed (reversed-J-shaped) and multimodal distribution. Since stand structure may affect fitting ([20]), we explored the correlation between stand parameters (BA and QMD) and the mean MAE within DBH classes.
Results
The mean values of the Weibull function parameters A and B were quite similar when obtained by the MM1 or MLE method, while MOM gave higher values of parameter A and lower values of parameter B (Tab. 2). The mean values of parameter C, indicating the shape of distribution, exhibited the expected values above 1 when obtained by the MM1 and MOM methods, but not by the MLE method. Pearson’s correlation coefficients between the shape parameter C and the Gini index were -0.130, -0.205 and -0.214 for the MLE, MOM and MM1 methods, respectively (all p < 0.001).
Tab. 2 - Descriptive statistics of the Weibull function parameters estimated by the three methods. (SD): standard deviation.
| Parameter | Method | Mean | SD | Min | Max |
|---|---|---|---|---|---|
| A | MLE | 14.04 | 3.62 | 8.09 | 27.50 |
| MOM | 20.99 | 4.02 | 11.62 | 32.40 | |
| MM1 | 14.25 | 3.56 | 10.78 | 27.50 | |
| B | MLE | 12.57 | 4.31 | 0.14 | 27.62 |
| MOM | 6.36 | 1.96 | 0.28 | 13.77 | |
| MM1 | 13.85 | 4.88 | 0.04 | 27.56 | |
| C | MLE | 0.86 | 0.47 | 0.19 | 2.07 |
| MOM | 1.08 | 0.08 | 0.61 | 1.33 | |
| MM1 | 1.28 | 0.24 | 0.33 | 2.06 |
The differences in N, BA, DDOM and QMD between observed and fitted distributions were quite low for most plots (Tab. 3). The MAE varied between 0.04 and 10.8 m2 ha-1 and 3 to 42 trees ha-1 for BA and N, respectively, when different estimation methods were considered. Differences between observed and fitted values were lower for QMD than for DDOM for all methods. Of all methods, MM1 had the smallest differences between the observed and predicted stand parameters.
Tab. 3 - Goodness-of-fit measures for number of trees (N), stand basal area (BA), quadratic mean diameter (QMD) and dominant stand diameter (DDOM) for the three estimation methods (n = 3709).
| Parameter | Statistics | Method | ||
|---|---|---|---|---|
| MLE | MOM | MM1 | ||
| N | MAE (ha-1) | 41.91 | 21.59 | 2.51 |
| RMSE (ha-1) | 82.17 | 36.48 | 19.51 | |
| BA | MAE (m2 ha-1) | 10.72 | 2.96 | 0.04 |
| RMSE (m2 ha-1) | 15.40 | 3.31 | 0.03 | |
| QMD | MAE (cm) | 6.20 | 1.28 | 0.03 |
| RMSE (cm) | 9.05 | 1.41 | 0.08 | |
| DDOM | MAE (cm) | 6.83 | 7.73 | 3.25 |
| RMSE (cm) | 9.40 | 8.14 | 4.12 | |
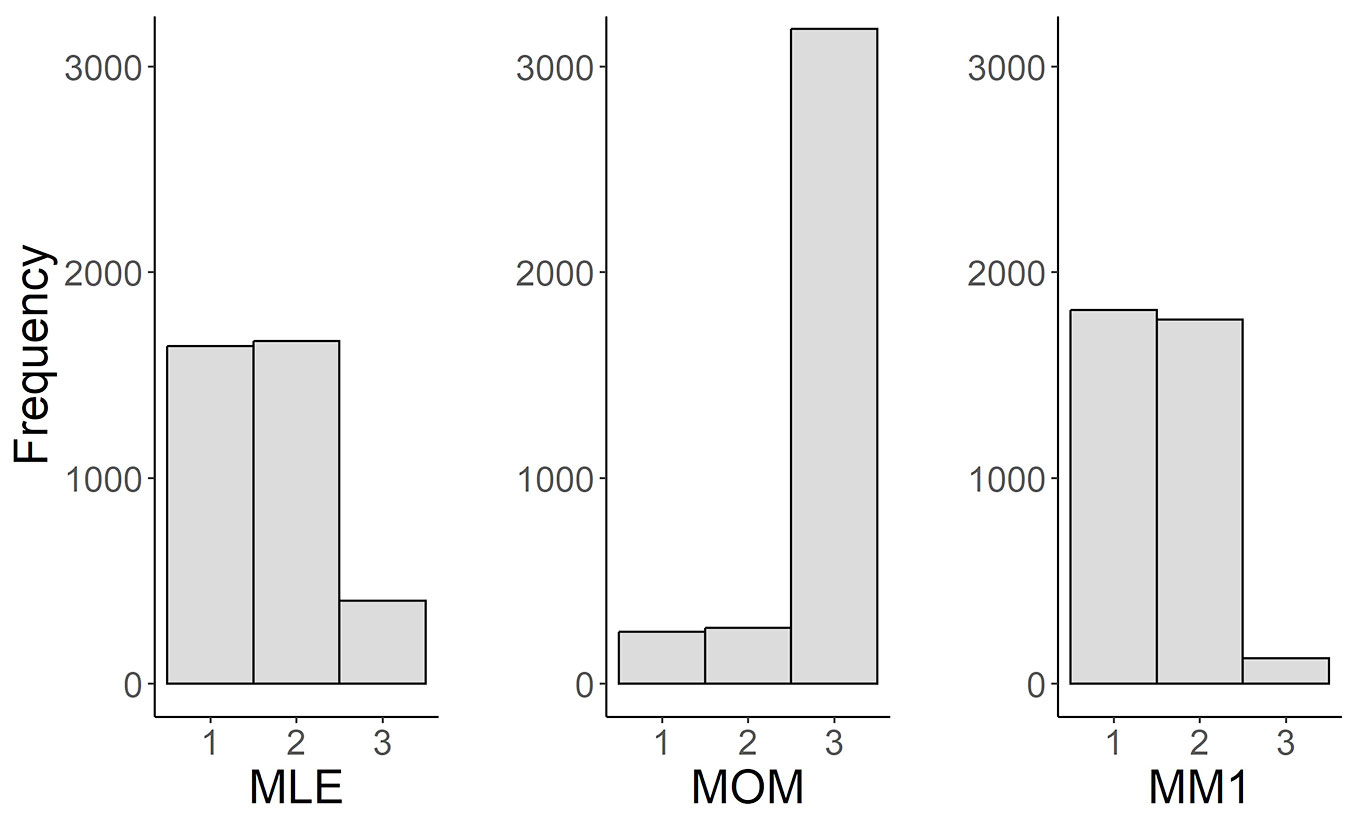
The MM1 method also outperformed the other two methods in goodness-of-fit measures for distributions per DBH class (Tab. 4). When MAE or RMSE were considered, the performance of the MLE method was similar to that of the MM1 method, while the MOM method performed much poorer (Fig. 2, Tab. 4). However, when the MLE method was used, the observed and fitted distributions significantly differed in almost 4% of the plots (KS test, p < 0.05).
Tab. 4 - Goodness-of-fit measures for diameter distributions per 5 cm DBH classes for the three estimation methods. “Different distributions” is the share (%) of plots with significantly different distributions, detected by the KS test (p > 0.05).
| Method | Different distributions (%) |
Mean MAE |
Mean RMSE |
Mean KS’s D statistic |
|---|---|---|---|---|
| MLE | 3.9 | 0.086 | 0.117 | 0.388 |
| MOM | 0.0 | 0.134 | 0.195 | 0.308 |
| MM1 | 0.0 | 0.084 | 0.114 | 0.257 |
Fig. 2 - Ranking of three estimation methods in regard to their performance of fitting the diameter distribution measured by MAE per 5 cm DBH classes (n = 3709). Ranks: the method exhibits the lowest MAE (rank 1), the second lowest MAE (rank 2) and the highest MAE (rank 3).
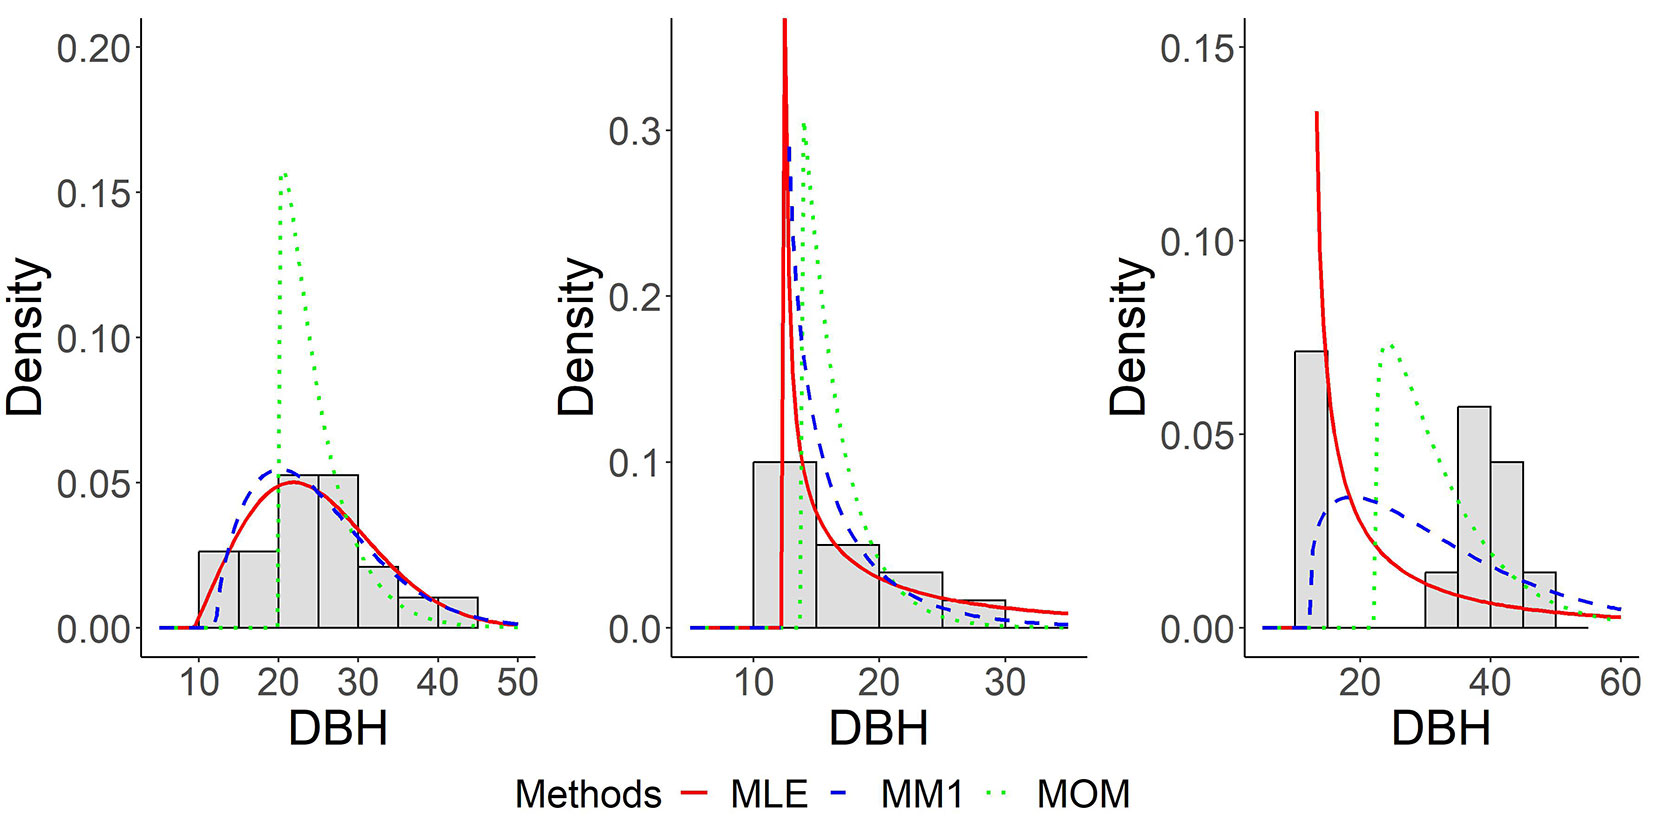
To illustrate the estimated Weibull distributions by using the three different methods, three plots with typical distributions are displayed in Fig. 3. The best fit was detected for the near-normal distribution; in this plot the observed and fitted distributions using MLE and MM1 differed by only 4% on average across DBH classes. Most of the criteria indicated poor fitting for the multimodal distribution. A statistically significant difference (KS test, p < 0.05) between observed and fitted multimodal distributions was detected for MLE only, although the other two methods also poorly fitted the multimodal distribution. However, all methods applied for the multimodal plots appeared to have a better fit to N in comparison to those with a reversed-J-shaped distribution. The MOM method simulated fewer thinner trees in plots with a multimodal distribution in comparison to the other two methods, which is a consequence of a higher value of parameter A (Tab. 2).
Fig. 3 - Examples of fitted distributions for plots with representative distributions: approximately normal distribution (left), right skewed distribution (middle) and multimodal distribution (right). For each plot, fitted distributions from the three methods (MLE, MOM, MM1) and the histogram of observed empirical data are shown.
For all methods the impact of stand structure on the goodness of the Weibull function fitting was tested (results shown for MM1 only). The comparative analyses of MAE for diameter distributions fitted by MM1 per BA and QMD classes indicated lower MAE in plots with higher BA and QMD (Tab. 5).
Tab. 5 - Mean MAE values for tree number per 5 cm DBH classes calculated from the observed and fitted distributions using the MM1 method, shown per quadratic mean diameter (QMD) and stand basal area (BA) classes.
| BA class (m2) |
QMD class (cm) | |||
|---|---|---|---|---|
| 10-20 | 20-30 | 30-40 | > 40 | |
| 0-20 | 0.168 | 0.112 | - | - |
| 20-30 | 0.125 | 0.088 | 0.096 | - |
| 30-40 | 0.103 | 0.073 | 0.082 | 0.081 |
| 40-50 | - | 0.060 | 0.064 | 0.077 |
Discussion
Our study is one of the first attempts to fit the Weibull distribution function to empirical data representing semi-natural European beech forests. We used data from small concentric circular sampling plots, which is quite rare when fitting the diameter distribution of forest stands ([19], [32]). Our results showed that the three-parameter Weibull function can be fitted to even-aged beech forests using such data. However, the goodness of fit substantially depends on the diameter distribution of empirical data. In stands with a unimodal distribution fitting was mostly successful, while in stands with a multimodal diameter distribution, fitting was poor or even impossible.
Comparison of estimation methods for fitting the Weibull function
We evaluated three estimation methods for fitting the Weibull function by comparing (i) the number of excluded plots due to deviated values, (ii) the observed and predicted values of stand parameters, and (iii) the observed and predicted values of parameters within DBH classes. The proportion of excluded plots due to extremely deviated values was fairly high. The non-convergence of estimates seems to be an important criterion for selecting the most appropriate fitting method. Our results showed that when using the MLE method the number of excluded plots was almost four times larger than that obtained using MM1 or MOM. Akram & Hayat ([1]) found that MLE can outperform other methods for estimating the three-parameter Weibull distribution as long as convergence is attained. This result is in accordance with simulation studies ([8], [39], [1], [27]) indicating that other estimation methods outperformed MLE when the number of trees is small and the shape parameter C smaller than one, which was often the case in our study (Tab. 2). The number of excluded plots, meaning the plots in which the MLE method exhibited non-convergence, would likely be much lower if the proportion of plots with unimodal mound-shaped distributions was higher.
The comparative analysis of the observed and fitted values of N, BA, QMD and DDOM indicated that all stand parameters at the plot level are well predicted. Of all methods, the MM1 method exhibited the best fit for all stand parameters, followed by the MOM and MLE methods.
Goodness of fit for diameter distribution per DBH class was much worse in comparison to the goodness of fit for stand parameters (Tab. 3, Tab. 4). The MM1 method was superior to MOM and MLE again considering the mean values of MAE, RMSE and KS’s D statistic for diameter distributions per DBH class. The mean MAE for tree number per DBH class, amounting to around 8% of trees in each 5 cm DBH class, was quite comparable for the MM1 and MLE methods. Gorgoso-Varela et al. ([11]) reported lower values of goodness-of-fit measures for fitting the Weibull distribution to homogeneous pine stands. However, they used larger sample plots, and only plots with 30 or more trees were included in the analysis.
The MM1 method outperformed the MLE method with respect to the lowest proportion of plots with a significant difference between observed and the fitted diameter distributions. However, the latter should be interpreted with caution since they are based on the KS test with relatively low frequencies per DBH class.
Suitability of data from small inventory plots for fitting the Weibull distribution function
Our results indicate that forest inventory data obtained on relatively small sampling plots can be used for fitting the Weibull diameter distribution, but with some limitations. The proportion of plots excluded from the analysis due to extremely deviated values of distribution function parameters or modelled BA and N was almost 42%. Akram & Hayat ([1]) calculated the non-convergence rate in a different way but still reported a rate of about 44% for sampling plots with 10 trees per plot and shape parameter 1.5. There are several possible reasons for the non-convergence. The small size of the sampling plots is probably the most important. The expectation that the theoretical distribution can be fitted to data from every small plot often containing a low number of trees is simply unrealistic ([22], [20]), especially if the DBH classes are narrow. In our study only plots with 10 or more trees were included in the analysis. Ten trees has often been recommended as the minimum number of trees for estimating Weibull distribution parameters ([15], [24], [28]), although some studies have suggested 15-30 trees or even more ([20], [25], [11], [36], [33]). The size of our sampling plots was 0.05 ha. In similar studies sampling plots of approximately the same size were applied ([46]), but larger plots were typically used, for instance, > 0.25 ha ([33]) and 0.62 ha ([7]). Due to the threshold value of 10 trees, some plots in mature stands with low tree density were excluded from the analyses, which seems to be one of the disadvantages of using small plots for fitting diameter distribution. However, due to the large total number of plots used in our study, a sufficient number of plots from mature stands (mean DDOM = 42 cm, maximum DDOM = 66 cm) were included in the analysis.
Several studies have confirmed that the estimation of the Weibull function parameters improves by increasing the number of trees used for fitting ([14], [8], [39], [27], [1]). However, this was not confirmed in our study. On the contrary, the tree density in many plots excluded from the analyses was even higher when compared to the tree density of the analyzed plots (results not shown). It seems that stand parameters affect the fitting performance of the Weibull distribution ([20], [22], [33]). Our results showed that the smallest differences between observed and predicted diameter distributions were found in stands with high BA and relatively high QMD. This means that the Weibull function fitted better to dense mature stands and worse to low density stands under regeneration that are characterized by a high QMD and a low BA ([20]).
The irregular (e.g., bimodal or multimodal) empirical diameter distribution of trees might be the second important reason for non-convergence. Such a diameter structure may be a consequence of past disturbances, non-regular harvesting or a specific thinning regime ([20]). Such distributions can be fitted by dividing the distribution into more parts (e.g., layer by layer) by using methods such as the finite mixture model ([41]), splines or generalized additive models ([26]) to improve fitting.
Stand heterogeneity correlates significantly with the parameter C, which indicates the shape of the diameter distribution ([2]). We found a quite weak negative correlation between the parameter C and the Gini index, indicating structural heterogeneity; the MM1 and MOM methods showed higher correlation than the MLE method. Structural diversity indices do not unambiguously identify even-aged stands; stands may be of different structures but have the same diversity index ([12], [10]). Despite the low threshold value of the Gini index to identify even-aged stands (< 0.33), a surprisingly high number of plots exhibiting reversed-J-shaped distribution were found with parameter C < 1, especially when the MLE method was applied. One of the possible reasons is that the Gini index was calculated with the BA of trees, which means that larger trees give more weight to the index than thinner trees, while we fitted the Weibull distribution according to the number of trees. The second, but even more decisive reason for reversed-J-shaped distributions could be the presence of understorey trees (i.e., 10-20 cm in DBH), which can also be common and numerous in even-aged stands in the study area managed with the irregular shelterwood system ([18]). The understorey layer of small-sized trees can dramatically increase the Gini index (and structural diversity) if the threshold for tree measurement is low ([23]). Therefore, in some studies understorey trees ([15]) or trees below the upper canopy ([22], [31]) were excluded from the analyses, a higher diameter measurement threshold was adopted ([23], [10]), or separate analyses were done for social classes of trees ([45]).
Thirdly, the selected method for fitting the Weibull distribution function can influence non-convergence. According to Akram & Hayat ([1]), the non-convergence rate when using the MLE method is high when the plot number is small and the shape parameter C < 1. Our results confirmed this conclusion.
Finally, in forest inventories only trees above the DBH threshold are measured ([42]), which results in a truncated distribution of trees ([21]). To avoid bias in estimating the parameters ([47], [25]), a truncated version of the (Weibull) distribution function is suggested. The bias increases as the QMD approaches the threshold measurement diameter ([47], [20]); however, this was not the case in our study.
Conclusions
All three tested estimation methods (MM1, MOM and MLE) provided relatively reliable estimations of stand parameters (N, BA, DDOM and QMD) which are important for forest managers, but fitting the distribution to tree frequencies per DBH class exhibited much poorer results. Although MLE has been the most commonly used estimation method in forestry, its high non-convergence rate is a major disadvantage compared to the other two methods. When considering a set of criteria for the estimation of fitting methods, the MM1 method seems to be superior for fitting the three-parameter Weibull distribution to beech forests represented by data derived from small plots. Finally, data from small sample plots (0.05 ha), such as those from the NFIs, are suitable for predicting stand parameters derived from fitted or modelled diameter distributions, but less appropriate for modelling tree frequencies per DBH class.
Acknowledgements
The study was funded by the Ministry of Agriculture, Forestry and Food of Republic of Slovenia through the project V4-2014 “The development of forest models for Slovenia” (grant no. 2330-20-000234) and the Slovenian Research Agency (ARRS) program P4-0059 “Forest, forestry and renewable forest resources”. The first author was partly funded by the Pahernik Foundation. A part of the study area represented the infrastructure center “Research Forest of the Department of Forestry and Renewable Forest Resources”, which is part of the Network of Research and Infrastructural Centers of University of Ljubljana (MRIC UL), co-funded by the Slovenian Research Agency.
References
Gscholar
Gscholar
Gscholar
Gscholar
Gscholar
Gscholar
Authors’ Info
Authors’ Affiliation
Vasilije Trifković 0000-0002-7533-5708
Matija Klopčič 0000-0003-2619-9073
Department of Forestry and Renewable Forest Resources, Biotechnical Faculty, University of Ljubljana, Večna pot 83, 1000 Ljubljana (Slovenia)
Slovenia Forest Service, Večna pot 2, 1000 Ljubljana (Slovenia)
Forest Ecosystem and Management, School of Agricultural, Forest and Food Sciences, HAFL, Bern University of Applied Sciences, Länggasse 85, 3052 Zollikofen (Switzerland)
Corresponding author
Paper Info
Citation
Bončina Z, Trifković V, Rosset C, Klopčič M (2022). Evaluation of estimation methods for fitting the three-parameter Weibull distribution to European beech forests. iForest 15: 484-490. - doi: 10.3832/ifor4145-015
Academic Editor
Andrea Cutini
Paper history
Received: May 30, 2022
Accepted: Sep 27, 2022
First online: Dec 01, 2022
Publication Date: Dec 31, 2022
Publication Time: 2.17 months
Copyright Information
© SISEF - The Italian Society of Silviculture and Forest Ecology 2022
Open Access
This article is distributed under the terms of the Creative Commons Attribution-Non Commercial 4.0 International (https://creativecommons.org/licenses/by-nc/4.0/), which permits unrestricted use, distribution, and reproduction in any medium, provided you give appropriate credit to the original author(s) and the source, provide a link to the Creative Commons license, and indicate if changes were made.

Web Metrics
Breakdown by View Type
Article Usage
Total Article Views: 29759
(from publication date up to now)
Breakdown by View Type
HTML Page Views: 23832
Abstract Page Views: 3350
PDF Downloads: 2073
Citation/Reference Downloads: 1
XML Downloads: 503
Web Metrics
Days since publication: 1338
Overall contacts: 29759
Avg. contacts per week: 155.69
Article Citations
Article citations are based on data periodically collected from the Clarivate Web of Science web site
(last update: Jul 2026)
Total number of cites (since 2022): 5
Average cites per year: 1.00
Publication Metrics
by Dimensions ©
Articles citing this article
List of the papers citing this article based on CrossRef Cited-by.
Related Contents
iForest Similar Articles
Research Articles
Modelling diameter distribution of Tetraclinis articulata in Tunisia using normal and Weibull distributions with parameters depending on stand variables
vol. 9, pp. 702-709 (online: 17 May 2016)
Research Articles
Properties and prediction accuracy of a sigmoid function of time-determinate growth
vol. 8, pp. 631-637 (online: 13 January 2015)
Research Articles
Suitability of Fagus orientalis Lipsky at marginal Fagus sylvatica L. forest sites in Southern Germany
vol. 15, pp. 417-423 (online: 19 October 2022)
Research Articles
Modeling extreme values for height distributions in Pinus pinaster, Pinus radiata and Eucalyptus globulus stands in northwestern Spain
vol. 9, pp. 23-29 (online: 25 July 2015)
Research Articles
Influence of salvage logging on forest recovery following intermediate severity canopy disturbances in mixed beech dominated forests of Slovenia
vol. 9, pp. 430-436 (online: 07 January 2016)
Research Articles
Patterns of genetic diversity in European beech (Fagus sylvatica L.) at the eastern margins of its distribution range
vol. 10, pp. 916-922 (online: 10 December 2017)
Research Articles
Distribution factors of the epiphytic lichen Lobaria pulmonaria (L.) Hoffm. at local and regional spatial scales in the Caucasus: combining species distribution modelling and ecological niche theory
vol. 17, pp. 120-131 (online: 30 April 2024)
Research Articles
Comparing land use registry and sample based inventory to estimate forest area in Podlaskie, Poland
vol. 10, pp. 315-321 (online: 23 February 2017)
Research Articles
Environmental niche and distribution of six deciduous tree species in the Spanish Atlantic region
vol. 8, pp. 214-221 (online: 28 August 2014)
Research Articles
Patterns of forest dynamics in a secondary old-growth beech-dominated forest in the Jizera Mountains Beech Forest Reserve, Czech Republic
vol. 12, pp. 17-26 (online: 10 January 2019)
iForest Database Search
Google Scholar Search
Citing Articles
Search By Author
Search By Keywords
PubMed Search
Search By Author
Search By Keyword


