Multiscale characteristics of the early spring temperature and response to climate indices over the past 179 years in the Qinling Mountains
iForest - Biogeosciences and Forestry, Volume 15, Issue 6, Pages 491-499 (2022)
doi: https://doi.org/10.3832/ifor4069-015
Published: Dec 01, 2022 - Copyright © 2022 SISEF
Research Articles
Abstract
Examination of the periodic differences in temperature in the Qinling Mountains at different time scales is highly important in research on the long-term evolution of the regional climate system and ecological environment. Based on February-April temperature data from 1835 to 2013 obtained at 27 weather stations in the Qinling Mountains reconstructed through tree rings, the multiscale characteristics of the early spring temperature time series on the southern and northern slopes of the Qinling Mountains and the response to climate signals were analyzed. The results indicate that the early spring temperature in the Qinling Mountains exhibits significant periodic characteristics on multiple time scales. Reconstruction at the different time scales reveals that the interannual scale change in the temperature variation on the northern slope of the Qinling Mountains plays a decisive role. The temperature on the northern slope exhibits a higher amplitude at the interannual and interdecadal scales than does that on the southern slope, and temporal differences occur at the quasi-century scale. The temperature achieves the strongest correlation with the original Atlantic Multidecadal Oscillation (AMO) sequence during the entire study period. In addition, the different time scales reveal that a significant response relationship exists between the temperature at the interannual scale and the May sea temperature in the NINO3.4 area, which lags by one year. At the different time scales and various time ranges, the Qinling early spring temperature responds differently to the climate signals, which is an important factor leading to a lower correlation during the entire study period.
Keywords
Temperature, Ensemble Empirical Mode Decomposition, Time Scale, Qinling Mountains
Introduction
The Qinling Mountains represent an important north-south geographic boundary in China. This region is extremely sensitive to climate change, and therefore, it has become a typical area for climate change research. The north-south temperature change difference is representative of the temperature variation in China and even in the Northern Hemisphere ([23], [51], [40]). Many authors have carried out studies on temperature changes at single points or areas during different research periods based on instrumental and proxy data, such as loess, tree ring, and lake sediment data, focusing on the temporal and spatial changes in temperature in the Qinling Mountains ([21], [12], [51], [3], [23], [26], [8], [49], [40]). There were differences in the temperature changes between the northern and southern slopes of the Qinling Mountains over the past 50 years ([48]). The temperature growth rate on the northern slope was higher than that on the southern slope, and the annual average temperature difference between the northern and southern slopes was gradually reduced. Over the past 122 years, the Qinling Mountains attained a significant correlation with the sea temperature in the tropical western Pacific and other regions ([37]). Previous studies have provided information and a reference to further examine the temporal change trend of the temperature in the Qinling Mountains. However, existing work has mainly focused on the application of traditional statistical methods in temperature change studies, such as linear fitting and moving average methods, to calculate temperature warming trends at a constant rate ([18]). However, in terms of time series, the temperature not only exhibits a single linear change or multiple linear changes, but also exhibits a complex process involving nonlinear and nonstationary states, including quasiperiodic changes on varying time scales. The multiscale temperature oscillation in long-term series reflects the periodic changes within the climate system, which has implications for the study of long-term climate system trends and global warming mitigation. Therefore, it is important to investigate the periodic changes in the Qinling temperature at different time scales.
In early spring, the winter snow melts and plants germinate in the Qinling Mountains. The fluctuations of temperature affect the growth and development of plants in that year. By studying the dynamic relationship between long-term plant growth and development and climatic factors, it is possible to explore to a certain extent the inherent relationship between climate change, natural disasters and plants. Therefore, studying the multiscale periodic change in the early spring temperature is highly important for the prediction of the temporal evolution trend of plant growth and prevention of the formation of regional climate disasters. Previous studies have indicated that multiscale climate signals, such as the El Niño/Southern Oscillation (ENSO), Pacific Interdecadal Oscillation, North Atlantic Multidecadal Oscillation, and North Atlantic Oscillation, are important factors of global and regional climates through ocean systems or atmospheric circulation ([20], [28], [47]). Changes in the above global-scale climate signals can notably affect temperature variations in China and even the Northern hemisphere ([45], [17], [24]). In addition, the Qinling regional climate exhibits a good response to ENSO and other indices ([29]), though the different climate signals characteristically experience periodic changes on multiple scales. There is less concern regarding the differences in the temperature response to global climate signal changes at the various time scales.
To reveal the regional characteristics of multi-scale temperature changes in this region under the background of global warming, we reconstructed tree-ring width chronology from February to April in the Qinling area from 1835 to 2013. We analyze the correlation between the temperature and a variety of climate signals on different time scales to study the possible responses of cyclical temperature changes within the context of multiscale global climate changes, explore the nature of regional cyclical temperature changes in depth, and further provide a reference for regional climate prediction.
Materials and methods
Overview of the study area and data sources
The Qinling Mountains (32° 40′ - 34° 35′ N, 105° 30′ - 111° 03′ E) comprise the boundary between the north and south and between the subtropical and warm temperate zones in China, and these mountains further contain sensitive ecological environments (Fig. 1). Over the past 60 years, the temperature trend rate on the northern slope of the Qinling Mountains was 0.24 °C / 10 a (ten years), and the temperature trend rate on the southern slope reached 0.15 °C / 10 a ([50]).
Fig. 1 - Distribution of the meteorological stations and tree-ring sampling sites in the Qinling area (China).
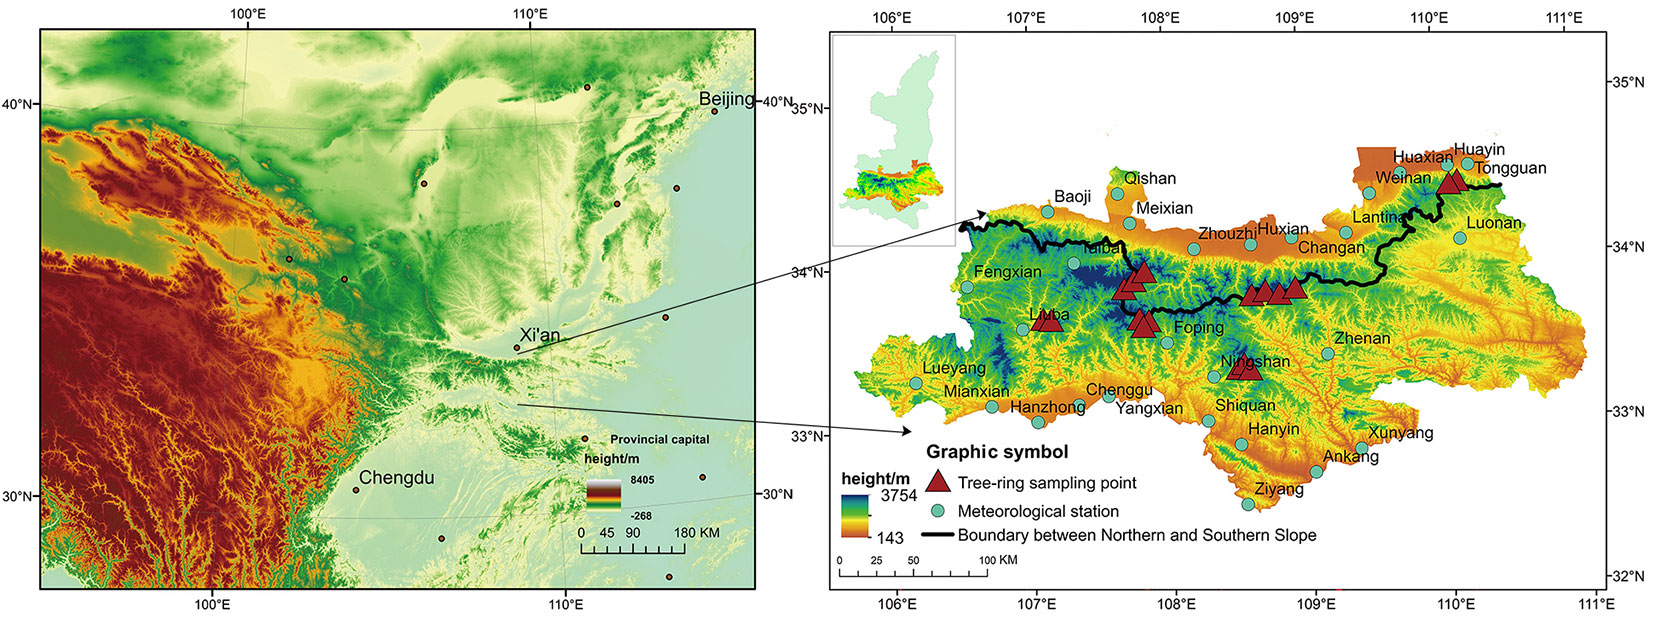
The temperature data analyzed in this study include the average temperature at 27 meteorological stations in the Qinling area from February-April 1835 to 2013 reconstructed from 32 tree-ring width chronology data ([13]). The data are established with a linear regression equation, and the data reliability is tested with the one-by-one elimination method. The correlation coefficients of the data retrieved from each meteorological station are all above 0.4, the complex correlation coefficient and reliability value of the F test both reach 0.99, and the error reduction value approaches 0.3. The reliability values, such as the sign test and product average, are above 0.99. The test results confirm that the reconstruction results are accurate and reliable.
The seven climate signals selected in this investigation to study the multiscale response to the Qinling temperature include regional ocean temperatures or large-scale atmospheric circulation phenomena under long-term series, and all these climate signals exhibit periodic changes at different scales. Monthly average data of these 7 climate signals were acquired from the official website of the National Oceanic and Atmospheric Administration (NOAA, ⇒ http://www.noaa.gov/ - Tab. 1).
Tab. 1 - The seven climate signals selected to study the multiscale response to the Qinling temperature.
| Category | Climate signal | Time span |
|---|---|---|
| Sea surface temperature (SST) |
El Niño 3.4 district-average SST, NINO3.4 | 1854-2013 |
| Pacific Decadal Oscillation, PDO | 1854-2013 | |
| Atlantic Multidecadal Oscillation, AMO | 1874-2013 | |
| Atmospheric circulation | Northern Atlantic Oscillation, NAO | 1854-2013 |
| Southern Oscillation Index, SOI | 1866-2013 | |
| North Pacific Index, NP | 1899-2013 | |
| Others | Global Average Temperature Anomaly, GATA | 1880-2013 |
Main research methods
Ensemble empirical mode decomposition (EEMD) can be employed to extract the change trend of time series at different scales ([44], [2]). This technique is a new noise-assisted analysis method proposed by Wu & Huang ([44]) based on the empirical mode decomposition (EMD) method ([41]). This method inherits the advantages of the EMD adaptability, addresses the problem of unclear modal separation and extracts climate change signals more truthfully and reliably. The method first adds qualified white noise to the original signal, continuously deepens the signal intensity for cyclic testing and thereafter computes the overall average value to cancel the added white noise. The result is then applied as the final intrinsic mode function (IMF) component of EEMD (eqn. 1):
where Cj(t) is the j-th IMF component obtained via EEMD processing of the original sequence, N is the increase in white noise, and Cij(t) is the decomposition result of the j-th IMF component after adding white noise for the i-th time ([44]). In addition, the EEMD method relies on the mirror extension method to process data to lower the error caused by the boundary effect. The obtained IMF component can be evaluated with the white noise significance test method to determine whether it provides a clear physical meaning ([42], [43], [46]).
The time-dependent intrinsic correlation (TDIC) method is a correlation analysis method based on the EEMD method proposed by Chen et al. ([7]). This method is suitable to evaluate the relationship between two sets of sequences at different time scales. TDIC analysis first compares the two sets of IMFs decomposed via EEMD and selects those IMFs with similar average periods among the sets of sequences for internal correlation analysis. In the analysis process, the minimum sliding window size for comparison should be clarified, and Student’s t-test should be performed to verify whether there occurs a significant correlation between the two sets of IMF sequences. In the final established TDIC correlation matrix, the abscissa indicates the time, the ordinate indicates the size of the sliding window, and the part that fails the significance test is shown in the figure ([1]). Compared to the traditional correlation analysis method, the advantage of this method is that local correlation between any two data columns can be analyzed to reflect the differences in the correlation between the data during the different periods. In addition, this method calculates the IMF correlation after EEMD application, so it is more suitable to study the correlation of nonlinear and nonstationary time series, which is difficult to accomplish using traditional correlation analysis.
Multiscale temperature reconstruction further explores the change trend of the temperature at the different time scales. This study adds IMF components at the different time scales to obtain the overall temperature change trend on a given scale. Interannual scale changes are determined by adding IMF components that reflect the interannual period. The decadal scale is obtained by adding IMF components reflecting the interdecadal period. Larger-scale periodic oscillations are obtained by adding IMF components with a scale larger than the decadal period and the trend term RES.
Results and discussion
Trend characteristics of the temperature changes
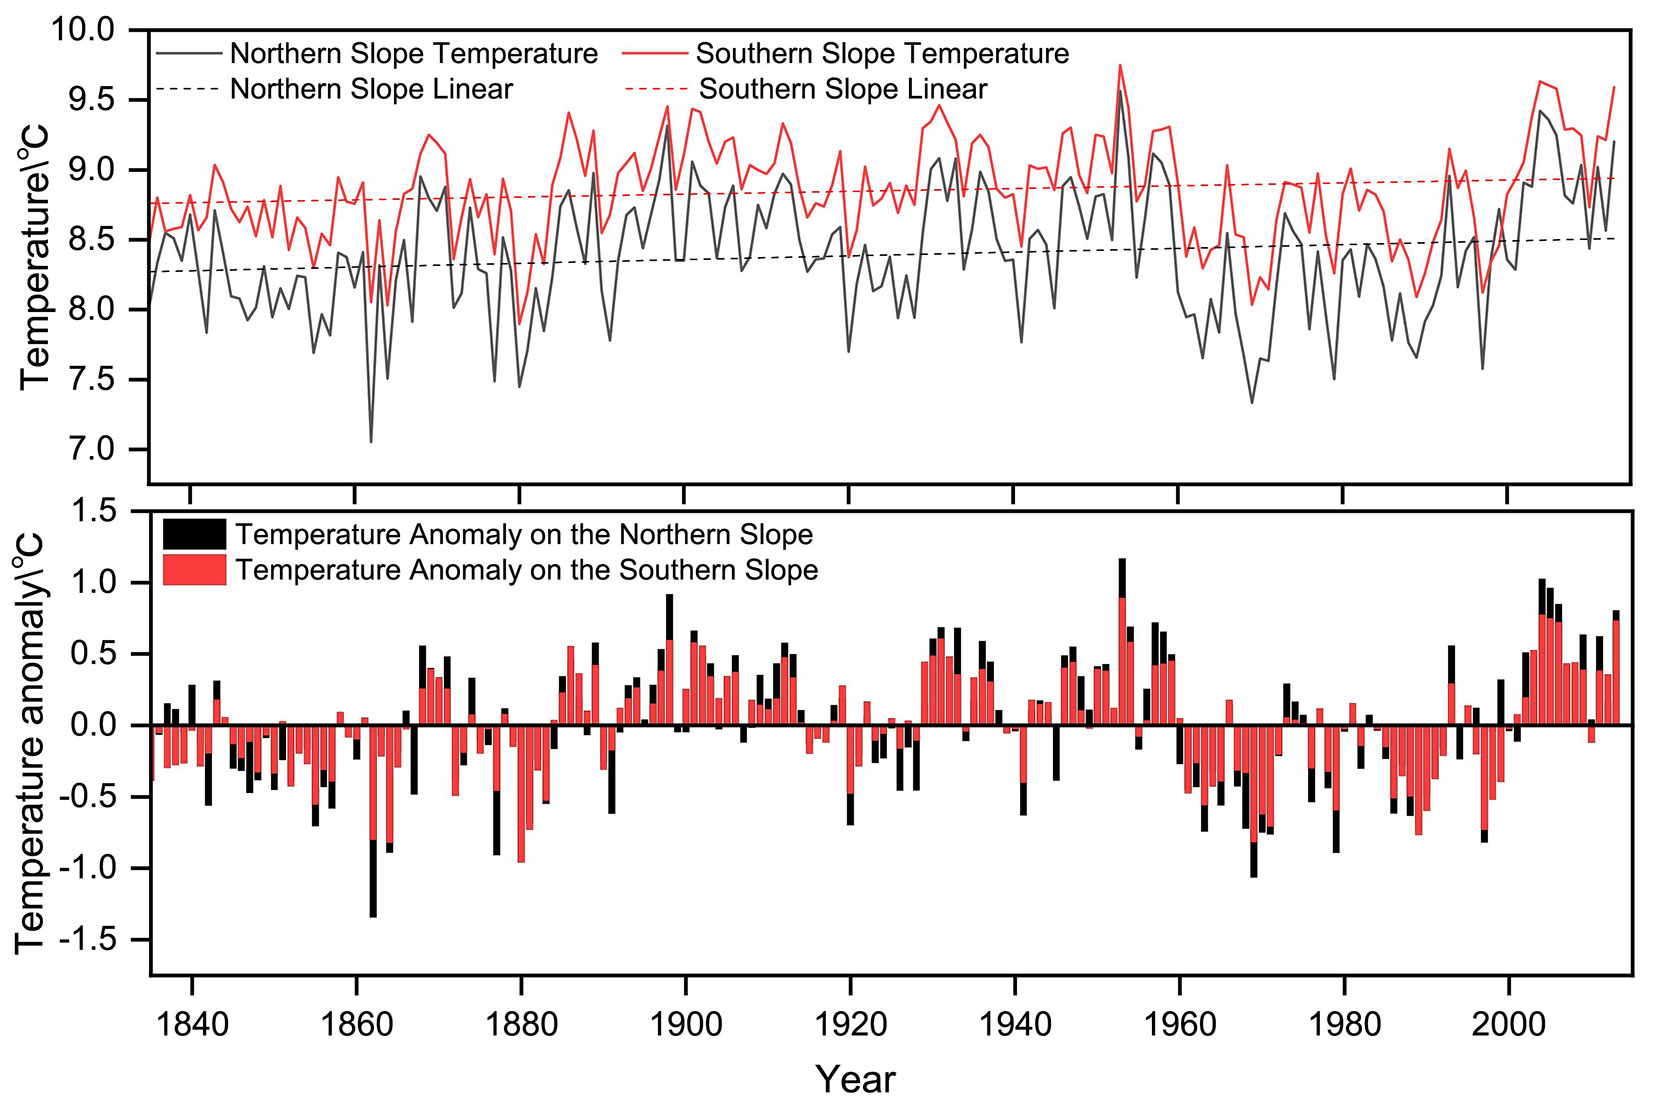
According to Fig. 2, over the past 179 years, the temperature tendency rate in the Qinling Mountains was 0.013 °C / 10 a on the northern slope and 0.010 °C / 10 a on the southern slope, and on the northern slope it was slightly higher than that on the southern slope. From the temperature anomalies, it can be seen that the fluctuation range of temperature on the northern slope is generally larger than that on the southern slope; except for a few years, the temperature on the northern and southern slopes shows a non-steady increasing trend. Since the beginning of this century, there has occurred a notable increase in the number of years with an average temperature 0.5 °C higher than the average temperature during the study period, which indicates that the probability of extreme temperature events in the Qinling Mountains has considerably increased. However, the linear trend analysis can only reflect a single trend of temperature change in the whole study period, so the nonlinear research method was used to analyze the temperature change process in this area.
Fig. 2 - Temperature anomaly values from February to April on the northern and southern slopes of the Qinling Mountains.
Multiscale changes in the temperature
With the use of MATLAB2014a software as the platform, the signal-to-noise ratio between the white noise-disturbed and original signals reached 0.2, and the number of samples was 100. During the 179-year study period, the average temperature on the southern and northern slopes of the Qinling Mountains from February to April was multiscaled based on the EEMD method, and 5 IMF components and trend item RES were obtained for both the northern and southern slopes. The eigenmode components of temperature decomposition on the northern slope are denoted as IMFn, and those on the southern slope are denoted as IMFs. These two sets of IMF components in turn reflect the multiscale changes in temperature from a high frequency to a low frequency on the southern and northern slopes of the Qinling Mountains from February to April (Fig. 3). The change in the amplitude indicates the strength of the cycle, which is the result of the joint action of internal movement and external factors of the climate system ([46]). The residual trend item RES reflects the overall trend over time of the temperature changes during the study period.
Fig. 3 - Results of EEMD analysis of the northern-southern slope temperature and time series in the Qinling Mountains from February to April.
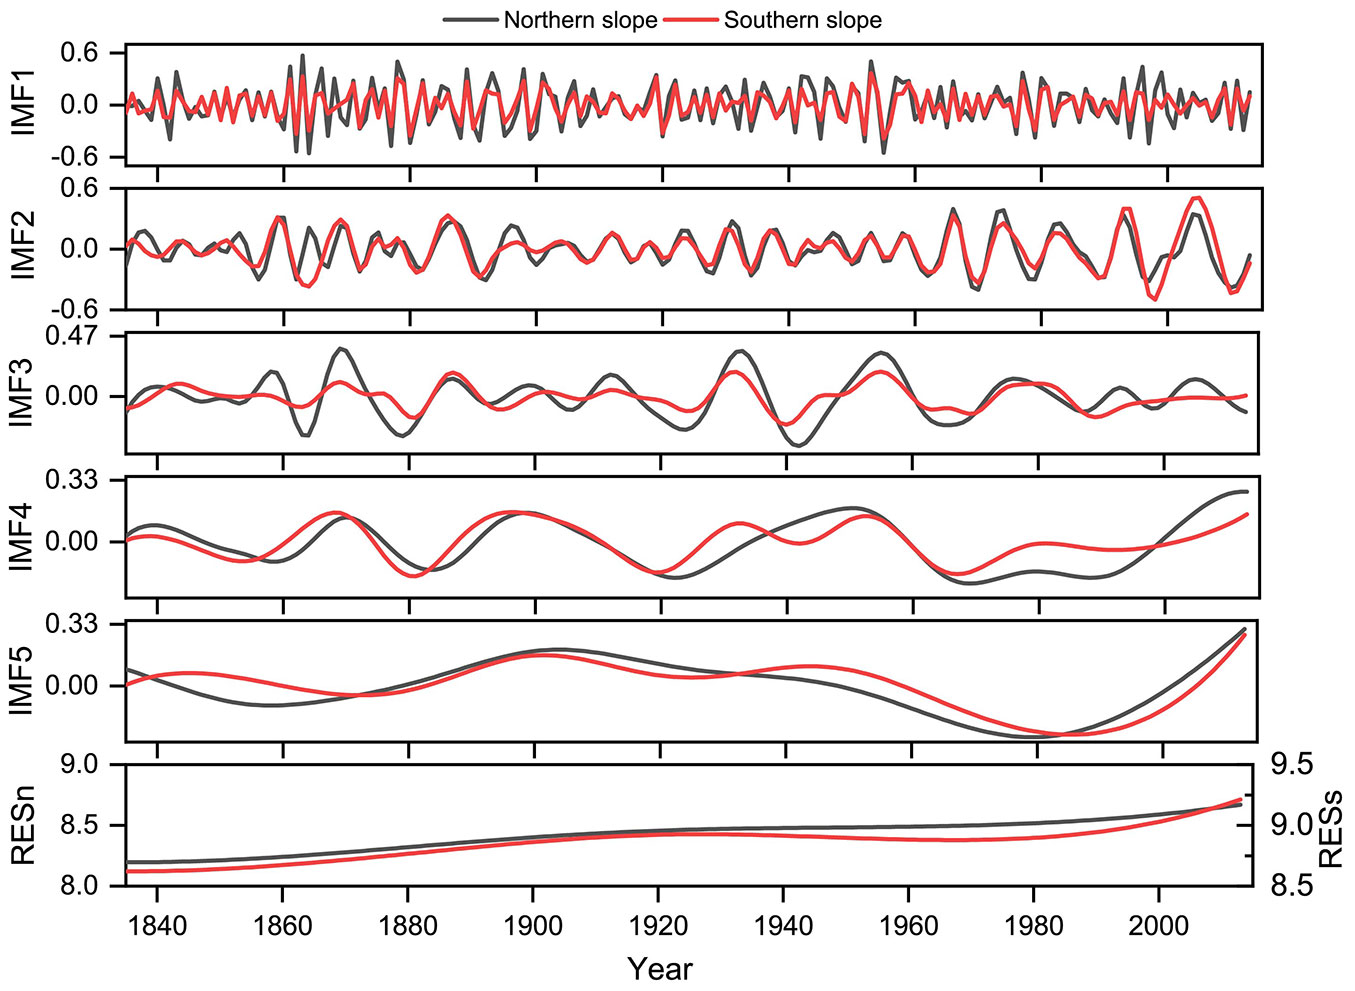
Fig. 3shows that the early spring temperature in the Qinling Mountains exhibits periodic oscillations at various time scales, such as interannual, interdecadal, and quasi-century oscillations. On an interannual scale, the northern and southern slopes attain average periods of quasi 3 a (IMFn1 and IMFs1), quasi 7 a (IMFn2), and quasi 8 a (IMFs2). The cyclical temperature changes on the northern and southern slopes are roughly the same at the interannual scale, but the beginning and ending years and the amplitudes of the changes are different.
At the interdecadal scale, the temperature on the northern slope experiences periodic fluctuations of quasi 17 a (IMFn3) and 43 a (IMFn4), while the temperature on the southern slope experiences periodic fluctuations of quasi 19 a (IMFs3) and 37 a (IMFs4). The cycles on the northern and southern slopes are not very different, but the amplitudes are dissimilar. The 1859-1880 and 1925-1963 periods on the northern slope belong to the strong IMFn3 period. The trend for the southern slope is relatively flat, and the amplitude is significantly lower than the average amplitude from 1894-1924, which is the weaker IMFs3 period. The amplitude of IMFn3 on the northern slope is generally higher than that on the southern slope. Except for the period from the 1940s to the 1990s, the amplitude of IMFn4 on the northern slope is slightly lower than that of IMFs4 during the rest of the period. The difference in amplitude indicates that the temperature on the northern slope at the quasi-18-19 a scale is more cyclical, while that on the southern slope at the quasi-37-43 a scale is more cyclical.
On a quasi-century scale, the periods of IMFs5 and IMFn5 are similar. Except for the large fluctuations in the temperature cycle and amplitude on the southern slope from 1839-1871 and 1902-1950, the temperature change periods and amplitudes on the southern and northern slopes are similar during the remainder of the period. The trend items RESn and RESs reveal that over the past 179 years, the temperatures on the northern and southern slopes exhibit a nearly linear (though actually nonlinear) gentle-rising trend.
Reconstructing the multiscale characteristics of the air temperature
We reconstructed the interannual, interdecadal, and quasi-century scale periodic changes in the temperature in the Qinling Mountains (Fig. 4). Among these changes, the interannual temperature change was obtained by adding the first and second IMF components, the interdecadal scale temperature change was determined by adding the 3rd and 4th IMF components, and the quasi-century scale temperature change was obtained by adding the 5th IMF component and the RES trend term.
Fig. 4 - Multiscale reconstruction of the temperature in the Qinling area. (a) Interannual scale change; (b) interdecadal scale change; (c) quasi-century scale change.
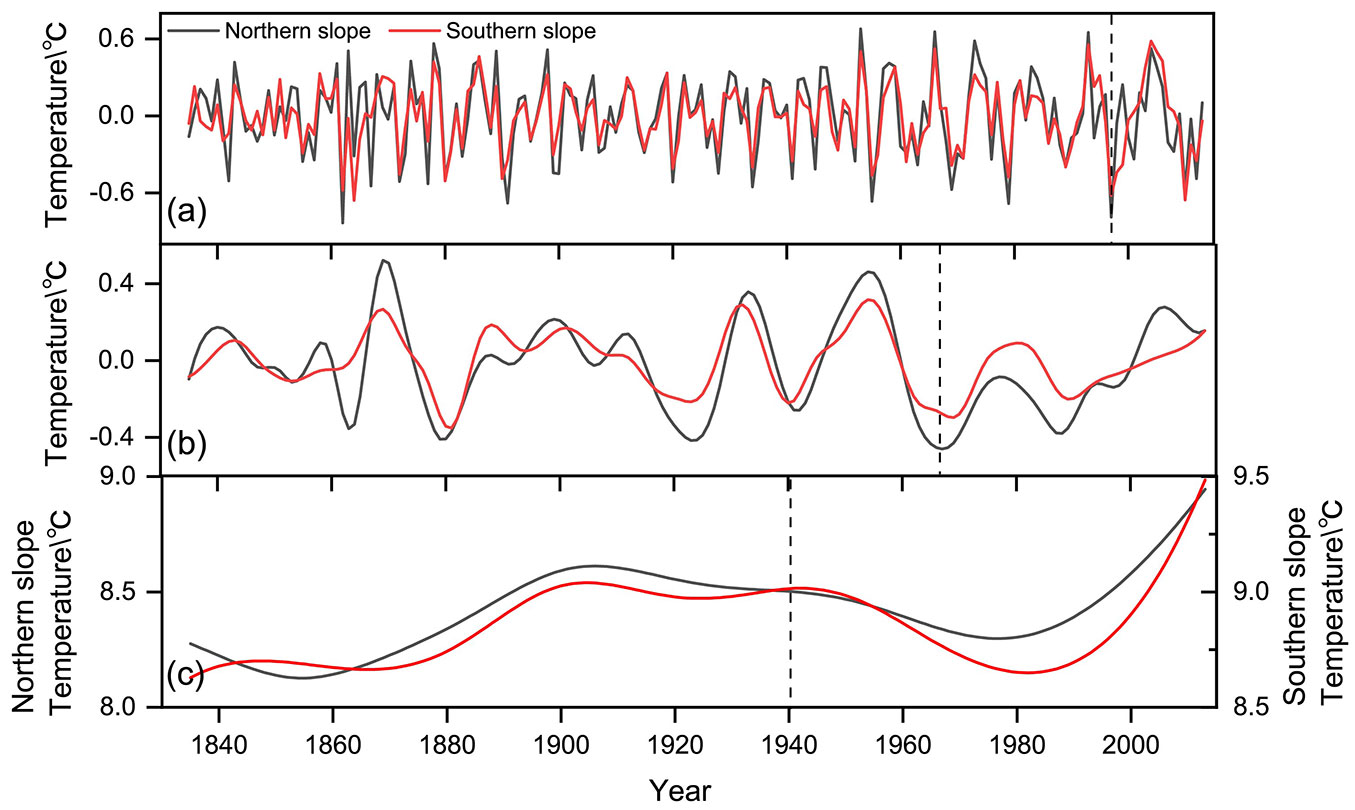
According to Fig. 2and Fig. 4, the reconstructed interannual scale change trend can describe the fluctuation state of the original temperature sequence during the study period. The interdecadal change fully reflects the variation in the original temperature anomaly during the different periods of the climate patterns, and the quasi-century scale changes explain the general trend of the temperature changes during the study period. On an interannual scale, the temperature amplitude on the northern slope is generally higher than that on the southern slope. However, since the late 1990s, the interannual scale amplitude on the southern slope is higher than that on the northern slope. At the interdecadal scale, the amplitude on the northern slope is higher than that on the southern slope over the entire study period, and the temperature on the southern slope changes slowly. On a quasi-century scale, before 1940, the amplitude on the northern slope was higher than that on the southern slope, and the temperature change on the northern slope was more severe than that on the southern slope. After 1940, the temperature amplitude on the southern slope was higher than that on the northern slope, and the fluctuations intensified.
The reasons for the difference in temperature between the northern and southern slopes on the interannual and interdecadal scales may be as follows: the Qinling Mountains are located in the boundary area of the sphere of influence of the East Asian monsoon, and the northern slope area is more sensitive to climatic factors such as the alternation of the East Asian monsoon and the northwest monsoon. The northern slope is shaded by the Qinling Mountains, the underlying surface, including vegetation, topography and other factors, is more sensitive to climate changes, and vegetation growth imposes a more obvious modulating effect on the temperature. The northern slope exhibits a large temperature difference between the morning and evening and between the months. In the months with sufficient heat, the climate change is similar to that on the southern slope, but the difference is obvious in the other months. Due to many factors, the temperature amplitude on the northern slope of the Qinling Mountains is higher than that on the southern slope.
Numerous studies have demonstrated that the temperature in the Qinling Mountains has been rising over the past 50 years ([26], [30]). A linear analysis of the reconstructed temperature changes at the different scales over the past 50 years was carried out. The early spring temperature in the Qinling Mountains has been rising over the past 50 years, which is mainly reflected at the interdecadal and quasi-century scales. The temperature growth rate on the northern slope is higher than that on the southern slope, which is mainly manifested in the dramatic changes in temperature on the northern slope at interdecadal scale (Tab. 2).
Tab. 2 - Qinling temperature trend rate from February to April 1959-2013. (SD): standard deviation.
| Propensity rate (°C/10 a) |
Original sequence |
Interannual scale |
Interdecadal scale |
Quasi-century scale |
|---|---|---|---|---|
| Northern slope | 0.18 | -0.02 | 0.09 | 0.10 |
| Northern slope SD | 0.50 | 0.33 | 0.21 | 0.21 |
| Southern slope | 0.13 | -0.003 | 0.04 | 0.09 |
| Southern slope SD | 0.42 | 0.29 | 0.12 | 0.22 |
The variance contribution rate constitutes the basis to evaluate the degree of influence of the frequency and amplitude of each component on the overall characteristics of the original temperature series ([5]). Tab. 3provides the variance contribution rate of the air temperature components (IMFn and IMFs) on the southern and northern slopes of the Qinling Mountains after decomposition and reports the correlation coefficient with the original air temperature series. The contribution rate to the interannual variance on the northern slope was 47%, the decadal variance contribution rate was 31.64%, and the quasi-century scale variance contribution rate was 21.36%. The sum of the contribution rates to the interannual variance on the southern slope was 52%, the sum of the decadal variance contribution rates was 21.22%, and the sum of the quasi-century scale variance contribution rates was 26.78%. Both the southern and northern slopes revealed the most significant temperature changes at the interannual scale. The difference is that the decadal contribution on the northern slope exceeded the quasi-century scale contribution, while the quasi-century scale contribution on the southern slope was greater than the decadal contribution.
Tab. 3 - Period, correlation coefficient and variance contribution rate of the IMFn and IMFs components of the temperature series from February-April 1835-2014 on the northern and southern slopes of the Qinling Mountains. (**): p<0.01.
| IMFn component | IMFn1 | IMFn2 | IMFn3 | IMFn4 | IMFn5 | RESn |
|---|---|---|---|---|---|---|
| Period (a) | quasi 3 | quasi 7 | quasi 17 | quasi 42 | quasi 80-100 a | - |
| Correlation coefficient | 0.58** | 0.43** | 0.44** | 0.54** | 0.45** | 0.26** |
| Variance contribution rate (%) | 26.86 | 20.17 | 17.47 | 16.19 | 13.12 | 6.19 |
| IMFs component | IMFs1 | IMFs2 | IMFs3 | IMFs4 | IMFs5 | RESs |
| Period (a) | quasi 3 | quasi 8 | quasi 19 | quasi 37 | quasi 70-100 a | - |
| Correlation coefficient | 0.49** | 0.54** | 0.49** | 0.53** | 0.46** | 0.36** |
| Variance contribution rate (%) | 24.01 | 29.95 | 7.09 | 8.17 | 14.32 | 16.46 |
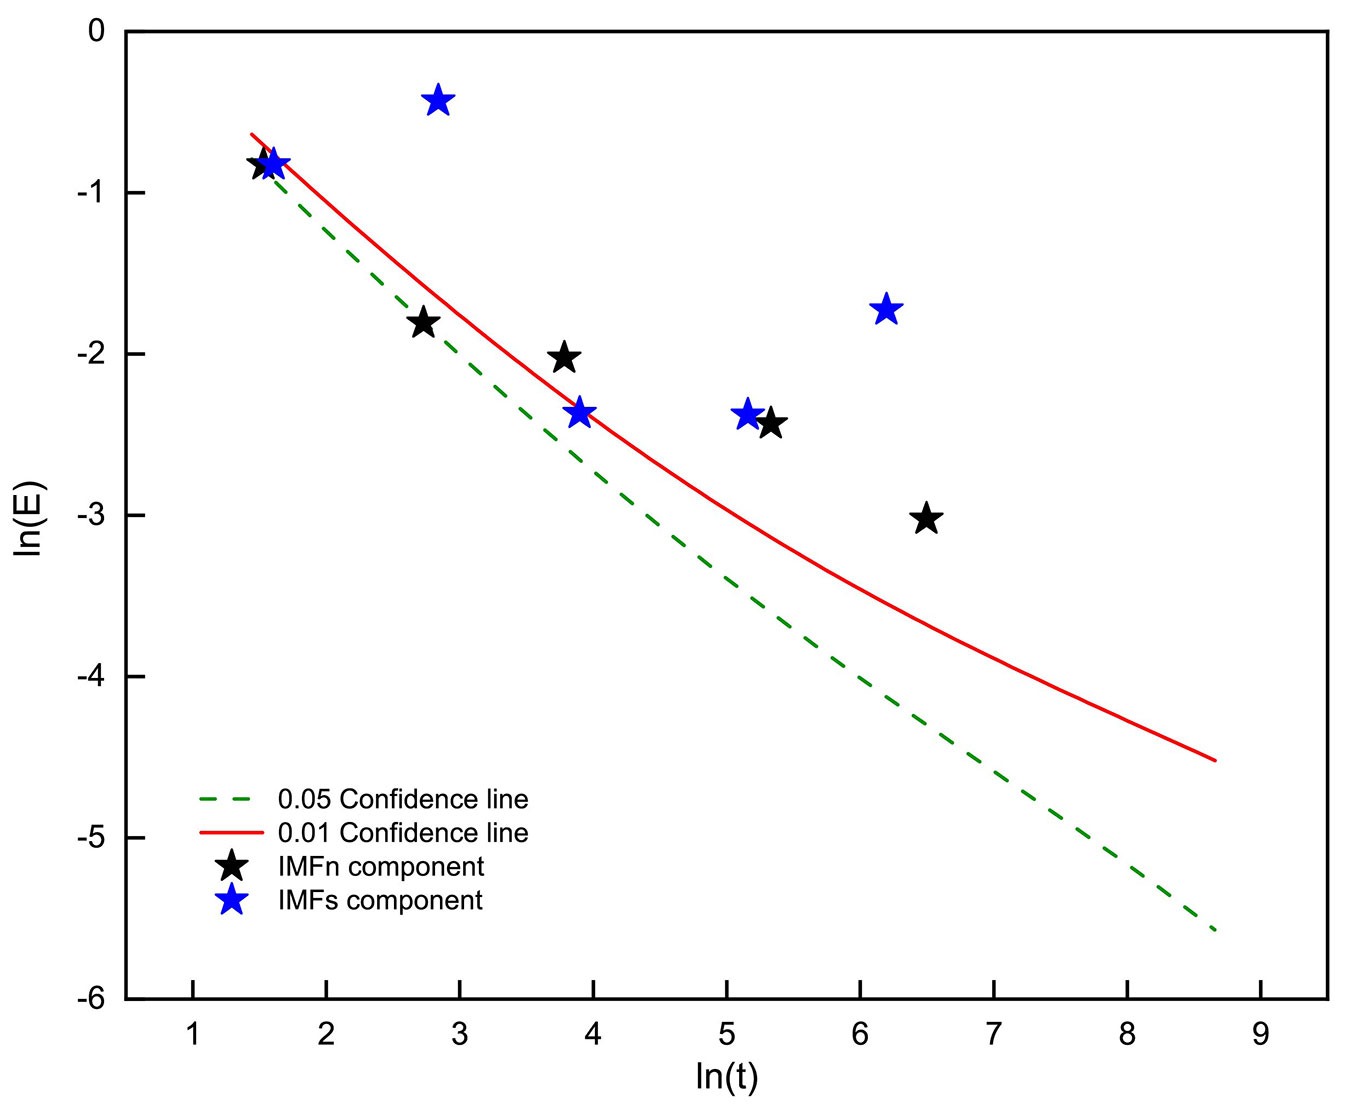
The results of the significance test show that all IMF components on the northern slope of Qinling Mountains are significance, though the significance of IMFn2 is lower than that of other components. The significance of each component on the southern slope was generally higher than that on the northern slope (Fig. 5), and the significance test results correspond to its variance contribution rate and its correlation coefficient with the original series (Tab. 3).
Fig. 5 - Significance of the IMF component of the temperature from February-April 1835-2014 on the northern and southern slopes of the Qinling Mountains (from the origin to the outside, it is IMF1-5).
Under global warming, temperatures worldwide have experienced a process of nonlinear and complex change ([39], [18], [4]), which suggests that the nonlinear and complex process of the temperature changes in the Qinling Mountains is not an accidental phenomenon but an inherent reflection of the climate system. There occurs a certain correlation with the climate cycle changes in other regions. In this study, the quasi-period of the temperature in the Qinling Mountains was compared to the multiscale periods of the May-July temperature decomposed via EEMD in central Qinling ([14]), the early summer temperature in the northern part of the Western Sichuan Plateau ([25]), and the average temperature over the past 100 years in China ([36]). Several change patterns exhibited similar quasi-periods, which are the most obvious at the interannual scale and slightly different on the interdecadal and quasi-century scales (Tab. 4). Although the periods of the temperature fluctuations in the various regions are similar at the interannual scale, the correlation between the interannual temperature fluctuations in the various regions is low due to the frequent periodic conversions and complex fluctuations at the high-frequency (smaller) scale. Comparing the reconstructed interdecadal and quasi-century scale cycles, it was found that, with the exception of the quasi-century scale average temperature over the past 100 years in China, there exists a significant positive correlation with the Qinling temperature in this study at the corresponding time scale (Tab. 4), which indicates a better synchronization trend. The non-significant quasi-century scale correlation with the average temperature in China over the past 100 years may be attributed to the short temperature series over the past 100 years and the fewer quasi-century scale fluctuations, which reflects the changes above the quasi-century scale. In contrast, since the 1950s, the warming trend thereafter is similar to that of the other series.
Tab. 4 - Multiscale periods of the temperature in the other regions and their correlation at the different scales in the Qinling area. (1): Hu et al. ([14]); (2): Li et al. ([25]); (3): Tang & Ren ([36]); (4): Chen et al. ([10]); (5): Shi et al. ([35]); (*): p<0.05; (**): p<0.01.
| Period | Central area of Qinling (1) |
Western Sichuan Plateau (2) |
Whole China (3) |
Northwestern region (4) | Beijing area (5) |
Northern Hemisphere (5) |
|---|---|---|---|---|---|---|
| 1814-2007 | 1854-2010 | 1905-2009 | 1901-2013 | 1-1979 | 1-1979 | |
| IMF1 | quasi 3 a | quasi 3 a | quasi 3 a | quasi 2-3 a | quasi 3 a | quasi 6 a |
| IMF2 | quasi 8 a | quasi 6 a | quasi 8 a | quasi 6-7 a | quasi 6 a | quasi 11 a |
| IMF3 | quasi 20 a | quasi 14 a | quasi 18 a | quasi 14 a | quasi 11 a | quasi 21 a |
| IMF4 | quasi 39 a | quasi 40 a | quasi 63 a | quasi 20 a | quasi 21 a | quasi 43 a |
| IMF5 | quasi 71 a | quasi 68 a | quasi 105 a | quasi 70 a | quasi 42 a | quasi 86 a |
| IMF6 | quasi 84 a | - | - | - | quasi 80 a | quasi 247 a |
| IMF7 | - | - | - | - | quasi 166 a | quasi 914 a |
| IMF8 | - | - | - | - | quasi 459 a | - |
| Interdecadal scale | 0.22** | 0.18* | 0.31** | - | - | - |
| Quasi-century scale | 0.80** | 0.37** | 0.13 | - | - | - |
Fig. S1 (Supplementary material) shows the comparison results of the reconstructed temperature in the Qinling area in this study with the three sets of temperature series at the interdecadal and quasi-century scales. On an interdecadal scale, several series reveal similar fluctuation trends. On a quasi-century scale, the temperature trend in the Qinling region decomposed in this study attains the highest correlation with the temperature fluctuation trend in central Qinling from May to July, indicating that the periodicity of the temperature in the Qinling region from February to April is representative for the study of the periodicity of the temperature in the region during other periods. Since 1950, the quasi-century-scale fluctuation trends of the four series are almost the same, revealing a trend of falling first and then rising. This trend has been confirmed by many authors ([15], [11]), indicating that the quasi-century-scale changes in the temperature in the Qinling area are similar to those in the other regions. The similarities between the above regions further prove that the reconstructed quasi-century scale changes better reflect historical-future climate trends when compared to the traditional linear changes. In addition, the temperature cycle in the Qinling Mountains was compared to that in Northwest China, as decomposed by Chen et al. ([10]) through the EEMD method over the past 100 years, and that in the Northern Hemisphere and the Beijing area over the past two thousand years, as decomposed by Shi et al. ([35]) - Tab. 4). Although there were slight differences, the average periods of quasi 3 a, quasi 7-8 a, quasi 17-19 a, quasi 37-43 a, and quasi 70-100 a with the temperature in the Qinling Mountains were also observed in the northwestern region of China, Beijing and the Northern Hemisphere. This demonstrates that the average periodic change in the temperature decomposed in this study can more truly reflect the characteristics of the temperature in the region at the different time scales, and this feature exhibits a certain spatial representativeness.
Multiscale response of the early spring Qinling temperature to the climate signals
The multiscale temperature oscillation in the Qinling Mountains not only reflects the nonlinear feedback within the climate system but also the periodic evolution of the climate system under external forcing. To identify the response of the Qinling Mountain temperature to ocean oscillations and atmospheric circulation at different time scales based on the periodic changes in the early spring temperature and to provide a basis for the prediction of regional climate evolution, we selected seven climate signals to study the response of the multiscale periodic changes in the early spring temperature in the Qinling Mountains to global climate change (Tab. 1). Considering that the response of inland temperature to climate signals may have a time lag, climate signal of the average value from February to April of the current year and the monthly values from May of the previous year to April of the current year were selected for the analysis. Tab. 5indicates that the Qinling average temperature from February to April attains the strongest correlation with AMO during the same period (0.33), and AMO attains a significant correlation with the Qinling temperature in most months. There exists a significant positive correlation between the Niño 3.4 regional sea temperature in May of the previous year and the average temperature in Qinling from February to April. Moreover, SOI achieves a significant negative correlation in May and September of the previous year, with the strongest correlation in May of the previous year. NP attains a significant negative correlation with the Qinling temperature in May of the previous year. The NAO index reaches a significant positive correlation with the Qinling temperature in December of the previous year. PDO and GATA exhibit no significant correlation with the Qinling temperature in any month.
Tab. 5 - Correlation between the temperature and climate signals in Qinling from February to April. P indicates the month of the previous year. (*): p<0.05; (**): p<0.01.
| Month | Nino3.4 | SOI | NP | NAO | AMO | PDO | GATA |
|---|---|---|---|---|---|---|---|
| P5 | 0.16* | -0.21* | -0.25** | 0.07 | 0.32** | 0.08 | 0.06 |
| P6 | 0.15 | -0.11 | -0.11 | -0.11 | 0.26** | 0.06 | 0.08 |
| P7 | 0.13 | -0.02 | -0.10 | -0.07 | 0.22** | 0.13 | 0.09 |
| P8 | 0.12 | -0.13 | 0.09 | -0.03 | 0.24** | 0.14 | 0.09 |
| P9 | 0.11 | -0.17* | 0.04 | -0.08 | 0.17* | 0.08 | 0.11 |
| P10 | 0.11 | -0.04 | -0.01 | 0.00 | 0.14 | 0.04 | 0.16 |
| P11 | 0.10 | -0.13 | 0.00 | 0.07 | 0.16 | 0.00 | 0.11 |
| P12 | 0.09 | -0.05 | -0.03 | 0.16* | 0.24** | -0.01 | 0.02 |
| 1 | 0.09 | -0.05 | 0.09 | 0.12 | 0.31** | 0.06 | 0.03 |
| 2 | 0.05 | -0.05 | 0.13 | -0.04 | 0.29** | 0.03 | 0.05 |
| 3 | 0.03 | 0.04 | 0.11 | -0.04 | 0.30** | -0.04 | 0.04 |
| 4 | 0.06 | 0.00 | -0.14 | 0.13 | 0.27** | 0.03 | 0.08 |
| 2-4 | 0.05 | 0.00 | 0.08 | 0.02 | 0.33** | 0.01 | 0.06 |
Tab. S1 (Supplementary material) reveals the multiscale periodic oscillations during the period when the climate signals achieve the strongest correlation with the Qinling temperature. The quasi-period of the temperature attains similar periods for most climate signals. Further analysis of the correlation between the temperature and various climate signals at the different time scales (see Tab. S2 in Supplementary material) demonstrates that although each index attains a significant correlation with the Qinling temperature, the degree of the temperature response to the various climate signals varies between the different time scales. At the interannual cycle scale, the Qinling early spring temperature at the quasi 3 a scale only attains a significant positive correlation with the sea temperature of the previous May in the Niño 3.4 area, and a good response to GATA is observed. At the quasi 6 a scale, the Qinling early spring temperature is significantly negatively correlated with SOI and significantly positively correlated with Niño 3.4 and NAO. Among these climate signals, the correlation with NAO is the highest, reaching 0.40. On an interdecadal cycle scale, the quasi 17-19a scale is only significantly correlated with AMO. At the quasi 37-43a scale, the number of climatic factors that are significantly related to the Qinling early spring temperature increases. All climate signals, except NAO and NP, attain a significant correlation with the Qinling early spring temperature. Among these climate signals, SOI and Niño 3.4 are negatively correlated with the Qinling temperature. Niño 3.4 attains a significant positive correlation with the Qinling temperature at the other scales, so the negative correlation at this scale also reduces the correlation with Niño 3.4 across the entire time scale. At the quasi-century scale, there exists a significant correlation between the Qinling temperature and the various climate signals. The response to GATA is the strongest among the two scales (0.50), indicating that the early spring temperature in the Qinling Mountains exhibits a greater response to global temperature fluctuations under large-scale periodic changes than that under small-scale changes. The possible reason is that the small-scale periodic changes in the temperature are affected not only by global climate change but also by other factors (such as changes in topography, clouds, aerosols, sunspots, and solar irradiance). The changes in these factors are complex and yield a more direct impact on the local temperature at the interannual scale, leading to an insignificant response to large-scale climate circulation on a smaller scale. In contrast, the temperature in the Qinling Mountains on a larger scale exerts an impact on global climate change, and the response is more obvious and positive. IMF2 and IMF3 of the Qinling early spring temperature are negatively correlated with the global average early spring temperature or an important influencing factor causing these two components to be uncorrelated during the entire study period. This further indicates that the Qinling early spring temperature exhibits a unique change cycle at this scale.
SST and SOI in the Nino3.4 region are important indicators for judging the El Niño/Southern Oscillation (ENSO) phenomenon, and an important indicator for the mutual modulation of the atmosphere and ocean systems. ENSO usually causes changes in atmospheric circulation and thus affects climate anomalies in certain parts of the world on an interannual scale ([52], [38], [9]). This affects the temperature changes in northern China through Asian monsoon activity ([32], [6]), and the early spring temperature in the Qinling Mountains responds well to Niño 3.4 on multiple scales, indicating that this area may be affected by the multiscale effects of ENSO periodic activities ([16]).
From Tab. 5, it can be seen that in general, there may be a closer relationship between AMO and the temperature change in the early spring of the Qinling Mountains. This stable relationship between these two variables may be one of the main influencing factors of the multiscale change in the early spring temperature in Qinling. There are many possible reasons for the mechanism by which AMO affects the temperature.[n/a]Ka-Kit & Zhou ([19]) proposed that the multidecadal temperature oscillation is a change mode reflected by AMO that affects the internal changes in the climate system. Lu et al. ([27]) acknowledged that AMO affects the multidecadal changes in the climate of the Eurasian continent by causing a feedback mechanism of the atmosphere and ocean in the western Pacific. In addition, studies have found that most areas in China experience a warm winter when the AMO phenomenon occurs in the positive (warm) phase ([31]). This conclusion has also been confirmed by different scientists. The interdecadal variation in AMO and the East Asian monsoon still yields an obvious modulation effect. When AMO occurs in the positive phase, the East Asian summer monsoon will increase, the winter monsoon will weaken, and the cold phase will be reversed ([22]). Therefore, the change in AMO at the interdecadal scale may be an important factor leading to the increase in the early spring temperature in the Qinling area.
Tab. S2 (Supplementary material) demonstrates that at the different time scales, the relationship between AMO and the Qinling early spring temperature is not unique. These two variables are positively correlated on certain scales and negatively correlated on other scales. During the entire study period, the correlation between the original temperature series and the AMO index was lower than that with the decomposed components. Perhaps the positive correlation on certain scales may be offset by the negative correlation at the other scales. Alternatively, within the same IMF, the positive correlation during certain periods may be offset by the negative correlation during other periods. Fig. S2 (Supplementary material) shows that the phase changes of the air temperature and AMO at the different time scales are the same during certain periods but are the opposite during the other periods. For example, IMF2 exhibits the opposite phase of the temperature and AMO from 1940-1970, and IMF5 exhibits the same phase from 1920-1958. Fig. S2 (Supplementary material) shows that there occurs an alternating phenomenon in the correlation between the air temperature and AMO for each IMF component. To analyze the relationship between these two variables, it is necessary to conduct a dynamic correlation analysis of the region.
Traditional correlation analysis indicates that the longer the time span is, the more unstable factors occur, and the temperature and climate signals experience nonlinear changes, which makes it difficult to accurately characterize the correlation. To quantify the relationship between these two aspects locally, dynamic correlation analysis should be carried out ([33], [34]). When performing dynamic correlation analysis to study the relationship between two time series with multiscale features, it is necessary to perform local correlation analysis by selecting an appropriate sliding window.
TDIC analysis was performed between the IMFs components of the two time series with a similar periodicity, and a TDIC analysis chart was generated by adaptively selecting the sliding window size (to ensure the stability of the sliding window, rather than the stability of the entire time domain). The first four IMF components with a clear significance were selected with the TDIC method to analyze the correlation between AMO and air temperature (Fig. S3 in Supplementary material). The abscissa in the figure represents the year, and the ordinate represents the size of the sliding window for these two data columns.
Fig. S3 (Supplementary material) shows that AMO attains a correlation with alternating positive and negative air temperatures in the IMF1 component, and a significant negative correlation is obtained from 1940-1975, while the IMF2 component achieves no significant correlation in most years. Except for the two ends of the sliding window, the IMF3 and IMF4 components are significantly positively correlated throughout the entire study period. AMO and the temperature also attain a significant correlation at the quasi 3 a scale, but this correlation varies over time, which leads to a lower correlation during the entire study period. The reason for this reversal is currently unclear. This may be attributed to the many years of lead-lag correlation between the temperature and climate signals and the complexity of the internal interaction between the ocean and the atmosphere.
The terrain of the Qinling Mountains is complex, and the temperature response to the AMO climate signal may be different in the various regions. Fig. S4 (Supplementary material) shows the spatial correlation between the temperature and AMO at various scales. Under the IMF1 component, there occurs no significant correlation between the temperature and AMO in any region. Under the IMF2 component, the response of the temperature in the west Qinling area is more significant, while under the IMF3 and IMF4 components, the temperature in most of the Qinling Mountains attains a significant correlation with AMO. The trend item achieves a negative correlation between the air temperature and AMO in most high-altitude areas and a positive correlation at lower altitudes. This suggests that the early spring temperature in the Qinling Mountains responds differently to the AMO climate signal in the various regions at the different time scales.
Conclusions
This study employed EEMD to analyze the multiscale temporal and spatial characteristics of temperature anomalies from February to April over the period 1835 to 2013, on the northern and southern slopes of the Qinling Mountains, and examined the response of the temperature to climate signals on different time scales.
Over the past 179 years, the early spring temperature on the northern and southern slopes of the Qinling Mountains exhibited a nonlinear increasing trend and revealed significant characteristics at the different time scales. The contribution at the various scales to the increase in early spring temperature on the northern slope of the Qinling Mountains follows the order of interannual scale > interdecadal scale > quasi-century scale changes. On the southern slope, the order is interannual scale > quasi-century scale > interdecadal scale changes.
The reconstructed temperature changes at each time scale effectively describe the fluctuation state of the original temperature series during the study period and the overall change trend on a large scale. In the future, the temperature in the Qinling Mountains area will continue to rise in fluctuation. The temperature in the early spring on the northern slope of the Qinling Mountains fluctuated more strongly in most periods of time on the interannual and interdecadal scales. On a quasi-century scale, the amplitude is higher than that on the southern slope before 1940, and vice versa thereafter. Over the past 50 years, the increase in the early spring temperature on the northern slope of the Qinling Mountains was larger than that on the southern slope, mainly due to interdecadal temperature fluctuations.
The early spring temperature in the Qinling Mountains responds differently to the climate signals at the different time scales and various time ranges. On an interannual scale, the temperature attains the most significant response to the May SST in the Niño 3.4 area. At the interdecadal scale, the response is the strongest for AMO. At the quasi-century scale, the responses of the various climate signals are significant, the early spring temperature in the Qinling Mountains achieves a stronger synchronization with global climate change on a larger scale. The weaker correlation between the temperature and AMO at the interannual scale is attributed to the different correlations during the various periods, and the positive and negative correlations cancel each other during the entire study period. In terms of spatial changes, these two aspects reveal that the larger the scale, the wider the response range is, and there are differences between the different altitudes.
In addition, it should be noted that since the temperature data selected in this study comprise an average sequence from February to April, although the sequence is related to the trend of annual average temperature changes, there are certain differences. Hence, the data cannot represent continuous temperature changes. Therefore, the possible lead-lag correlations between the temperature and climate signals at the different time scales, such as the monthly or interdecadal time scales, were not analyzed. Finally, since the long-term temperature and climate signals are reconstructed from proxy data, there exists a certain error, which may also be one of the factors that cause the correlation between these two variables to be insignificant, which should be further verified with more comprehensive data.
Acknowledements
This study has been funded by a General Program from the Natural Science Foundation of Shaanxi Province (no. 2014JQ5172), the Open Fund Project of the State Key Laboratory of Loess and Quaternary Geology (no. SKLLQG1611), and the National Forestry Public Welfare Industry Scientific Research Project of China (no. 201304309).
The authors are grateful to the anonymous reviewers for their useful comments and suggestions.
Authors’ contributions
All authors contributed to the study conception and design. Material preparation, data collection and analysis were performed by CZ, JW, SL and LH. All authors read and approved the final manuscript. CZ and JW have co-worked with equal contribution and should be regarded as co-first authors.
References
Gscholar
Gscholar
Gscholar
Gscholar
Gscholar
Gscholar
Gscholar
Gscholar
Gscholar
Gscholar
Gscholar
Gscholar
Gscholar
Gscholar
Gscholar
Gscholar
Gscholar
Gscholar
Gscholar
Gscholar
Gscholar
Gscholar
Gscholar
Gscholar
Authors’ Info
Authors’ Affiliation
Jiachuan Wang 0000-0002-5260-3132
Shuheng Li
Li Hou
College of Urban and Environmental Sciences, Northwest University, Xi’an 710127 (China)
Jiachuan Wang 0000-0002-5260-3132
Shuheng Li
Li Hou
Shaanxi Key Laboratory of Earth Surface System and Environmental Carrying Capacity, Northwest University, Xi’an 710127 (China)
Corresponding author
Paper Info
Citation
Zhang C, Wang J, Li S, Hou L (2022). Multiscale characteristics of the early spring temperature and response to climate indices over the past 179 years in the Qinling Mountains. iForest 15: 491-499. - doi: 10.3832/ifor4069-015
Academic Editor
Roberto Tognetti
Paper history
Received: Jan 20, 2022
Accepted: Sep 22, 2022
First online: Dec 01, 2022
Publication Date: Dec 31, 2022
Publication Time: 2.33 months
Copyright Information
© SISEF - The Italian Society of Silviculture and Forest Ecology 2022
Open Access
This article is distributed under the terms of the Creative Commons Attribution-Non Commercial 4.0 International (https://creativecommons.org/licenses/by-nc/4.0/), which permits unrestricted use, distribution, and reproduction in any medium, provided you give appropriate credit to the original author(s) and the source, provide a link to the Creative Commons license, and indicate if changes were made.

Web Metrics
Breakdown by View Type
Article Usage
Total Article Views: 26255
(from publication date up to now)
Breakdown by View Type
HTML Page Views: 21386
Abstract Page Views: 2523
PDF Downloads: 1873
Citation/Reference Downloads: 0
XML Downloads: 473
Web Metrics
Days since publication: 1338
Overall contacts: 26255
Avg. contacts per week: 137.36
Article Citations
Article citations are based on data periodically collected from the Clarivate Web of Science web site
(last update: Jul 2026)
Total number of cites (since 2022): 4
Average cites per year: 0.80
Publication Metrics
by Dimensions ©
Articles citing this article
List of the papers citing this article based on CrossRef Cited-by.
Related Contents
iForest Similar Articles
Research Articles
Modeling of early stage litter decomposition in Mediterranean mixed forests: functional aspects affected by local climate
vol. 8, pp. 517-525 (online: 18 November 2014)
Research Articles
Climate change may threaten the southernmost Pinus nigra subsp. salzmannii (Dunal) Franco populations: an ensemble niche-based approach
vol. 11, pp. 396-405 (online: 15 May 2018)
Research Articles
Predictive capacity of nine algorithms and an ensemble model to determine the geographic distribution of tree species
vol. 15, pp. 363-371 (online: 20 September 2022)
Research Articles
Model-based assessment of ecological adaptations of three forest tree species growing in Italy and impact on carbon and water balance at national scale under current and future climate scenarios
vol. 5, pp. 235-246 (online: 24 October 2012)
Research Articles
Predicting the effect of climate change on tree species abundance and distribution at a regional scale
vol. 1, pp. 132-139 (online: 27 August 2008)
Research Articles
Ensemble modeling of Pinus cembroides Zucc. distribution under future CMIP6 climate scenarios in northern Mexico
vol. 19, pp. 1-8 (online: 10 January 2026)
Research Articles
Impact of climate change on radial growth of Siberian spruce and Scots pine in North-western Russia
vol. 1, pp. 13-21 (online: 28 February 2008)
Research Articles
Hearing nature’s heartbeat: towards large-scale real-time forest monitoring network in Italy
vol. 18, pp. 202-211 (online: 09 August 2025)
Research Articles
Potential impacts of regional climate change on site productivity of Larix olgensis plantations in northeast China
vol. 8, pp. 642-651 (online: 02 March 2015)
Research Articles
Influence of climate on tree health evaluated by defoliation in the ICP level I network (Romania)
vol. 10, pp. 554-560 (online: 05 May 2017)
iForest Database Search
Search By Author
Search By Keyword
Google Scholar Search
Citing Articles
Search By Author
Search By Keywords
PubMed Search
Search By Author
Search By Keyword


