
The patterns of nearest neighbor trees in a temperate forest
iForest - Biogeosciences and Forestry, Volume 15, Issue 4, Pages 315-321 (2022)
doi: https://doi.org/10.3832/ifor4035-015
Published: Aug 23, 2022 - Copyright © 2022 SISEF
Research Articles
Abstract
The nearest neighbor trees (NNTs) are essential for reflecting forest structure and spatial heterogeneity in a forest stand. It is not clear whether different tree species have varied patterns of NNTs in a small area due to biological interactions, whether big trees affect the nearest neighbors for diversity and recruitments, or whether a universal linear relationship between the distance of NNTs and their average DBH exists. In this study, the information of NNTs at two plots (each 30 × 100 m) in a temperate mixed broadleaved forest in Southern USA was collected by field survey. Our results indicated that approximately 80% of NNTs were within a distance of 1.5-4.0 m. Tulip poplar, oaks, and hickory trees did not have the same species as NNTs or were very limited. Carolina buckthorn had itself as an NNT but with fewer other species. Sugar maple could serve as the NNT for oaks, hickory and others. The relationships between the distance of an NNT and its cumulative percentage were different among varied species or groups. Overall, for trees and their NNTs, there existed complicated relationships between their sizes (e.g., height and DBH). Big trees might affect NNTs in diversity and recruitment. The suggested linear relationship between tree size and distance was not observed. The results could be helpful to manage forest structure (tree species and NNT) and provide evidence to improve the scaling theory on NNTs.
Keywords
Forest Structure, Heterogeneity, Scaling, Species Interaction, Tree Size
Introduction
Forest structure, meaning the arrangement of trees, species, sizes, or age distributions in a vertical and horizontal space ([11]), is an emergent property of a forest community ([31]). Individuals of forest plant species are often aggregated ([14]), so it is essential to study the nearest neighbor trees in any forest community. The most immediate neighborhood (i.e., a community of trees) is one of the crucial characteristics reflecting forest structure and revealing individual trees’ contribution to the heterogeneity at a forest stand scale ([26], [42]). Information on nearest neighborhood distribution in different forest types is needed because these nearest individuals (or species) can play critical roles in forest communities, such as those related to economic impact (e.g., timber production and windbreak) and ecosystem health (e.g., species invasion - [19], [29]).
In ecology, neighborhood patterns have been crucial in explaining species coexistence and community structure. For example, niche theories propose that environmental heterogeneity and biological interactions may lead to spatial clustering because different species have varied niches ([15]); dispersal-assembly theories indicate that dispersal limitation may contribute to the emergence of spatial clustering ([39], [16]). The Janzen-Connell hypothesis ([20], [9]) predicts that widely dispersed seeds far away from parent plants are essential in avoiding the detrimental influence of pathogens, herbivores, seed predators, and seedling competition. These mechanisms have been proposed to explain the diversity of forests as they maintain the survival of many different plant species within one localized region. Here, diversity means that the nearest neighbor tree in a natural forest is a different species. However, it is unclear whether different tree species may vary in response to interacting forces in a small area.
Mapping multiple individual tree species over an area is required to study the nearest neighbors. Plot data, such as from forest inventory, are always helpful. In the USA, forest inventory data were used to create maps of tree species abundance and distribution for the entire eastern part of the country ([38]). However, the forest inventory data are not spatially continuous because the plots are small and discrete; also, seedlings were not included in the forest inventory. Their results may be helpful to explain species patterns at large scales. But for large plots (e.g., 10 ha), topography and forest types may affect the outcome ([36], [1]). For example, a steep slope may disperse seeds far away. Also, it needs a high cost to survey a large plot. For a local scale with relatively homogenous environmental conditions, it would be interesting to have spatially continuous data (e.g., a relatively big plot or transect) including seedlings to study the patterns of nearest neighbor trees.
Studying plant species occurrences, spatial patterns, and nearest neighbor associations in communities at small scales may show their biological interactions ([37], [1]). There are many different methods to study spatial patterns based on the research purpose, such as pair correlation function, Ripley function, O-ring function, nearest neighbor distance index, Voronoi polygon analysis, or uniform angle index ([30]). Direct tree-tree interactions can operate at a small local scale, such as 2-4 m in a tropical forest ([36]). After studying the plant diversity change in temperate forest communities at different spatial scales, it was found that biotic interactions explained the most variation at fine scales ([40]). Species pair-correlation or association with the nearest neighbors may evaluate their interactions. Different interactions (e.g., positive and negative) could form distinct patterns in nearest neighbor trees ([23], [25]). Some species or big trees can have many different species as neighbors, these are called accumulator species; while repeller species have limited species as neighbors ([32]). Previous studies have found a significant effect of large trees on the growth and survival of nearby saplings ([17], [32], [1]). More functionally diverse forest communities had higher recruitment rates in temperate forests in China ([41]). It is possible to hypothesize that big trees have more seedlings than mature trees as their nearest neighbors.
The scaling of nearest neighbor distance was recently proposed by the metabolic theory of ecology, which included individual-level allometric scaling relations for how trees use resources, fill space, and grow ([10]). The prediction indicates that the average distance between individual pairs within a size class scales linearly with trunk radius, dk = c · rk where dk is the average distance of nearest neighbors, c is a constant, and rk is the average stem radius. The authors indicated that spatial data from the large plots of tropical forests in Costa Rica and Panama support this prediction ([10]). It is unclear whether the forest trees in a temperate forest at a small scale would follow this scaling relationship.
Small-scale forest ecological research is essential to local forest management. Understanding scaled phenomena require investigation across different scales ([22], [24], [1]), as results from small scales may differ from large scales due to the complexity of scaling ([4], [8]). These results from small scales can complement the theory, which is based on large scales ([6]). From a forest management perspective, most forest lands in the southern United States are fragmented and belong to many private landowners ([5], [7]). Thus, small-scale forest ecological research is helpful to characterize forest structure and provides implications for local forest management.
This study investigates the pattern of nearest neighbor trees in a temperate forest on a small scale based on the absolute distance. The hypothesis is that to be complementary, the nearest neighbor to a tree would have a high probability of being a different species and of entirely different morphology (e.g., one is big and the other is small). The specific objectives include (i) determining whether there is a general pattern for nearest neighbor trees, whether different tree species have similar patterns for nearest neighbor trees, such as in species composition and tree size, and whether big trees affect their nearest neighbors, such as in size and recruitment; (ii) whether there exists a universal scaling relationship (dk = c · rk) for nearest neighbor trees in this temperate forest, whether different tree species have similar patterns in this scaling relationship; and (iii) implications for forest management at a small scale.
Materials and methods
Study site
The study site is located at Guntersville State Park (34° 23′ 24″ N, 86° 12′ 57″ W) in Marshall County of Alabama, USA. The forest community is a mixed broadleaved (mainly hickories and oaks) forest in the southern region of the USA, and the oldest trees are about 100 years old. There were limited human disturbances (e.g., no timber harvesting) in this forest community during the last five decades. The entire area of plots is within a relatively flat section at the southeastern aspect with a slope of around 10 degrees. This could minimize the contribution of topographic differences. The elevation of the site is about 200 m above sea level, and the soil is a red clay soil type with a silt loam texture (⇒ https://www.nrcs.usda.gov/⇒ https://www.nrcs.usda.gov/). The average air temperature in this region is around 18 °C, and the mean annual precipitation is about 1350 mm (based on recent 20 years’ data from the nearby meteorological station at Huntsville International Airport).
Plot information and methods
Two plots were established. Each plot size is 0.3 ha (100 m in length and 30 m in broadness). These two plots are parallel but separated at 40 m to avoid spatial autocorrelation. All living trees, including woody seedlings in the plots, were surveyed. Tree seedlings are plants with a woody stem but less than 1.3 m in stem height and thus no diameter at breast height (DBH). Based on abundance, the major tree species of the two plots included Carolina buckthorn (Frangula caroliniana [Walter] A. Gray), tulip poplar (Liriodendron tulipifera L.), sugar maple (Acer saccharum Marshall), shagbark hickory (Carya ovata [Mill.] K. Koch), red oak (Quercus rubra L.), white oak (Quercus alba L.), American elm (Ulmus americana L.), black cherry (Prunus serotina Ehrh.), black locust (Robinia pseudoacacia L.) and others. Some 1368 tree individuals (including seedlings) on plot 1 and 591 tree individuals on plot 2 were recorded.
For each tree in the plots, its location (x, y), DBH, canopy diameter, and tree total height were recorded. Only one tree (or seedling) with the shortest distance was selected based on its distance to nearby trees. Tree height was measured by a Pulse Rangerfinder® Hypsometer (Laser Technology Inc., Centennial, CO, USA). The mean canopy diameter of each tree was estimated from measurements in two opposite directions (e.g., north-south and east-west) by a tape with an accuracy of 1 cm. The circumference at breast height (1.3 m) was measured by a tape with an accuracy of 1 mm. DBH was calculated by transforming circumference. For each seedling, the circumference at the stem bottom (interface at the soil surface) was used to estimate its stem diameter. Each tree was considered as a standard cylinder, and the tree occupying volume (V) was calculated from canopy diameter (CD) and tree height (h) as the following (eqn. 1):
As for the big tree (height ≥ 5 m) size, height was classified as follows: [5-10 m), i.e., height ≥ 5 m but < 10 m; [10-15 m); [15-20 m); and ≥ 20 m. For each big tree, the nearest neighbor tree species and whether it was a seedling were recorded. The ratio of species for big trees was calculated as the species number of the nearest neighbors divided by the species number of big trees in each height class. If the ratio of species is more than 1.0, the big trees are considered accumulator species that can increase species diversity; otherwise, the big trees are considered repellers. The same idea was used for seedlings; the ratio of seedlings was calculated as the number of seedlings within the nearest neighbors divided by the number of big trees in each class. If the ratio of seedlings is high (such as 1.0), the big trees may be considered beneficial to seedlings.
The distance (d) between each tree and its nearest neighbor tree was calculated from their locations. The average DBH of the nearest tree pair was estimated as (DBH1+DBH2)/2. The ratios of height, DBH, and volume for the nearest tree pairs were calculated by h1/h2, DBH1/DBH2, and V1/V2, respectively. To make the result easy to read, here these ratios (h1/h2, DBH1/DBH2, and V1/V2) were calculated with the greater value as the numerator and were thus always ≥1.
Spearman’s correlation was conducted between the distance of nearest neighbors and morphological characters of trees (e.g., ratio in height, DBH, and V) by SAS software v. 9.3, (SAS Institute Inc., Cary, NC, USA) with the statistical significance at p < 0.05.
Results
There were 1368 trees, including 703 seedlings at plot 1, and 591 trees, including 110 seedlings at plot 2. Tree height varied from 0.1 m to 43.4 m in the plots, and the average tree height was 4.3 m in plot 1 and 12.7 m in plot 2. The average DBH was 4.7 cm in plot 1 with the range from 0.3 cm to 84.4 cm, and the average DBH was 14.3 cm in plot 2 with the range from 0.15 cm to 95.6 cm.
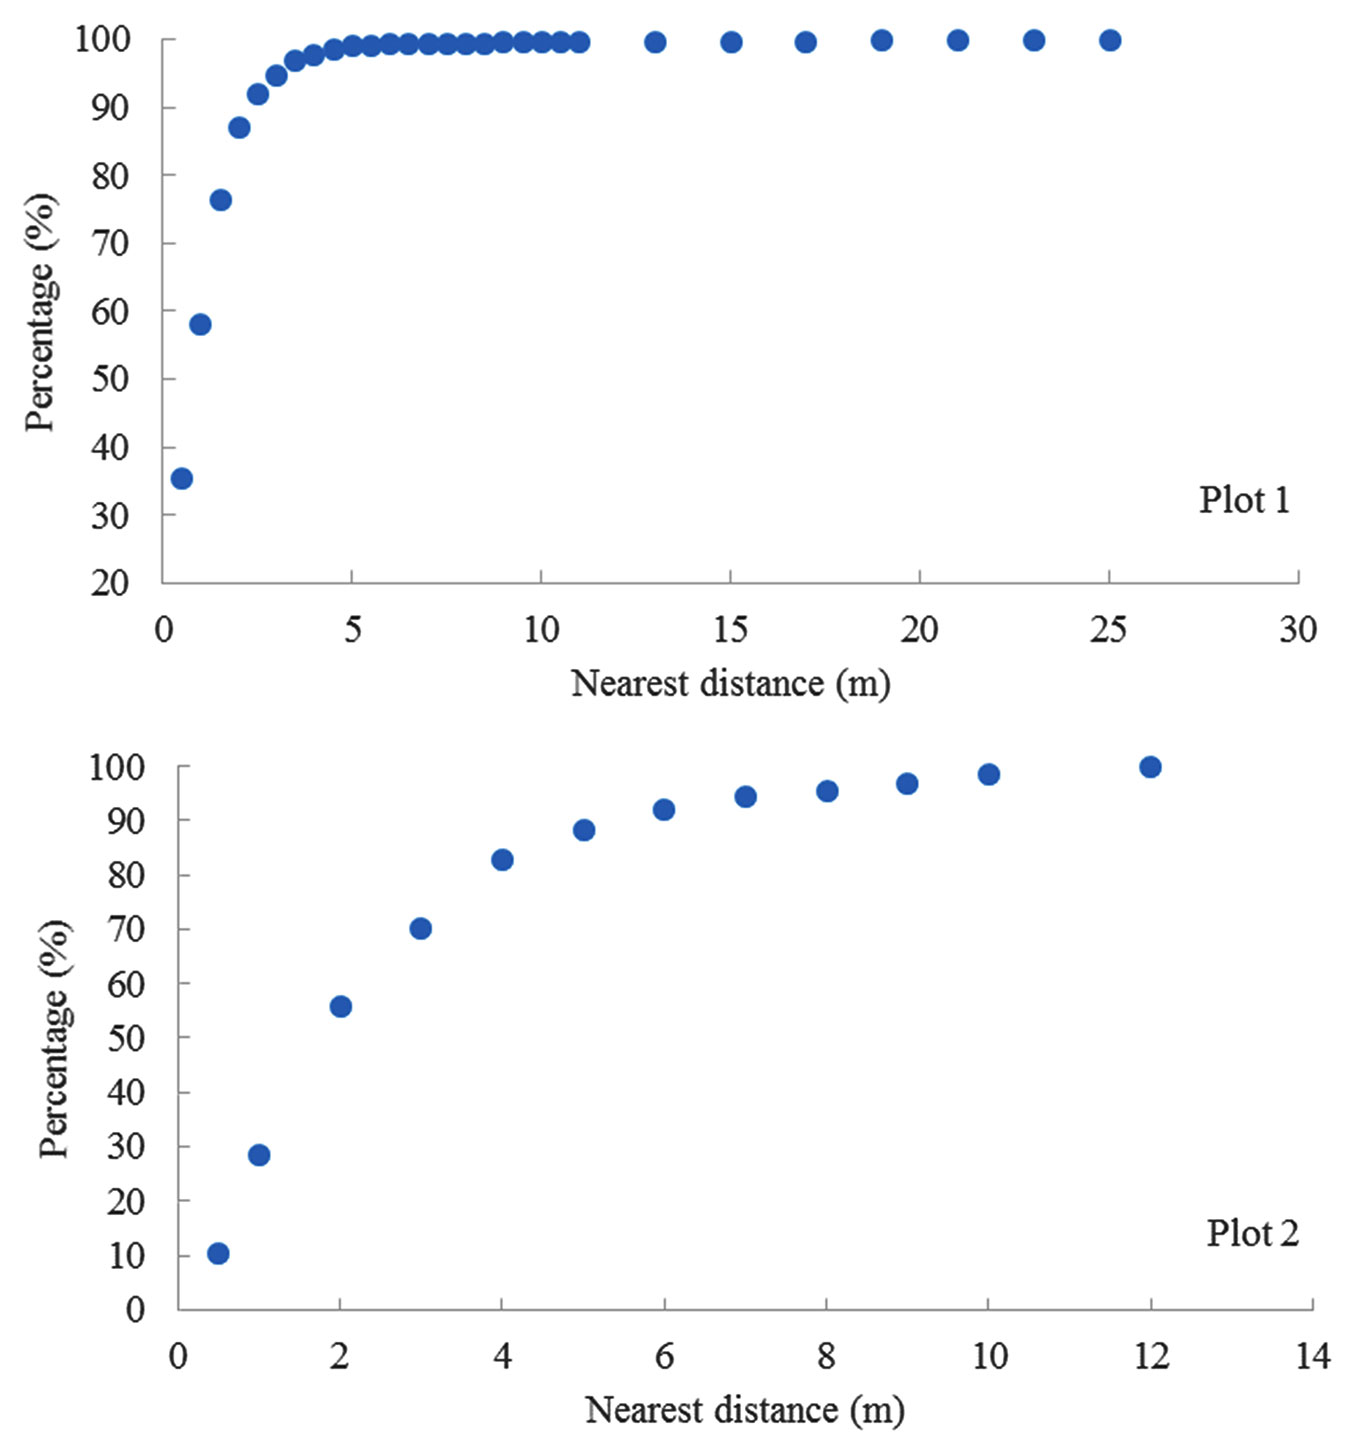
The distance of nearest neighbor trees ranged from 0.1 m to 7.19 m for overall individuals in plot 1 and 0.1 m to 11.42 m in plot 2. There were approximately 76% of nearest neighbor trees within a 1.5 m distance in plot 1 and 82% of nearest neighbor trees within a distance of 4 m in plot 2 (Fig. 1). Some tree species did not have the same species as the nearest neighbor trees or were very limited (Tab. 1), such as tulip poplar, oaks, and hickory trees. Other species only had the same species as nearest neighbor trees and limited other species, such as Carolina buckthorn. Others could live with the same species or other species, such as American elm and black locust. Oaks and hickory trees both lived with sugar maple as nearest neighbor trees.
Fig. 1 - The cumulative percentage of nearest neighbor trees by distance.
Tab. 1 - Information of nearest neighbor trees in plots.
| Tree species (or group) |
Average distance (range, m) |
Nearest neighbor trees |
|---|---|---|
| Tulip poplar | 1.18 (0.10 ~ 2.98) | NO tulip poplar, but with others, 99% are Carolina buckthorn, 1% are hickory, persimmon, Eastern redbud, etc. |
| Oaks | 1.57 (0.1 ~ 5.00) | NO oaks, but with American elm, Carolina buckthorn, etc. |
| Hickory | 1.24 (0.10 ~ 5.70) | Very limited hickory (1%), but 99% with other trees |
| Carolina buckthorn | 0.88 (0.10 ~ 7.19) | 98% are Carolina buckthorn, limited other trees |
| American elm | 1.27 (0.14 ~ 3.34) | American elm and other trees |
| Black locust | 1.08 (0.10 ~ 2.60) | Black locust and other trees |
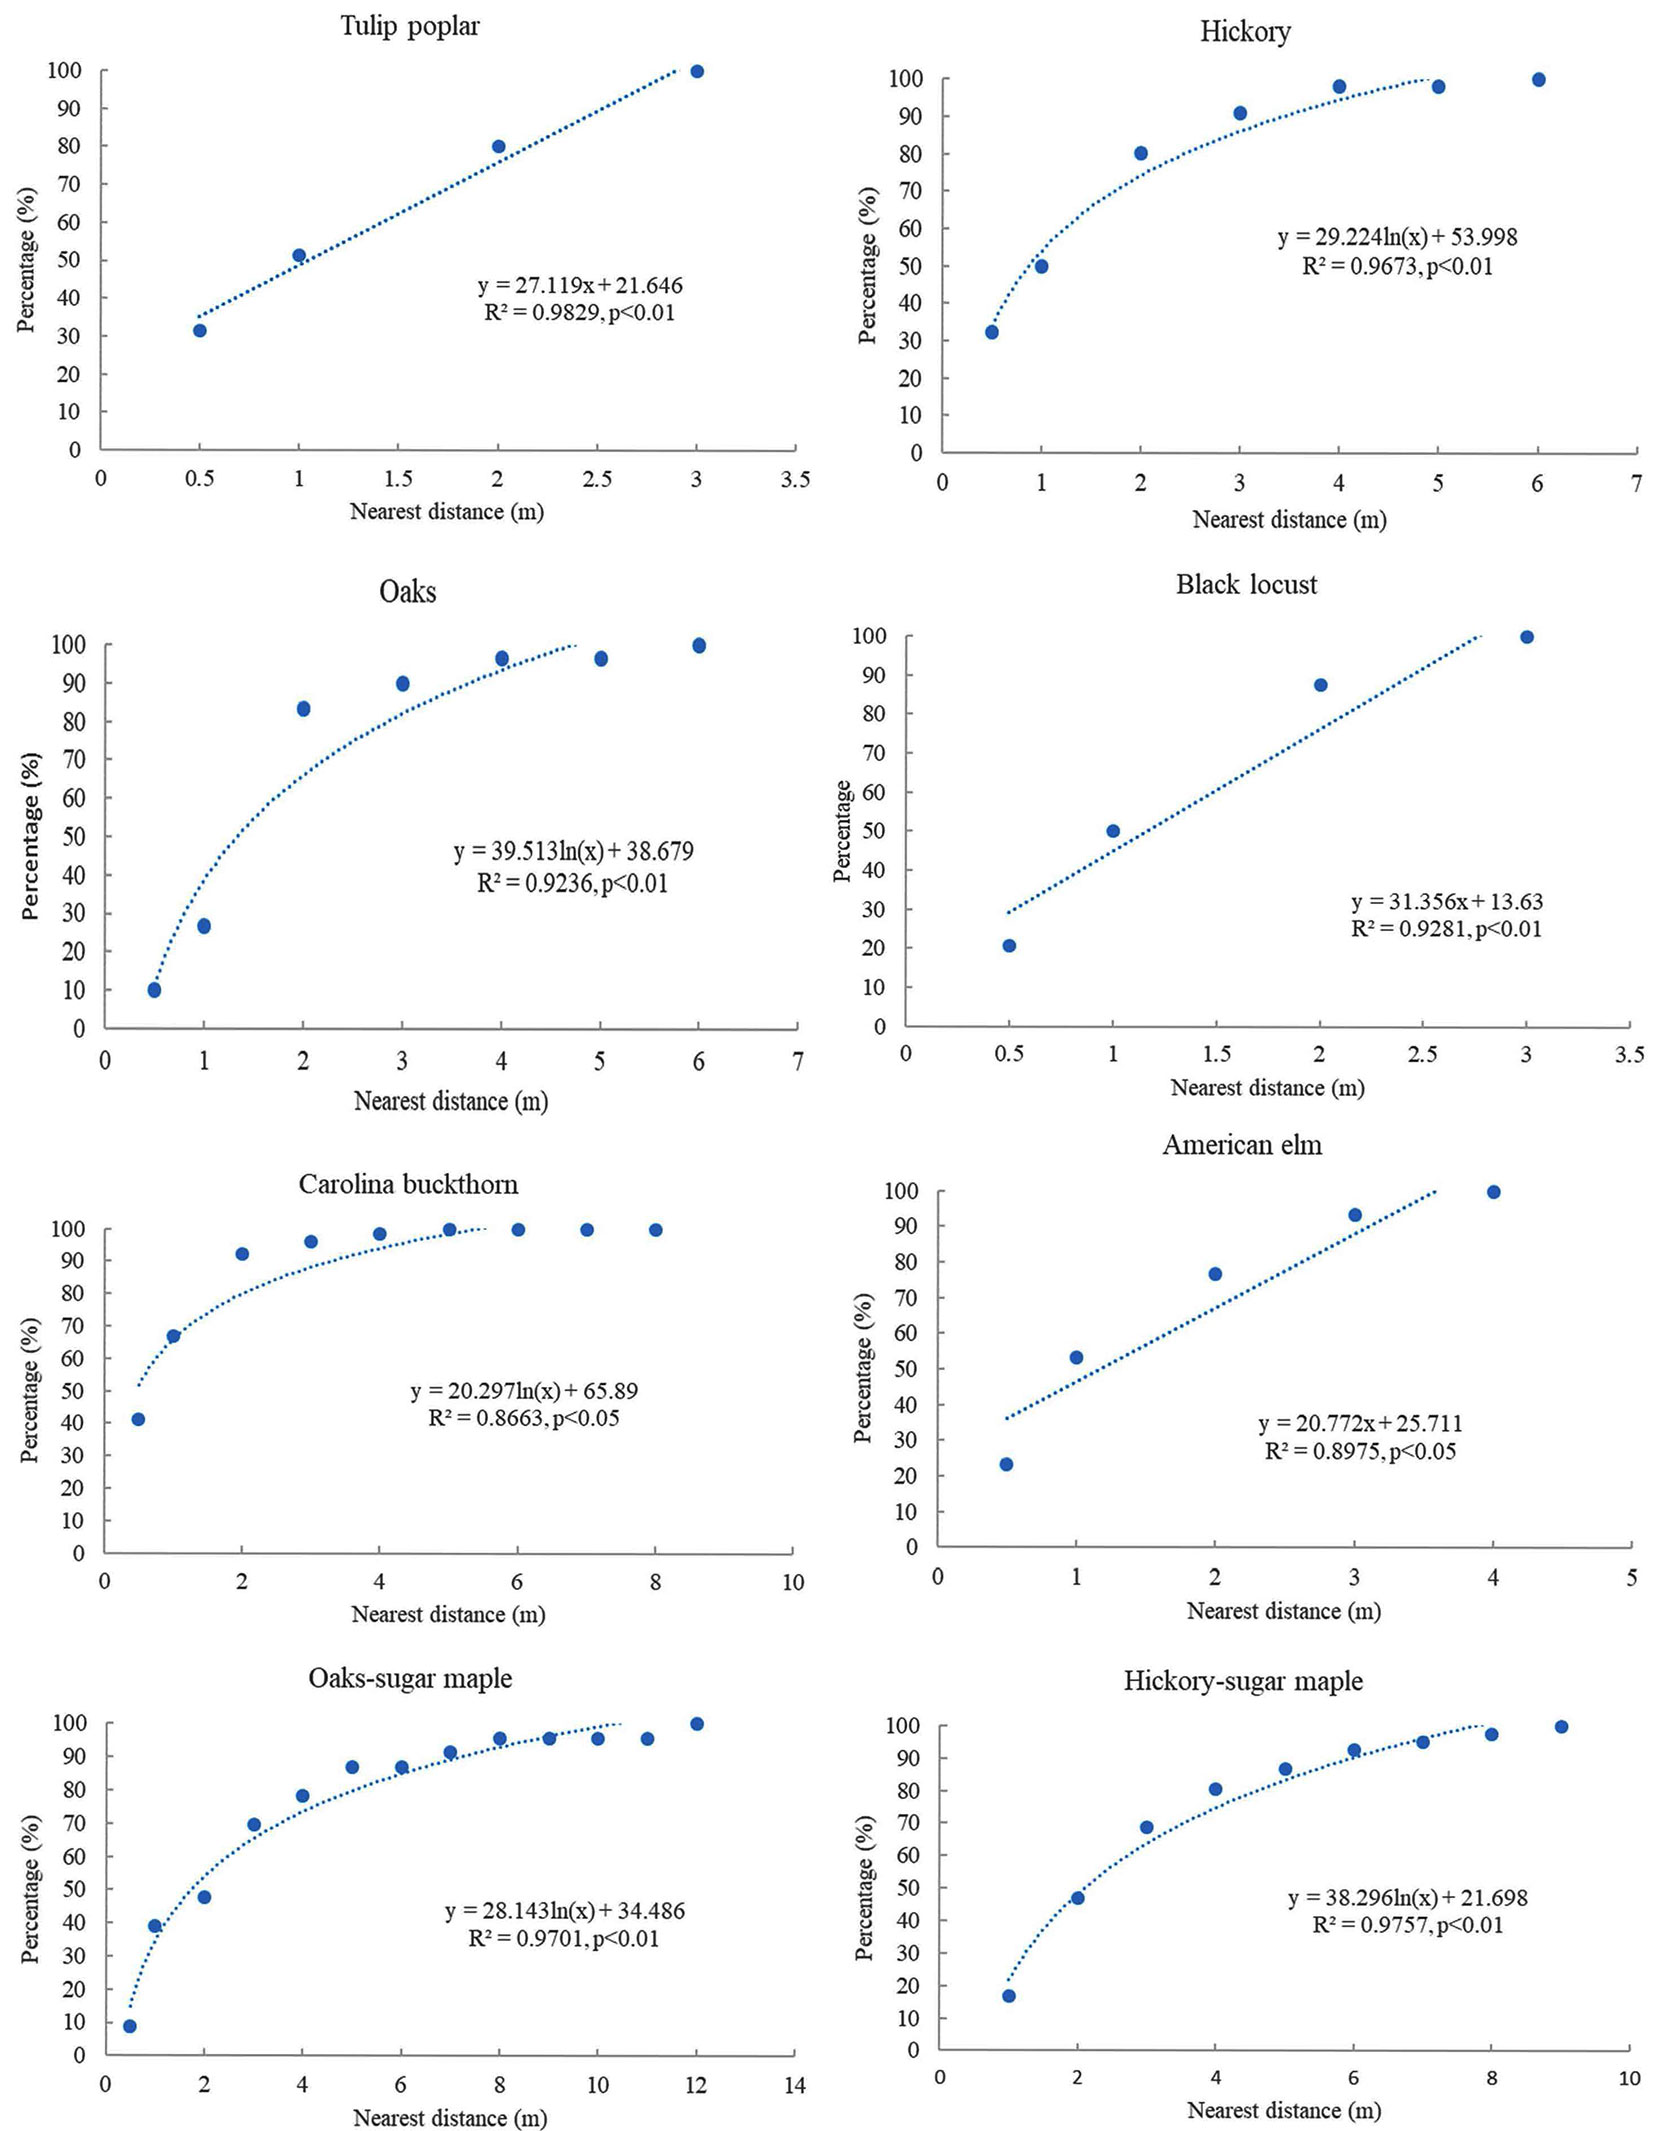
The relationships between the distance of nearest neighbor trees and the cumulative percentage were different among varied species or groups (Fig. 2). The correlation between the distance of nearest neighbor trees and the accumulated percentage was linearly significant for tulip poplar, American elm, and black locust in plot 1. For other species (or groups), there existed nonlinear relationships (e.g., logarithmic form) with a saturation point at both plots.
Fig. 2 - Relationships between the distance of nearest neighbor trees and accumulated percentage for different species or groups at two plots.
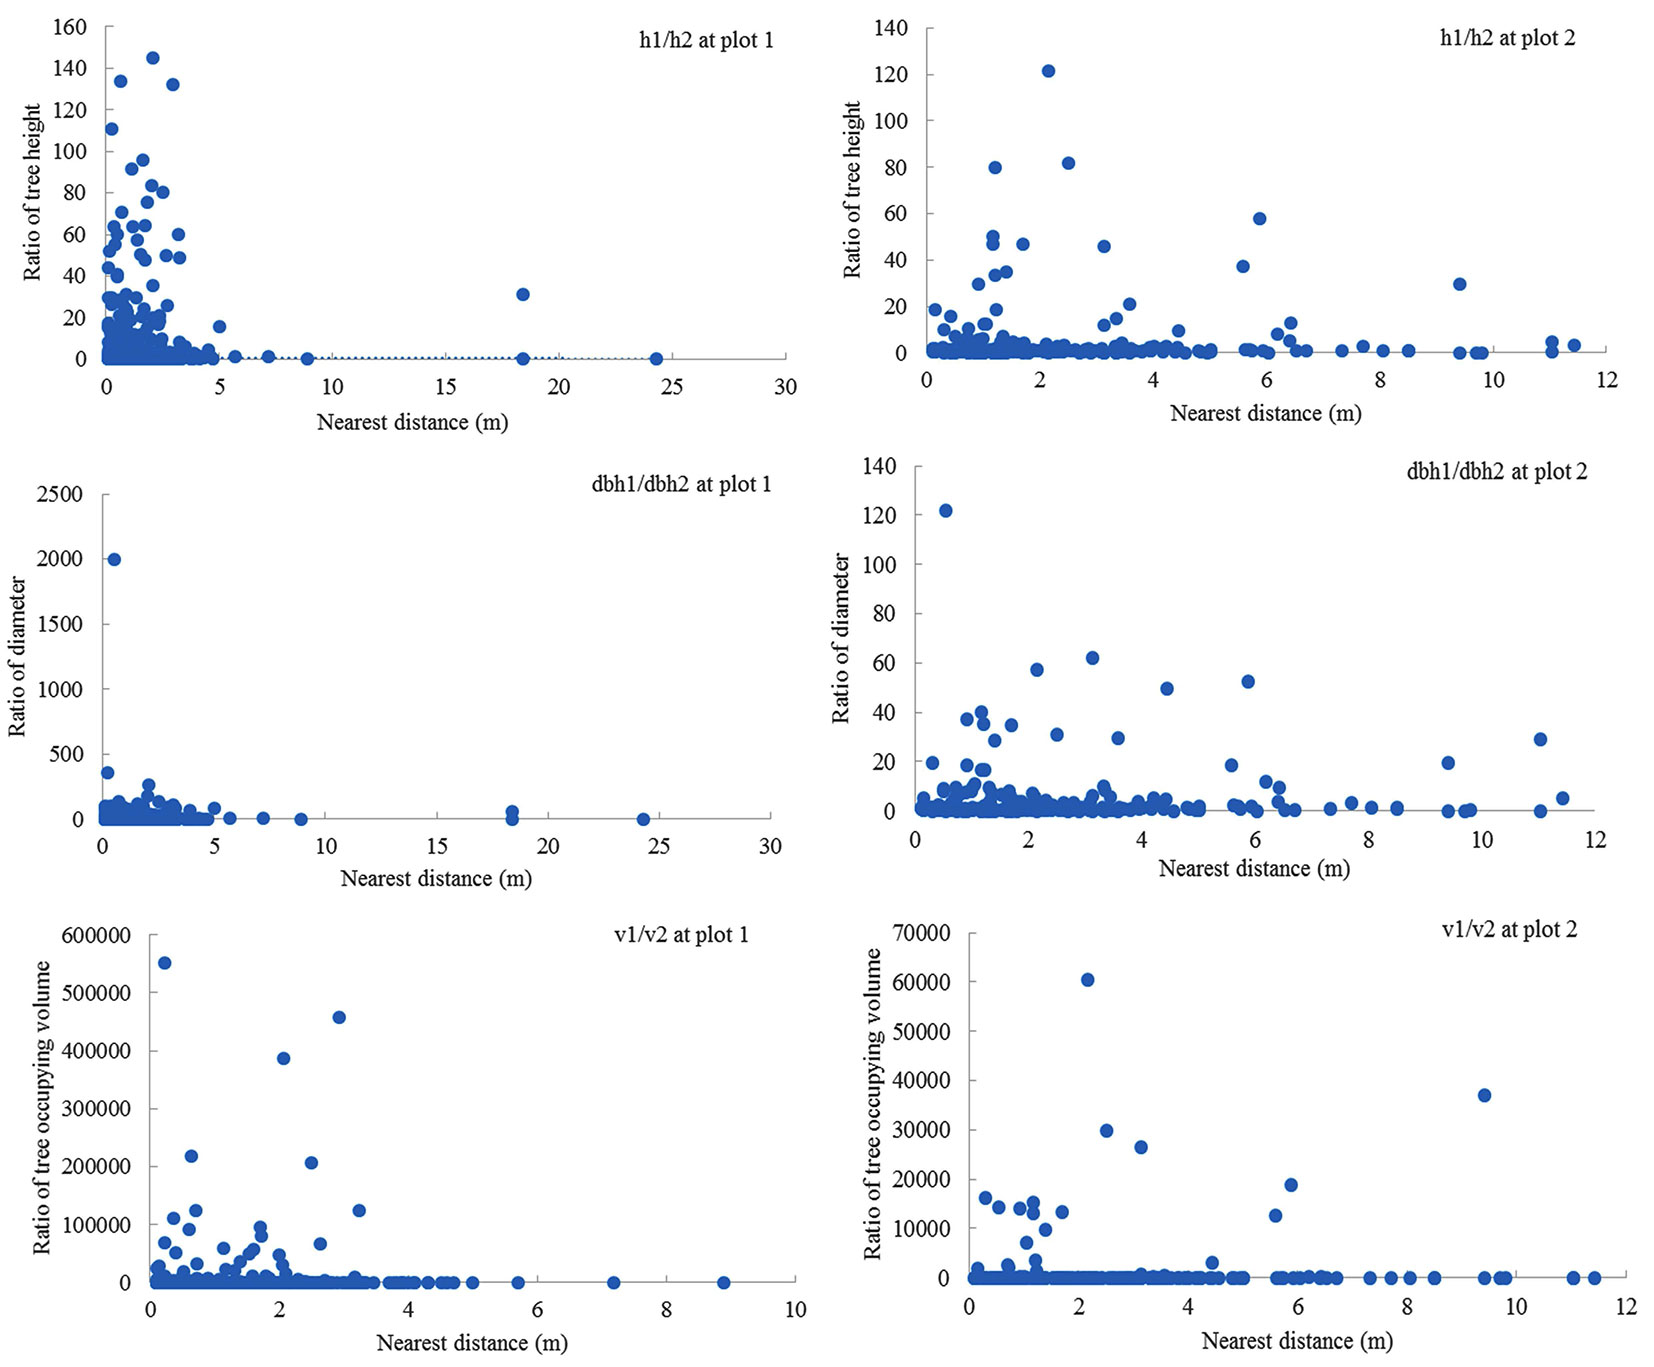
There were no clear relationships in size (e.g., height, DBH, and V) between trees and their nearest neighbors (Fig. 3). High variations in size ratios usually appeared within the distance of 4 m. Around a big tree (i.e., a high ratio), there were usually many small trees (i.e., small ratios) at multiple vertical layers. The patterns in ratio distribution were slightly different in the two plots (e.g., the nearest distance and multiple layers). Some negative relationships seemed to exist for these outlier points, such as h1/h2 and V1/V2, but these relationships were not statistically significant. Similar patterns existed among different tree species or groups, such as tree height vs. tree height of nearest neighbors.
Fig. 3 - Various relationships were observed in the sizes (height, DBH, and V) between trees and their nearest neighbors.
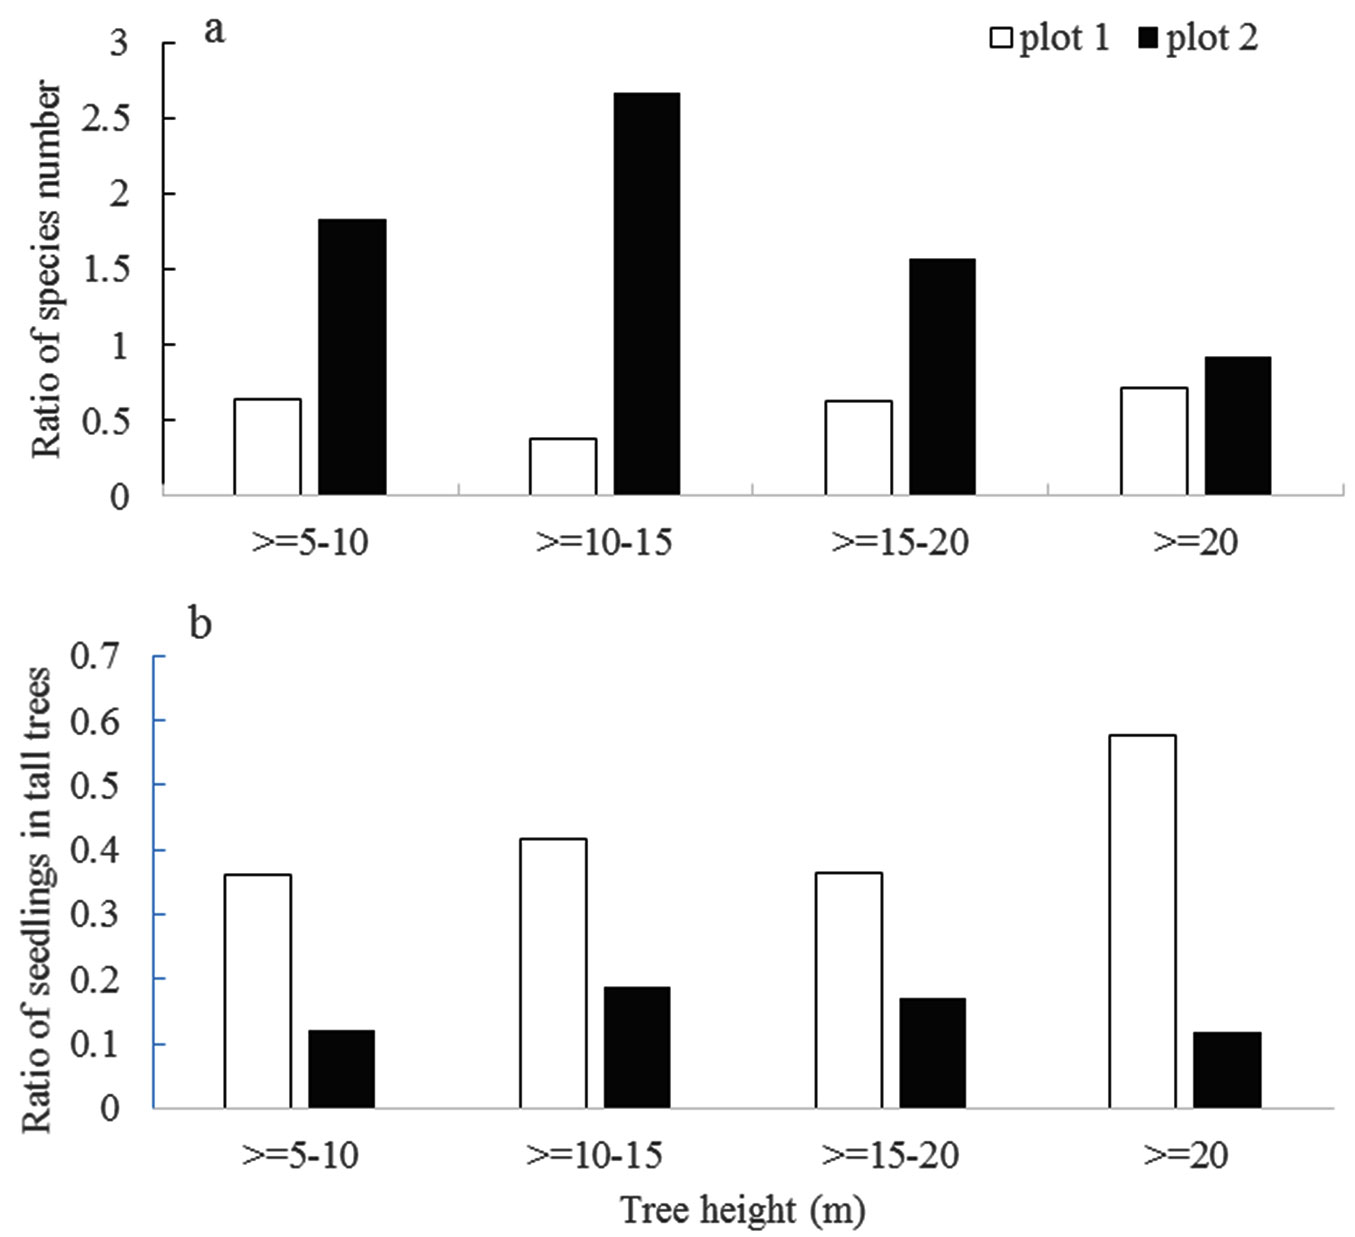
Big trees may affect the diversity of nearest neighbors (Fig. 4a). The ratios of species numbers were higher in plot 2 than in plot 1. Big trees may also affect the nearest seedling distribution (Fig. 4b). The ratio of seedlings in the big trees was relatively high in the height class of ≥20 m in plot 1, but it was relatively high in the height class of 10-15 m in plot 2.
Fig. 4 - Big trees affect species diversity (a) and seedlings (b) in the nearest neighbor trees.
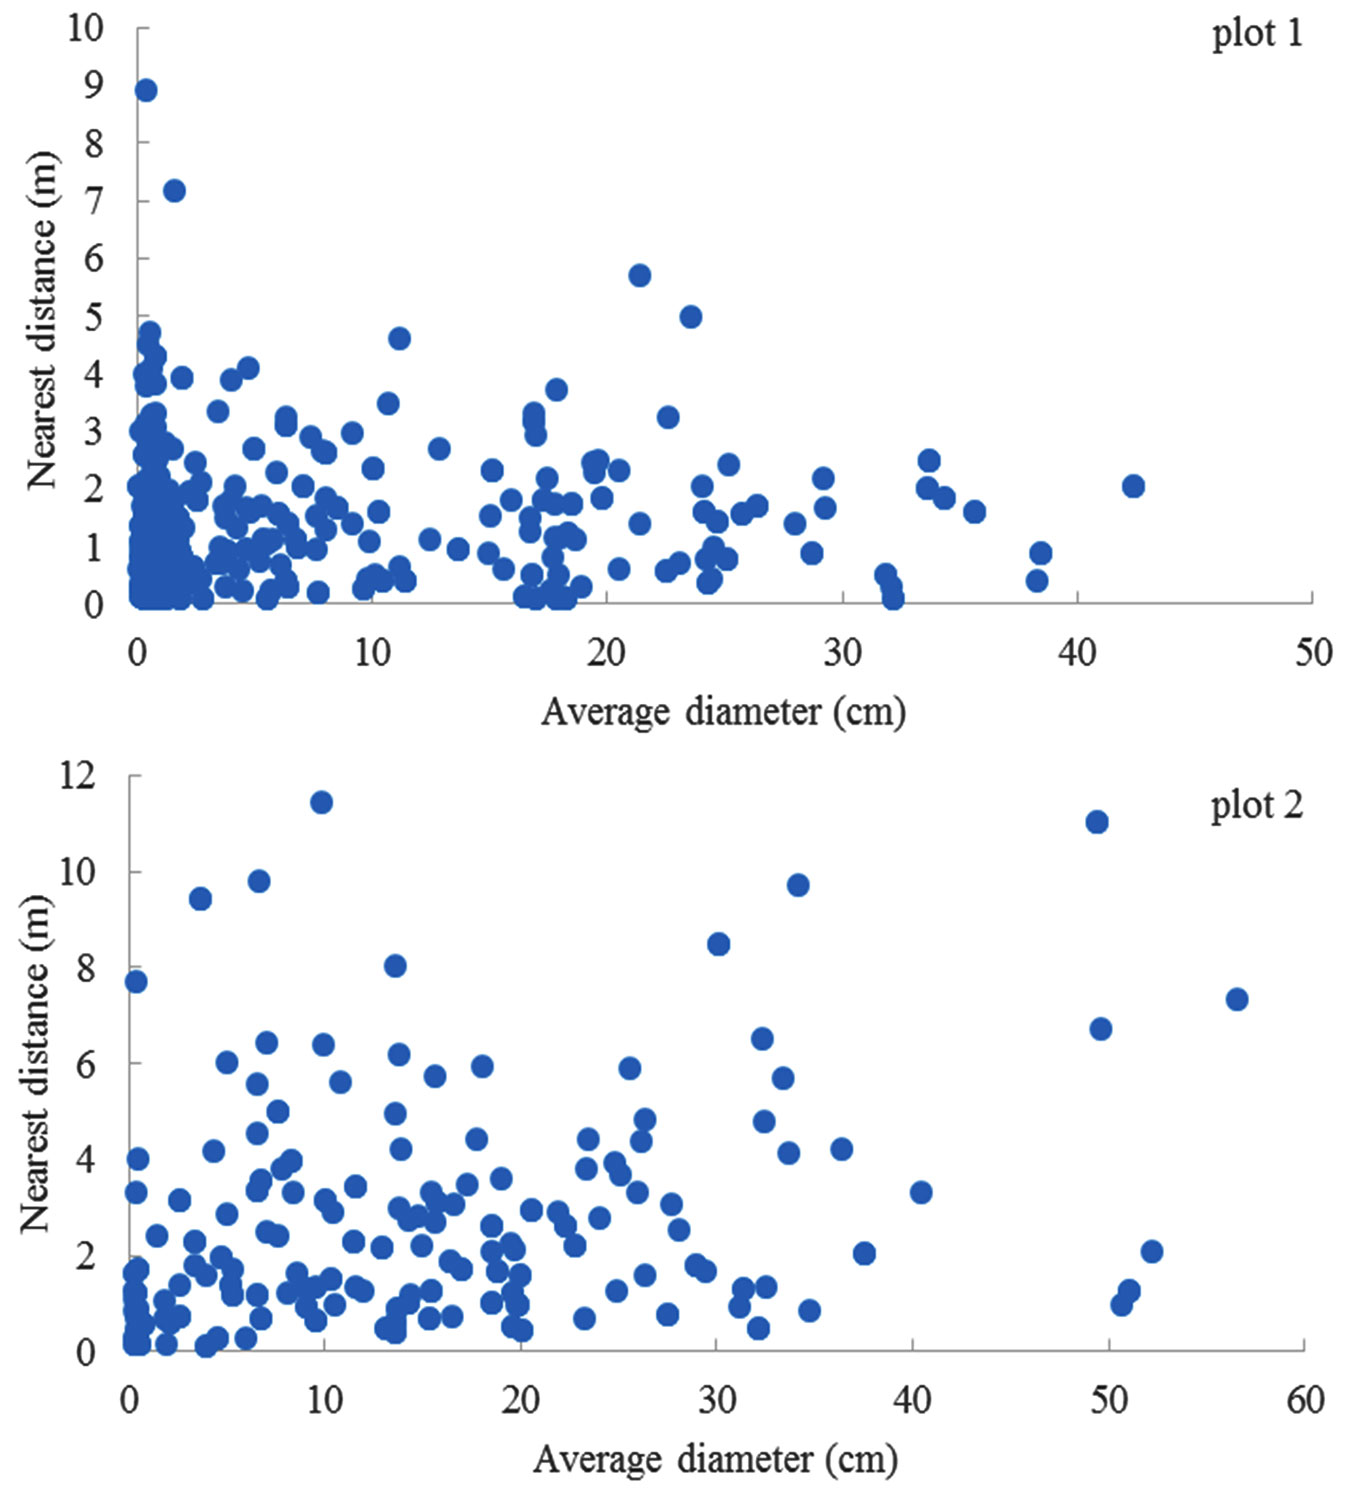
A positive linear relationship between the distance of nearest neighbor trees and their average DBH was not observed in both plots (Fig. 5). Similar patterns were also observed at the species or group level.
Fig. 5 - Relationship between the distance of nearest neighbor tree pairs and their average DBH.
Discussion
Different tree species may have varied characteristics to influence the nearest neighbor trees since the plots are small and relatively homogeneous in environmental factors. Differences between plots in this study (as in Fig. 1 and Fig. 4) may have been due to or augmented by trees and stand characteristics. For example, plot 1 had over twice as many trees (1368 vs. 591) and more than double the percentage of saplings (51% vs. 19%) as plot 2. Bias may exist for the trees around plot boundaries, but it should be limited due to the sample size of hundreds of trees within each plot. Based on whether the nearest neighbor tree species was the same species/group or not, three groups could be classified: those that mainly had homospecific neighbors, those that had mostly heterospecific neighbors, and those that had both. The emergent interactions with the nearest neighbor trees in the community networks may be varied for species at different locations (e.g., plot 1 and plot 2). There were many Carolina buckthorn and sugar maple in plot 1 and plot 2, respectively. But most Carolina buckthorn lived with themselves as nearest neighbor trees, while sugar maple lived with nearest oaks, hickories, and other trees. It appears that sugar maple is a prevalent tree species and can live with oaks, hickory, and others as the nearest neighbors. However, if the space between any pairs of trees is too close (such as 10 cm in this study), natural resources, such as light and soil water, may become limited, causing one or multiple trees to suffer dieback from poor nutrition or moisture. Both the dispersal-assembly theories and the Janzen-Connell hypothesis may explain the pattern of nearest neighbor trees.
The result of nearest tree species is consistent with the previous finding that the heterogeneous information from a fine-scale can provide different outcomes and model-based estimates than those from a large scale ([38], [42]). Accumulator or repeller species were used to describe this kind of variation in a tropical forest ([32]). In this case, some patterns existed in the association of trees and their nearest neighbor species. The detailed description of the patterns may provide a deep insight into the biology of the species interactions in community networks and generate hypotheses.
The regime in the distance distribution for nearest neighbor trees could be different among various species or groups. For tulip poplar, American elm, and black locust, there was a significant correlation between the distance of nearest neighbor trees and accumulated percentage in plot 1. The relationship was different for the other species (oaks, hickory, and Carolina buckthorn) but these relationships follow logarithmic forms. Our results support that multiple scales may exist in the distribution of distances with nearest neighbors within the smaller-scaled level itself ([36],b). The distance threshold (90% of accumulated frequency) may be related to the spatial autocorrelation in the distribution of the nearest neighbor trees. These thresholds varied slightly with species. The distance threshold for different species was about 2 m for Carolina buckthorn, 2.5 m for black locust, 2.5 m for tulip poplar, 3 m for hickories, 3 m for oaks, and 3 m for American elm, respectively. These trees have approximately 90% of nearest neighbor trees within 2-4 m, which could mean relatively high connectivity to the nearest neighbor trees compared to those in more than 10 m. It was proposed that the connectivity to the nearest neighbor trees could be influenced by (i) population density and local community dynamics; (ii) habitat quality and spatial configuration; and (iii) species’ migration and behavior ([27]). Further multiscale research on community structure could be conducted from this data set. The related processes might include disturbance, mortality, colonization, reproduction, recruitment, growth, competition, and senescence ([12], [2]). The net balance of negative or positive species-species interactions could result in distinct spatial patterns in the placement of neighboring species and have the potential to generate spatial structure ([23]). The smaller distances to nearest heterospecific neighbors were more likely to be accumulators; otherwise, the long distance might mean repellers ([32]). The result indicates that the distance frequency to nearest neighbor trees might be used to characterize the structural heterogeneity in a temperate forest community.
To co-exist, trees and their nearest neighbors are hypothesized to be of either small or differing sizes (e.g., height, diameter, and occupying volume). However, this relationship was not evident in this study, where the ratios of tree size were varied. Tree size is an essential structural element that affects resource use, growth, reproduction, and allometry at a small scale ([35]). A more or less inverse relationship between the sizes was often found in multi-layered temperate forests because of species’ shade tolerance ([28]); such as fast-growing, short-lived tree species can reach over-story canopy from gaps while shade-tolerant trees grow beneath them ([23]). This structure is considered to have high vertical heterogeneity with “balanced” or “equilibrium” population structures ([13], [34]). Since only one tree was selected for the nearest neighbor in this study, analysis of this relationship may be incomplete. For example, the size ratios might be massive for a forest structure with more understory woody plants (e.g., seedlings and shrubs) because there were many low-ratio values. The big trees (tall trees) in this study could affect the nearest neighbors in species diversity and seedlings on some occasions (such as in plot 2), but there was no consistent pattern. This result is similar to Punchi-Manage et al. ([32]), who proposed that stochastic dilution might contribute. Stochastic dilution refers to a consequence of the stochastic geometry of biodiversity where the identities of the nearest neighbors of individuals of a specific species are hard to be predictable. Under this circumstance, the outcome of deterministic species interactions may vary among individuals of a particular species. Thus, both tree species or groups and their sizes influence the nearest neighbor trees in a complicated way.
The scaling relationship between the distance of nearest neighbor trees and their average DBH, as suggested by Enquist et al. ([10]) was not observed for overall individuals or species groups in this study. The theory is based on individual-level allometric scaling relations for how trees use resources, fill space, and grow under ideal conditions. But in nature, trees can still grow and survive under inevitable stress in resources, such as drought ([3]). Some previous studies indicated that the asymmetric competition for light among trees in forest stands could affect the scaling relationships ([21], [33], [18]). Trees could have diverse scaling relationships in their average diameter and the nearest distance for the tree pairs because these varied scaling relationships exist in tree allometric scaling ([6]). This result may provide a case for the limitation of the Metabolic Scaling Theory.
The results from this study could provide implications for forest management. Traditional forest management emphasizes species composition at stand level or releasing suppressed trees, but does not quantitatively include the distance to the nearest neighbor trees. Management practices could be made more efficient if new tree configurations in a stand were considered before conducting alterations. In this region, logging, thinning, and prescribed burning are mainly related to the nearest neighbor trees. First, species-species interactions from the nearest neighbor trees need to be considered. We need to realize that some species may not have the same species as their nearest neighbor trees, such as tulip poplar trees. But in this study, sugar maple trees lived with all other species as nearest neighbors. This emergent pattern could be caused by species interactions within community networks, possibly related to pathogens or allelopathy. After logging or thinning, it may be better if some tree species are not the nearest neighbors to themselves. For example, in the absence of disturbance or human activities (e.g., prescribed burning), the Carolina buckthorn may form a patch because it may like to live as its own nearest neighbor so that other species cannot invade. This characteristic is suitable for even-aged plantations. Second, maintaining a distance with the nearest neighbor trees, such as 3 m or more, may result in fewer suppressed trees. Based on given tree sizes, it is possible to estimate the naturally-occurring optimum distance for the nearest neighbors from the algorithms in this study. Third, the dimensions of nearest neighbor trees need to be managed. Under a big tree, only small trees with shade tolerance can survive. Taking out a big tree or trimming its big canopy (e.g., disbranch) may increase the growth of neighbor trees. Big trees might affect the nearest neighbors in species diversity and seedling recruitment, but this pattern may be inconsistent across sites. Forth, the scaling relationships derived from Metabolic Scaling Theory, such as the distance of nearest neighbor trees and their average DBH, may not be applicable in a southern USA temperate forest area. These scaling relationships should be tested before applications.
Conclusions
After studying the patterns of nearest neighbor trees at a small scale in a temperate forest through intensive tree mapping, there existed some patterns in suitable species and distances to nearest neighbors, which differed by species or group. However, detailed biological mechanisms need to be investigated further. Realizing the patterns of suitable species and distances to nearest neighbors may be helpful to the management of local natural forests and plantations, especially when considering the management practices of logging, thinning, and prescribed burning. Some results, which conflict with the scaling theory on large scales, may complement the development of the Metabolic Scaling Theory. Current advances in quality and reductions in the cost of remotely sensed tools are providing new opportunities for spatially explicit monitoring.
Acknowledgments
The authors are thankful to Matthew Shaw, Lawson Quick, and Michael Brown for their help in fieldwork and also to the Guntersville State Park Administration for accessing the site. This research was supported by the USDA National Institute of Food and Agriculture McIntire Stennis project (1008643) and the Capacity Building Program (2021-38821-34596).
References
Gscholar
Gscholar
Authors’ Info
Authors’ Affiliation
Kimberly A Bowman 0000-0002-7082-8458
Department of Biological & Environmental Sciences, Alabama A & M University, Normal, AL 35762 (USA)
Corresponding author
Paper Info
Citation
Chen X, Bowman KA (2022). The patterns of nearest neighbor trees in a temperate forest. iForest 15: 315-321. - doi: 10.3832/ifor4035-015
Academic Editor
Maurizio Marchi
Paper history
Received: Dec 09, 2021
Accepted: Jun 20, 2022
First online: Aug 23, 2022
Publication Date: Aug 31, 2022
Publication Time: 2.13 months
Copyright Information
© SISEF - The Italian Society of Silviculture and Forest Ecology 2022
Open Access
This article is distributed under the terms of the Creative Commons Attribution-Non Commercial 4.0 International (https://creativecommons.org/licenses/by-nc/4.0/), which permits unrestricted use, distribution, and reproduction in any medium, provided you give appropriate credit to the original author(s) and the source, provide a link to the Creative Commons license, and indicate if changes were made.

Web Metrics
Breakdown by View Type
Article Usage
Total Article Views: 32387
(from publication date up to now)
Breakdown by View Type
HTML Page Views: 27455
Abstract Page Views: 2446
PDF Downloads: 1924
Citation/Reference Downloads: 4
XML Downloads: 558
Web Metrics
Days since publication: 1420
Overall contacts: 32387
Avg. contacts per week: 159.65
Article Citations
Article citations are based on data periodically collected from the Clarivate Web of Science web site
(last update: Mar 2025)
(No citations were found up to date. Please come back later)
Publication Metrics
by Dimensions ©
Articles citing this article
List of the papers citing this article based on CrossRef Cited-by.
Related Contents
iForest Similar Articles
Research Articles
Do different indices of forest structural heterogeneity yield consistent results?
vol. 15, pp. 424-432 (online: 20 October 2022)
Research Articles
Spatial structure of the vertical layers in a subtropical secondary forest 57 years after clear-cutting
vol. 12, pp. 442-450 (online: 16 September 2019)
Research Articles
Fluctuation of the ecological niche of Moringa peregrina (Forssk.) Fiori with topoclimatic heterogeneity in southern Iran
vol. 16, pp. 53-61 (online: 16 February 2023)
Research Articles
Outplanting performance of three provenances of Quillaja saponaria Mol. established in a Mediterranean drought-prone site and grown in different container size
vol. 13, pp. 33-40 (online: 21 January 2020)
Research Articles
Individual-based approach as a useful tool to disentangle the relative importance of tree age, size and inter-tree competition in dendroclimatic studies
vol. 8, pp. 187-194 (online: 21 August 2014)
Research Articles
Trade-offs and spatial variation of functional traits of tree species in a subtropical forest in southern Brazil
vol. 9, pp. 855-859 (online: 07 July 2016)
Short Communications
The importance of tree species and size for the epiphytic bromeliad Fascicularia bicolor in a South-American temperate rainforest (Chile)
vol. 13, pp. 92-97 (online: 10 March 2020)
Research Articles
Scale dependency of the effects of landscape structure and stand age on species richness and aboveground biomass of tropical dry forests
vol. 16, pp. 234-242 (online: 23 August 2023)
Research Articles
Alternative methods of scaling Eucalyptus urophylla trees in forest stands: compatibility and accuracy of volume equations
vol. 11, pp. 275-283 (online: 29 March 2018)
Research Articles
The effect of seed size on seed fate in a subtropical forest, southwest of China
vol. 9, pp. 652-657 (online: 04 April 2016)
iForest Database Search
Search By Author
Search By Keyword
Google Scholar Search
Citing Articles
Search By Author
Search By Keywords
PubMed Search
Search By Author
Search By Keyword


