Modeling the risk of illegal forest activity and its distribution in the southeastern region of the Sierra Madre Mountain Range, Philippines
iForest - Biogeosciences and Forestry, Volume 15, Issue 1, Pages 63-70 (2022)
doi: https://doi.org/10.3832/ifor3937-014
Published: Feb 21, 2022 - Copyright © 2022 SISEF
Research Articles
Abstract
Illegal activity within protected forests, such as illegal logging, slash-and-burn farming, and agricultural expansion, has brought many plant and animal species to the brink of extinction and threatens various conservation efforts. The Philippine government has introduced a number of actions to combat environmental degradation, including the use of mobile platforms such as the SMART-Lawin system to collect patrol data from the field, which represents a remarkable step towards data-driven conservation management. However, it remains difficult to control illegal forest activity within protected landscapes due to limited patrol and law enforcement resources. A better understanding of the spatial distribution of illegal activity is crucial to strengthening and efficiently implementing forest protection practices. In the present study, we predicted the spatial distribution of illegal activity and identified the associated environmental factors using maximum entropy modeling (MaxEnt). Patrol data collected using the SMART-Lawin system from the Baliuag Conservation Area for the period 2017-2019 were used to train and validate the MaxEnt models. We tuned the MaxEnt parameter setting using the ENMeval package in R to overcome sampling bias, avoid overfitting, and balance model complexity. The resulting MaxEnt models provided a clear understanding of the overall risk of illegal activity and its spatial distribution within the conservation area. This study demonstrated the potential utility of data-driven models developed from patrol observation records. The output of this research is beneficial for conservation managers who are required to allocate limited resources and make informed management decisions.
Keywords
Philippines, SMART, Ranger Patrol Data, Illegal Forest Activity, Protected Area Management
Introduction
Due to their diverse landscapes, the forests in the Philippines are considered one of the most significant global biodiversity hotspots and an important conservation target ([20]). However, Philippine forests and their biodiversity have been degraded at an alarming rate due to a combination of illegal anthropogenic forest activity, such as illegal logging, slash-and-burn farming, mining, and charcoal production, and biophysical phenomena, such as typhoons, floods, and landslides ([33]). Illegal activity associated with the extraction of natural resources has reduced forest cover and biodiversity in protected areas in the Philippines ([3]), while the growing demand for forest resources by local communities makes it more challenging to manage these areas and their natural resources ([17]).
Earlier studies have emphasized that the threats to biodiversity are directly associated with the excessive utilization of resources, developmental activity, and the increasing population in the Philippines ([38]). From 2000 to 2005, the Philippines lost about 0.1 million ha of its forest cover (2.1% of the overall forested area) annually due to illegal logging, the second-fastest deforestation rate in Southeast Asia and the seventh-fastest globally during this period ([2]). In the Philippines, slash-and-burn farming has converted primary or secondary forest to agricultural land ([19]), while indiscriminate illegal mining operations have also seriously damaged several forest areas ([14]). Similarly, charcoal production is a significant threat in the Philippines because fuelwood-dependent industries rely on illegally gathered charcoal from natural or plantation forests to produce goods for commercial and domestic use ([32]). A number of strategies are thus required to prevent illegal activity in protected areas, including strengthening law enforcement monitoring and patrolling, support for alternative industries in the local community, the reduction of forest communities living in close proximity to the forests, and the strict implementation of laws and regulations related to forest conservation ([29], [4]).
Various policies and programs have been introduced to reduce illegal activity in Philippine forests, but these have been undermined by inadequate law enforcement and institutionalization (e.g., law enforcement monitoring or ground patrolling - [10], [3]). Recently, the Philippine government has sought to protect the remaining forest cover through ground patrolling and law enforcement activity using the Spatial Monitoring and Reporting Tool (SMART). The Department of Environment and Natural Resources (DENR), in partnership with the United States Agency for International Development (USAID), has developed the SMART-Lawin Forest and Biodiversity Protection System (hereafter, SMART-Lawin system). Through ground patrolling, this system efficiently gathers information on forest conditions, threats to the environment (i.e., illegal activity), and indicator species of forest health using cutting-edge technology. The SMART-Lawin system can be employed to track illegal forest activity and locate their hotspots of illegal activity within protected areas, thus allowing timely, informed decisions to be made based on the rapid transmission of data. The primary purpose of this system is to establish appropriate strategies that maximize patrol effectiveness in deterring illegal forest activity.
Previous research on illegal forest activity has mainly focused on a single specific activity, for instance, illegal logging ([37]), the illegal hunting and gathering of wildlife resources ([24]), and charcoal production ([15]). These studies have been useful in that they provide relevant information on the extent and intensity of an illegal activity within the conservation area and how it has changed over time. However, most of these studies have not provided a comprehensive spatial analysis of a wide range of illegal forest activity, instead focusing only on the accurate assessment of the dynamics of a specific illegal activity ([4]).
Conservation area managers require information on the potential risk and spatial distribution of illegal forest activity within a protected area in order to devise optimal management strategies with limited resources. Several studies have attempted to predict the spatial distribution of illegal activity using Bayesian spatially explicit occupancy models ([4]) and maximum entropy (MaxEnt) models ([29], [6]). The MaxEnt approach has been employed in many studies to examine spatial patterns of the risk of illegal forest activity within various national parks ([29], [6]). These studies have found that the lack of manpower, logistic and financial resources, and extensive patrol coverage hinder the effective patrolling/monitoring of forest resources. The accurate assessment and modeling of the spatial distribution of the potential risk of illegal activity is thus necessary to strengthen forest protection and effectively and efficiently manage individual conservation areas.
In the Sierra Madre Mountain Range (SMMR), ranger patrol activity has generated large volumes of data in the SMART-Lawin system. However, few attempts have been made to utilize this crucial data to better allocate resources for efficient and strategic patrolling. The ranger patrol data generated using the SMART-Lawin system can be used to identify the risk and potential locations of illegal activity within a landscape and analyze the spatial relationship between this distribution and various environmental and infrastructure variables, such as the elevation, slope, wetness, land cover, and proximity to rivers, roads, and villages ([18], [29], [4], [5], [6]).
In this study, we used MaxEnt models to predict the spatial patterns of illegal forest activity and identify environmental and human drivers that are likely to influence this activity in the SMMR. An advantage of the MaxEnt approach is that it only requires presence data for an item of interest, while other approaches require both presence and absence data to identify spatial patterns. MaxEnt models substitute absence data with randomly generated background data, which is particularly useful for predicting the spatial distribution of a species due to the difficulties associated with obtaining absence data ([12], [34], [26], [39], [35]). We then used the results to recommend improvements in the patrol strategy for the region.
In summary, the main objectives of the present study were: (i) to develop MaxEnt models for illegal forest activity within the SMMR utilizing ranger patrol data collected via the SMART-Lawin system to understand the spatial patterns of this activity; (ii) to identify significant environmental variables that determine the distribution of illegal forest activity; and (iii) to assess the risk of illegal forest activity in this region and thus determine the patrol coverage that is required and improve the general patrol strategy for the conservation area.
Materials and methods
Study area
The SMMR is the longest mountain range in the Philippines and is surrounded by nine provinces: Isabela, Nueva Vizcaya, Cagayan, Quirino, Nueva Ecija, Aurora, Bulacan, Rizal, and Quezon ([38]). It is home to 240 bird species including the Philippine eagle (Pithecophaga jefferyi) and the endemic Isabela oriole (Oriolus isabellae - [22]). A considerable number of commercially significant but severely threatened tree species are also found in the conservation area, including members of the dipterocarp family such as Shorea spp. and Hopea spp. ([34]). This region is dominated by the Dumagat ethnic group (62%), and all of the residents in the area are dependent on natural resources for their livelihoods ([8]).
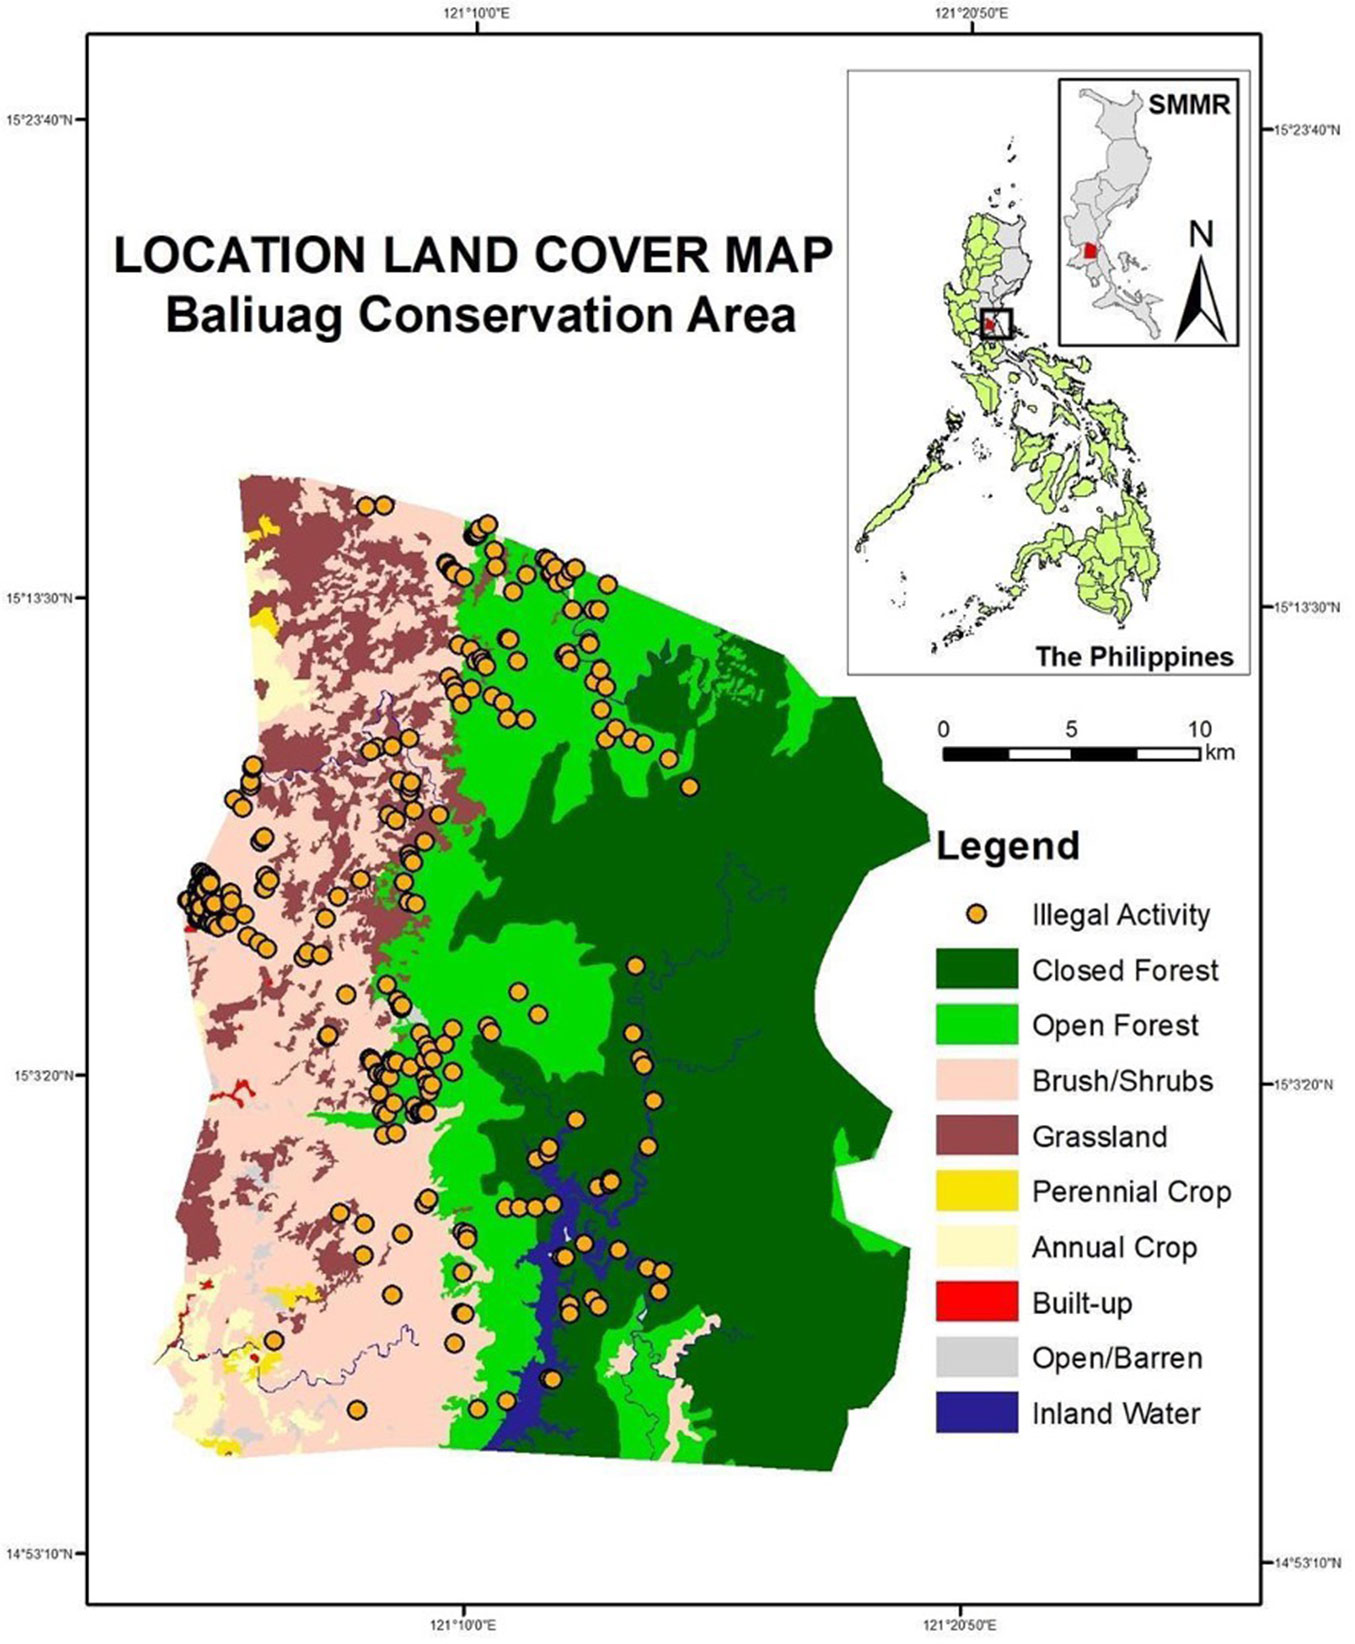
We selected the Baliuag Conservation Area (BCA) in Bulacan, which is in the southeastern region of the SMMR, as our study area (Fig. 1). The total coverage of the BCA is approximately 90.448 ha, which includes closed forest (34.849 ha), open forest (18.531 ha), and non-forest (37.069 ha) areas ([9]). The BCA comprises three protected areas, the Angat Watershed Forest Reserve, Biak-na-Bato National Park, and Doña Remedios Watershed, which are designated for protection and conservation ([7], [9]). The entire BCA is a vital source of fresh water for irrigation and industrial purposes (e.g., hydroelectric power generation) and serves as a critical ecological corridor within the SMMR.
Fig. 1 - Location of and land cover within the Baliuag Conservation Area.
Data collection
Currently, the BCA is managed by 23 forest rangers registered in the SMART-Lawin system, though only 18 members regularly join the patrols. These forest rangers are grouped into four teams, each in charge of patrolling one of the four patrol sectors over an average distance of 6 km. Each team conducts three patrols a month on average (8 h per patrol). With the aid of the SMART-Lawin system, the forest rangers recorded 3554 observations (approximately 1184 per year) within the BCA over the three years from 2017 to 2019.
We obtained data for the occurrence of illegal activity over the entire BCA from the SMART-Lawin system for the period of January 2017 to December 2019, which were collected by the forest rangers during their patrols. The spatial data were recorded in the SMART-Lawin database using Cyber-Tracker, an open-source mobile application ([36]).
We converted the occurrence data for illegal forest activity into spatial point data and then categorized these points into three categories: agricultural expansion, infrastructure expansion, and forest product extraction. We removed unwanted presence records that could influence the probability distribution of the models based on three criteria: (i) the point location was outside the study area; (ii) the records were duplicated (i.e., same date and coordinates); and (iii) thinning of the data was possible (i.e., only retaining one occurrence point per grid pixel). The final dataset consisted of 259 occurrence records, with 65, 147, and 47 occurrences of agricultural expansion, infrastructure expansion, and forest product extraction, respectively. These were used to model the distribution of the illegal activity categories.
Environmental predictors
Seven environmental variables at a 30 × 30 m resolution (elevation, slope, wetness, land cover, and distance from roads, rivers, and settlements - Tab. 1) were used as potential predictors of illegal forest activity ([29], [4], [5], [6]). All spatial data were processed for input into the Ecological Niche Model Evaluation (ENMeval) v. 0.3.0 package ([25]) in R v. 3.5.1 ([30]). The variance inflation factor (VIF) was used to test the multicollinearity of the predictors; any predictor with a VIF greater than 5 was removed from further analysis ([16]).
Tab. 1 - Summary of the environmental variables used in this study. (1): ASTER-Global Digital Elevation Model (GDEM) 30 m of NASA; (2): derived from the DEM; (3): ⇒ http://www.geofabrik.de/; (4): National Mapping Resources Information Authority / Forest Management Bureau.
| Variable | Variable Unit | Purpose | Source |
|---|---|---|---|
| Elevation | Meters above sea level | Accessibility: high elevations can be difficult to access and detect illegal activity | (1) |
| Slope | Slope of the terrain, percent | Accessibility: terrain with steep slopes can be difficult to access | (2) |
| Road | Distance in meters to the nearest road (Euclidean distance) | Accessibility: roads facilitate access to a conservation area, leading to an increase in detection risk | (3) |
| River | Distance in meters to the nearest river (Euclidean distance) | Accessibility: riverbanks or streambeds areas provide access for illegal activity and denser vegetation suitable for illegal settlements | (3) |
| Settlement | Distance in meters to the nearest settlement (Euclidean distance) |
Accessibility: most accessible areas if the (permanent/temporary) settlements are in close proximity to the conservation area |
(3) |
| Land cover | Generalized categories for Philippine land cover classification (i.e closed forest, open forest, etc.) | Availability of resources: areas of intact forest cover provide more available resources and suitable habitat for wildlife | (4) |
| Topographic wetness | Index of soil moisture | Availability of resources: high wetness and close proximity to water are associated with a high animal density | (2) |
Model tuning and processing
We optimized the models used to identify the spatial distribution of illegal forest activity using ENMeval. Though MaxEnt models are known to be a useful and robust approach to spatial prediction ([11], [28]), overfitting, complexity, and bias are common issues, and these can be effectively addressed in ENMeval ([31], [23]). We investigated the optimal parameter settings, particularly the regularization multiplier (RM) and feature classes (FCs), to overcome these issues. For MaxEnt modeling and validation, we used 80% of the presence data as training data and the remaining 20% for testing to determine the distribution of illegal activity and the accuracy of each model.
Initially, we identified the optimal combination of FCs and the RM for the three illegal forest activity categories using ENMeval, which generates a series of MaxEnt model candidates for particular parameter settings. There were six FCs (L, LQ, H, LQH, LQHP, and LQHPT), where L, Q, H, P, and T represent linear, quadratic, hinge, product, and threshold features, respectively, and we tested RM values of 0.5, 1, 1.5, 2, 2.5, 3, 3.5, and 4. The parameters used for the MaxEnt models are summarized in Tab. 2. The optimal models were selected using the corrected delta-Akaike information criterion (ΔAICc), with priority given to those with an ΔAICc < 2 as the best model for each illegal activity category. We then used the area under the receiver operating curve (AUCTEST) to select the most appropriate model from among the competitive alternatives ([6]).
Tab. 2 - List of significant MaxEnt parameters used to fine-tune the models for each illegal activity category. (*): FC and RM parameters are the output of the ENMeval tuning process.
| MaxEnt Parameter |
Selection | MaxEnt Default | Tuned Model Parameters |
|---|---|---|---|
| Feature class (FC) | Linear (L) Quadratic (Q) Product (P) Threshold (T) Hinge (H) Auto |
Auto: LQH | *Agricultural Expansion = LQHPT *Infrastructure Expansion = LQHP *Forest Product Extraction = LQ |
| Regularization multiplier (RM) | Number >=0.5 in steps of 0.5 | 1.0 | *Agricultural Expansion = 2.5 *Infrastructure expansion = 1 *Forest Product Extraction = 1.5 |
| Maximum number of background points | Number | 10.000 | 20.000 |
| Maximum iterations | Number | 500 | 1.000 |
| Output format | Loglog, Logistic, Cumulative, Raw | Cloglog | Raw and Logistic |
Applying the optimized FC and RM, we built MaxEnt models to predict the spatial distribution patterns of the illegal activity categories. Based on the results, we generated predictive maps and analyzed the influence of environmental covariates, obtained evaluation metrics, and evaluated the contribution of each predictor variable to the final model ([27]).
Model evaluation
We used k-fold cross-validation to evaluate the model by partitioning the occurrence data into training and testing sets. MaxEnt randomly partitions training and testing sets based on user-defined k values, which can inflate model performance metrics due to spatial autocorrelation ([31]). To avoid overfitting, we partitioned illegal activity occurrence and background points into four sets (coarse-grained and fine-grained) using the “checkerboard2” partitioning scheme ([6], [25]). The AUCTEST ([13]) and true skill statistic (TSS - [1]) were used to assess the performance of the final models for each illegal activity category.
The AUC is a strong independent threshold value that evaluates the ability of a model to discriminate presence from absence points (i.e., background points). The resulting average AUC for each model was compared and ranked. The TSS was used as an additional metric because it considers both omission and commission errors. A high AUC indicates that the model performs better than random chance, and a high TSS represents the degree of agreement between the samples generated by the MaxEnt model and the background prediction model. Therefore, models with both a high AUC and a high TSS would have greater reliability and robustness.
Spatial analysis
We analyzed the predictive model for the spatial distribution of each illegal activity by: (i) assessing the spatial extent of each illegal activity by its coverage; and (ii) estimating the overall risk of illegal activity across the landscape. First, we assessed the potential spatial extent of each illegal activity by reclassifying the MaxEnt output of each pixel into likely and unlikely areas for the illegal activity using the 10th percentile logistic threshold. Second, we assessed the overall risk of illegal activity across the landscape by summing the number of illegal activity occurrences exceeding the threshold for each pixel, as determined above; we represented the likelihood of any illegal activity taking place at a particular location with four risk levels from 0 (none risk) to 3 (high risk).
Results
Model selection and performance evaluation
We developed 144 MaxEnt models (48 for each illegal activity category) for various combinations of the RM and FC (Tab. S1 in Supplmentary material). We obtained optimal parameter sets for each illegal activity according to the model selection criteria (Tab. 3). We employed RM values of 2.5, 1, and 1.5, and the FC classes LQHPT, LQHP, and LQ for agricultural expansion, infrastructure expansion, and forest product extraction, respectively. The models for all categories of illegal activity with optimal parameter settings exhibited acceptable model performance ([6]). The agricultural and infrastructure expansion models exhibited good performance (mean AUCTEST = 0.88 and 0.80, and TSS = 0.613 and 0.442, respectively), while that of the product extraction model was relatively poor (mean AUCTEST = 0.69 and TSS = 0.26).
Tab. 3 - MaxEnt parameter settings used in the study and the evaluation metric results. (§): selected optimal model with ΔAICc < 2 for each illegal forest activity. (- -): values were not computed because it was not considered an optimal model; (Th*): the logistic threshold value for the 10th percentile minimum training presence.
| Illegal Activity Category | n | FC | RM | ΔAICc | Avg AUCTEST |
AUCTRAIN | TSS | Th* |
|---|---|---|---|---|---|---|---|---|
| Agricultural expansion | 65 | LQHPT | 2.5 | 0§ | 0.8880 | 0.9158 | 0.6130 | 0.083 |
| Infrastructure expansion | 147 | LQHP | 1 | 0§ | 0.8055 | 0.8594 | 0.4420 | 0.191 |
| Forest product extraction | 47 | LQH | 2.5 | 0 | 0.6790 | -- | -- | -- |
| LQH | 2 | 0.3589 | 0.6788 | -- | -- | -- | ||
| LQ | 1.5 | 0.5948§ | 0.6973 | 0.7259 | 0.2551 | 0.214 | ||
| LQ | 2 | 1.1455 | 0.6916 | -- | -- | -- | ||
| LQ | 2.5 | 1.8373 | 0.6849 | -- | -- | -- |
Analysis of environmental predictors
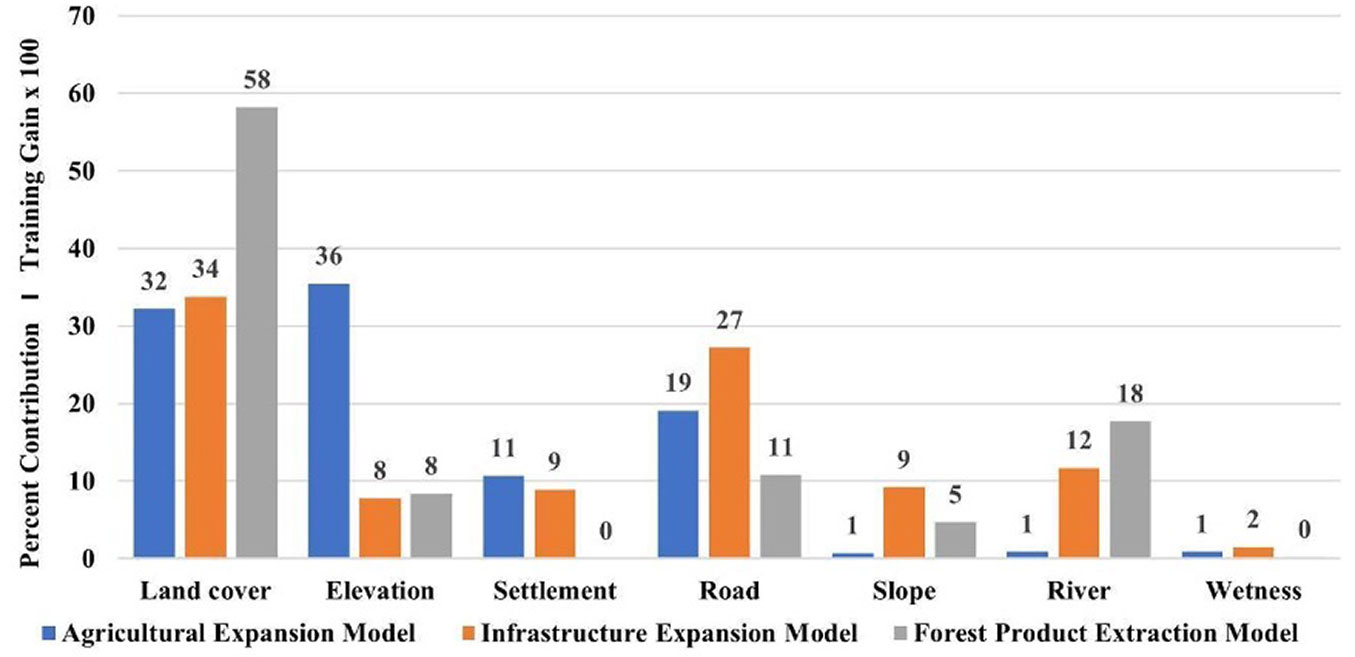
The environmental predictors differed in their impact on each illegal forest activity model, with land cover and proximity to roads and rivers having the strongest influence (Fig. 2). Agricultural expansion was strongly affected by elevation (36%), followed by land cover (32%) and roads (19%). Infrastructure expansion was primarily affected by land cover (34%), roads (27%), and rivers (12%). Similarly, product extraction was substantially influenced by land cover (58%), rivers (18%), and roads (11%).
Fig. 2 - Importance of each predictor variable to the illegal forest activity models.
Potential distribution of illegal forest activity
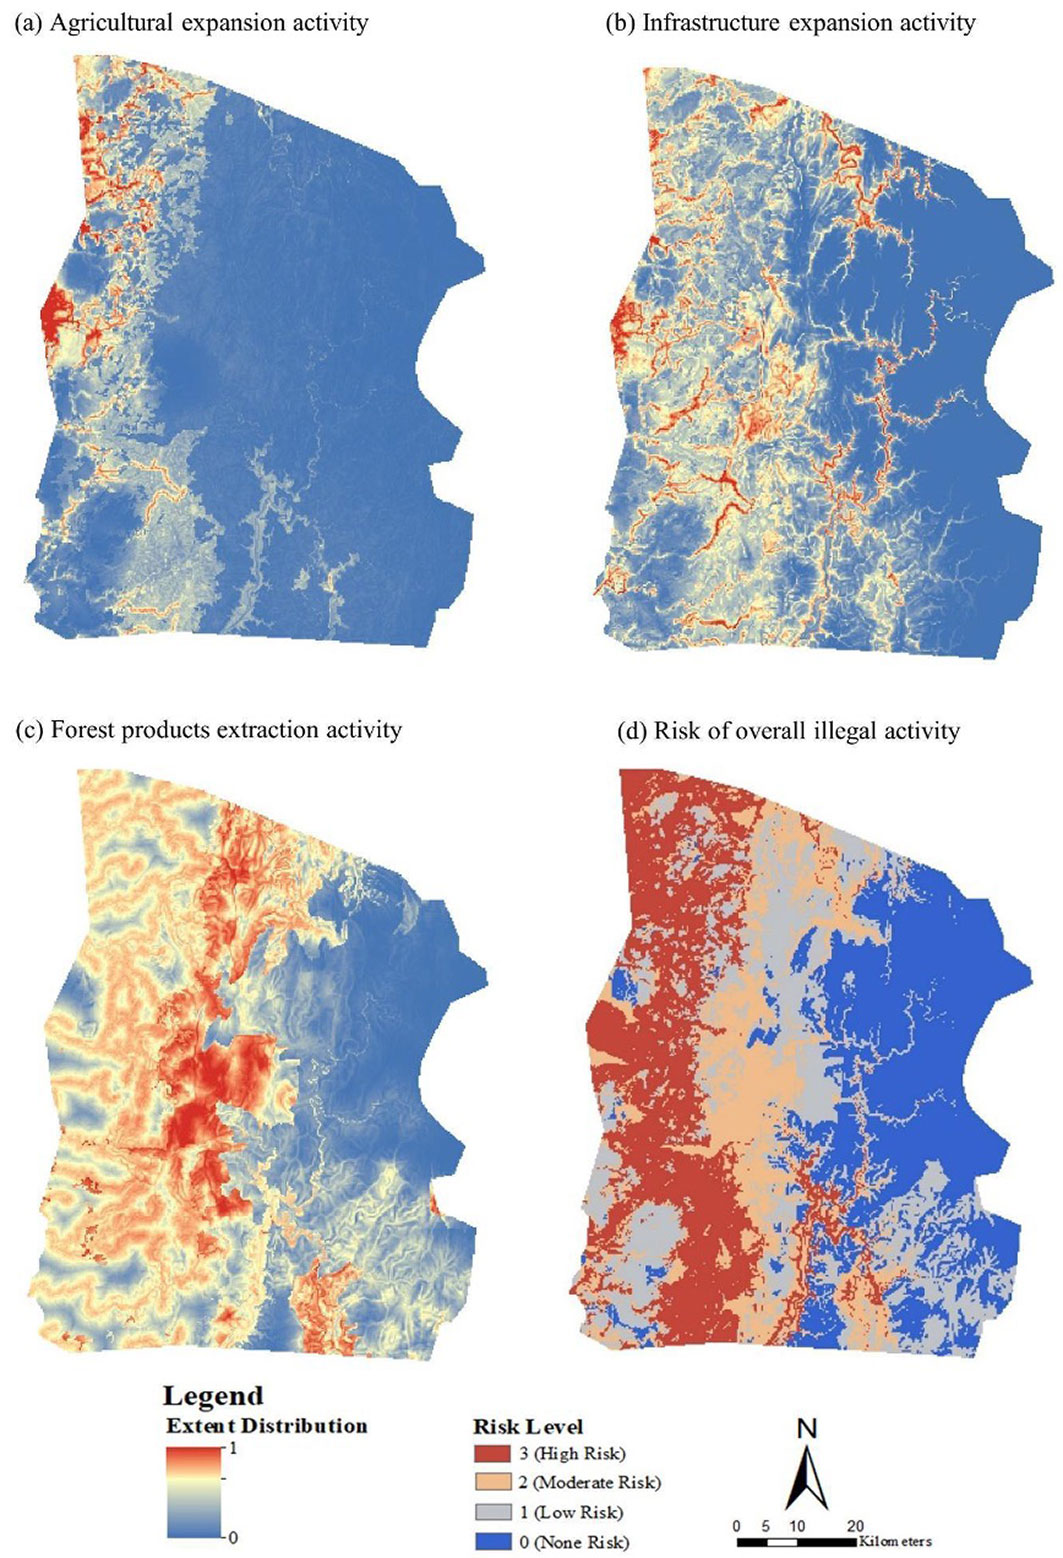
The predicted spatial distribution for each illegal activity category varied across the landscape (Fig. 3). The threshold values for the presence and absence of agricultural expansion, infrastructure expansion, and forest product extraction were 0.083, 0.191, and 0.214, respectively. Forest product extraction was the most common illegal activity across the landscape (66%), followed by infrastructure expansion (44%) and agricultural expansion (30% - Tab. 4). Of the land cover types, brush/shrub was most likely to be damaged by illegal activity (59.007 ha), followed by open forest (28.073 ha) and grasslands (16.405 ha - Tab. 5). The predicted model revealed that product extraction was most detrimental to open and closed forest (25.463 ha), followed by infrastructure expansion (13.901 ha) and agricultural expansion (173 ha).
Fig. 3 - Spatial coverage of the potential distribution of each illegal forest activity category (a-c) and the level of risk predicted across the study area (d).
Tab. 4 - Coverage of each illegal activity category predicted across the conservation area.
| Illegal Activity Category | Area (ha) | Coverage (%) |
|---|---|---|
| Forest product extraction | 59.913 | 66 |
| Infrastructure expansion | 39.721 | 44 |
| Agricultural expansion | 27.256 | 30 |
Tab. 5 - Coverage of illegal activity categories predicted for each land cover type within the conservation area. (1): Annual crop; (2): Brush/shrubs; (3): Built-up; (4): Closed forest; (5): Grassland; (6): Inland water; (7): Open forest; (8): Open barren; (9): Perennial crop.
| Illegal Activity Class | Land Classification | Coverage (ha) |
||||||||
|---|---|---|---|---|---|---|---|---|---|---|
| 1 | 2 | 3 | 4 | 5 | 6 | 7 | 8 | 9 | ||
| Agricultural expansion | 976 | 19.999 | 99 | 35 | 3.734 | 2.062 | 138 | 79 | 34 | 27.256 |
| Infrastructure expansion | 1.166 | 18.247 | 03 | 3.405 | 3.978 | 2.005 | 10.496 | 159 | 63 | 39.722 |
| Forest product extraction | 1.790 | 20.761 | 15 | 8.024 | 8.693 | 2.214 | 17.439 | 471 | 07 | 59.914 |
| Total (ha) | 3.932 | 59.007 | 317 | 11.464 | 16.405 | 6.281 | 28.073 | 709 | 704 | 126.892 |
The overall risk assessment, which represents the total frequency of all illegal activity occurrences, revealed that 25% of the conservation area was at high risk, 20% at moderate risk, 25% at low risk, and 30% at no risk (Fig. 3d).
Discussion
This study demonstrated a method for predicting the spatial patterns of illegal activity in Philippine forests utilizing MaxEnt models. We classified illegal activity into three categories: agricultural expansion, infrastructure expansion, and forest product extraction. Predictions of the distribution of these illegal activity categories were carried out using MaxEnt models based on seven environmental predictors (i.e., elevation, slope, roads, rivers, settlements, land cover, and topographic wetness) and 259 occurrences of illegal activity obtained from the SMART-Lawin patrolling system. The optimal MaxEnt models for agricultural expansion and infrastructure expansion produced a high prediction performance, with an average AUCTEST of over 0.80, higher than the model for forest product extraction (AUCTEST = 0.697). We found that the distribution and potential occurrence of illegal activity were also influenced by the sample size and their spatial extent of distribution. A higher sample size tends to increase model performance, as represented by the AUC, but the predicted coverage of each illegal activity had the opposite effect on the AUC. Because product extraction had fewer observed occurrences and its predicted coverage area was almost twice as large as the two other illegal activities, its model had a lower AUC. Further monitoring of illegal activity in forested areas using the SMART-Lawin system could help to improve the accuracy of the model.
According to our results, each illegal activity was affected by different environmental variables. Agricultural and infrastructure expansion demonstrated similar patterns in terms of the main environmental variables affecting the models. They were evenly affected by land cover and roads and slightly affected by the proximity of settlement areas, indicating the gradual expansion of both types of illegal activity. On the other hand, forest product extraction was mainly affected by land cover and the proximity of roads and rivers, which can be used to transport forest products.
Although Denninger Snyder et al. ([6]) reported a very low relationship between land cover and forest product extraction, our results revealed that land cover had a very large influence on the product extraction model. This contrast in the results could be due to a difference in the land cover types in the respective study areas. Denninger Snyder et al. ([6]) conducted their study in the African savanna, where grassland is the dominant land cover type. On the other hand, our study was carried out in a region mainly covered by forests. Because trees are evenly and sparsely distributed in savanna regions, the land cover is not greatly impacted by tree logging; instead, proximity to villages and management strategies have a greater effect on illegal activity. However, in the tropical forests in our study area, protected areas usually conserve forests. Therefore, illegal activity tends to occur at locations where it is difficult to detect but where it is easy to transport the products quickly. Therefore, forest product extraction tends to be affected by the land cover and proximity to roads and rivers.
Applicability of the model
Although the MaxEnt model is generally used to estimate the spatial distribution of a species, it has been utilized in many studies to estimate the spatial patterns of non-biological items, such as illegal forest activity, because non-biological items are also determined by environmental factors ([21], [6]). Therefore, this method is widely used for developing predictive models to understand the potential distribution of illegal forest activity to assist in the efforts to manage protected areas ([6]). However, it is difficult to minimize the effects of spatial autocorrelation, particularly when the occurrences of illegal activity are clustered. Therefore, this approach may work well in large conservation areas, especially when patrol efforts are systematically distributed over the entire region. In our study, identifying areas that lack patrol coverage and variables that are poorly represented and including these in future patrols will be critical to improving the modeling approach.
The modeling approach presented here also needs to include other relevant predictor variables such as (i) human and livestock density, (ii) employment and income levels, which have been linked to illegal resource use ([4]), and (iii) distance to ranger camps and patrol posts ([6]). However, any rapid changes, such as the shift in the location of illegal activity hotspots occurring in response to patrolling, land-use changes, or other socio-economic reasons, may be difficult to include in the model, especially if the patrols are ground-based. A combination of low-cost and easily deployed unmanned aerial vehicles (UAVs) and high-resolution, freely available remote sensing images with SMART-Lawin data would thus be beneficial.
Optimal strategy for mitigating illegal activity
The results of this study can be used to deploy patrol teams that prioritize high-risk areas. Managers can either target the deterrence of a specific illegal activity or a combination of multiple illegal activities. However, our results are limited by the range of variables used in developing the model. According to Critchlow et al. ([4]), the selection of variables plays a decisive role in the resulting distribution of predicted illegal activity. Therefore, identifying the right predictors is critical when seeking to produce accurate and reliable models. In this study, we limited our focus to seven important variables that are likely to affect the occurrence of illegal activity. We found that land cover was a crucial environmental factor that affected the spatial distribution of all three illegal activity categories. Elevation and proximity to roads and rivers were also very important to the accuracy of the model predictions. However, conservation managers are increasingly recognizing the dynamic nature of illegal activity, especially in response to patrolling or law enforcement, which is extremely difficult to include in the MaxEnt framework. On the other hand, there have been calls to focus patrolling efforts on areas with greater conservation value ([29]), so that such illegal activity would eventually shift to areas with less conservation value.
Improving the patrol strategy
Our study area in the BCA is 90.448 ha in size, which is covered by four patrol teams. This means that each team is responsible for patrolling over 20.000 ha. Given the limited human and logistic resources, it is almost impossible to cover the entire area in a systematic manner. Unfortunately, this lack of conservation resources is not uncommon for most protected areas in the tropics. The large patrol coverage area and the limited budget and human resources, hinder the effective implementation of law enforcement strategies ([29], [6]).
Under these circumstances, we believe our results can be used to improve patrolling by shifting focus to three specific goals. The first should be to focus efforts on a specific illegal forest activity. In this case, the output map for the extent of the illegal activity can be used to identify the target areas for a particular illegal activity. The second goal should be detecting as many types of illegal activity as possible at once. In this case, the moderate- to high-risk areas identified in the risk assessment map can provide the best information. The third goal should be to focus on conserving and protecting the most valuable areas, such as protected areas and vulnerable areas covered with intact forest (closed/open forest). In this case, overlaying the risk map for each illegal activity with land cover or forest maps will be useful.
Conclusion
It is important for conservation area managers to identify the drivers determining the occurrence of illegal activity and the locations where it is most likely to occur within their areas of jurisdiction in order to effectively implement forest protection and law enforcement. Because there are vast areas of forest with high biodiversity in the Philippines, the optimal spatial allocation of limited patrolling resources must be carried out to effectively prevent illegal activity. The present research demonstrates the use of a data-driven response to facilitate a better understanding of an entire conservation area and to provide accurate data that can be used to make informed conservation management decisions. Applying MaxEnt models that were based on illegal activity occurrence data collected from the field using the SMART-Lawin patrolling system, we successfully identified the critical environmental drivers determining illegal activity within the study site. However, this does not mean that the seven environmental variables that we investigated are best suited for all categories of illegal activity. Future research should include significant environmental predictors that were not used in this study but that are likely to affect the occurrence of illegal activity. An improved version of the approach showcased in this study could be implemented in other priority conservation areas with wider coverage using a large sample size of illegal forest activity generated over a longer time period, allowing for more effective patrol strategies. However, it is important to note that the behavior of poachers or violators is likely to change in response to changes in patrol strategies ([18], [5]). Our study has also made it possible to predict locations with a high potential for illegal activity, which is helpful for improving the patrol strategy within protected areas.
List of Abbreviations
The following abbeviations have been used along the paper:
- AICc: Corrected Akaike Information Criterion;
- ΔAICc: Corrected Delta Akaike Information Criterion;
- ASCII: American Standard Code II;
- ASTER: Advanced Spaceborne Thermal Emission and Reflection Radiometer;
- AUC: Area Under the Curve;
- AUCTEST: Area Under the Curve for the Test Dataset;
- BCA: Baliuag Conservation Area;
- DEM: Digital Elevation Model;
- ENMeval: Ecological Niche Model Evaluation;
- FC: Feature Classes;
- FCA: Forest Conservation Area;
- FMB: Forest Management Bureau;
- MaxEnt: Maximum Entropy;
- RM: Regularization Multiplier;
- SMART: Spatial Monitoring and Reporting Tool:
- SMART-Lawin: Lawin Forest and Biodiversity Protection System;
- SMMR: Sierra Madre Mountain Range;
- TSS: True Skill Statistics;
- VIF: Variance Inflation Factor.
Acknowledgements
This research was supported by the National Research Foundation of Korea (NRF) grant funded by the Korea government (MSIT, no. NRF-2017R1A2B4010460), and R&D Program for Forest Science Technology (Project No. 2019150B10-21230301) funded by Korea Forest Service (Korea Forestry Promotion Institute).
References
Gscholar
Gscholar
Gscholar
Gscholar
CrossRef | Gscholar
Gscholar
Online | Gscholar
Gscholar
Gscholar
Gscholar
Gscholar
CrossRef | Gscholar
Gscholar
Online | Gscholar
Online | Gscholar
Online | Gscholar
Gscholar
Supplementary Material
Authors’ Info
Authors’ Affiliation
Department of Environment and Natural Resources - DENR (Philippines)
Kwanghun Choi 0000-0003-0030-8876
Dongwook W Ko
Department of Forest Environment and Systems, Kookmin University (South Korea)
Corresponding author
Paper Info
Citation
Barit JB, Choi K, Ko DW (2022). Modeling the risk of illegal forest activity and its distribution in the southeastern region of the Sierra Madre Mountain Range, Philippines. iForest 15: 63-70. - doi: 10.3832/ifor3937-014
Academic Editor
Maurizio Marchi
Paper history
Received: Jul 28, 2021
Accepted: Dec 16, 2021
First online: Feb 21, 2022
Publication Date: Feb 28, 2022
Publication Time: 2.23 months
Copyright Information
© SISEF - The Italian Society of Silviculture and Forest Ecology 2022
Open Access
This article is distributed under the terms of the Creative Commons Attribution-Non Commercial 4.0 International (https://creativecommons.org/licenses/by-nc/4.0/), which permits unrestricted use, distribution, and reproduction in any medium, provided you give appropriate credit to the original author(s) and the source, provide a link to the Creative Commons license, and indicate if changes were made.

Web Metrics
Breakdown by View Type
Article Usage
Total Article Views: 59408
(from publication date up to now)
Breakdown by View Type
HTML Page Views: 48222
Abstract Page Views: 6424
PDF Downloads: 4183
Citation/Reference Downloads: 8
XML Downloads: 571
Web Metrics
Days since publication: 1583
Overall contacts: 59408
Avg. contacts per week: 262.70
Article Citations
Article citations are based on data periodically collected from the Clarivate Web of Science web site
(last update: Mar 2025)
Total number of cites (since 2022): 2
Average cites per year: 0.50
Publication Metrics
by Dimensions ©
Articles citing this article
List of the papers citing this article based on CrossRef Cited-by.
Related Contents
iForest Similar Articles
Review Papers
Remote sensing-supported vegetation parameters for regional climate models: a brief review
vol. 3, pp. 98-101 (online: 15 July 2010)
Review Papers
Accuracy of determining specific parameters of the urban forest using remote sensing
vol. 12, pp. 498-510 (online: 02 December 2019)
Research Articles
Geostatistical techniques for estimating aboveground biomass in eastern Amazonia
vol. 19, pp. 85-93 (online: 13 March 2026)
Review Papers
Remote sensing of selective logging in tropical forests: current state and future directions
vol. 13, pp. 286-300 (online: 10 July 2020)
Technical Reports
Detecting tree water deficit by very low altitude remote sensing
vol. 10, pp. 215-219 (online: 11 February 2017)
Research Articles
Assessing water quality by remote sensing in small lakes: the case study of Monticchio lakes in southern Italy
vol. 2, pp. 154-161 (online: 30 July 2009)
Research Articles
Identification and characterization of gaps and roads in the Amazon rainforest with LiDAR data
vol. 17, pp. 229-235 (online: 03 August 2024)
Research Articles
Afforestation monitoring through automatic analysis of 36-years Landsat Best Available Composites
vol. 15, pp. 220-228 (online: 12 July 2022)
Review Papers
Remote sensing support for post fire forest management
vol. 1, pp. 6-12 (online: 28 February 2008)
Research Articles
Classification of xeric scrub forest species using machine learning and optical and LiDAR drone data capture
vol. 18, pp. 357-365 (online: 07 December 2025)
iForest Database Search
Search By Author
Search By Keyword
Google Scholar Search
Citing Articles
Search By Author
Search By Keywords
PubMed Search
Search By Author
Search By Keyword


