Complex networks, an innovative methodology for functional zoning in forest management
iForest - Biogeosciences and Forestry, Volume 15, Issue 4, Pages 299-306 (2022)
doi: https://doi.org/10.3832/ifor3927-015
Published: Aug 22, 2022 - Copyright © 2022 SISEF
Research Articles
Abstract
Forest management planning requires a permanent collection of data on the distribution, composition, and structure of the stands that conform a woodland. These data serve as the basis for suggesting the most appropriate management scheme according to the natural resource conditions and management objectives. It is common for the collected databases’ structure and dimension to hinder their analysis using traditional descriptive techniques. Therefore, alternative methodologies are required to facilitate both the exploration of data properties and their collective behavior. We used complex networks analysis to identify distribution patterns of topographic, biological, and productive conditions of a managed forest, suggesting its functional zoning. The forest was considered a graph consisting of nodes and edges; the stands served as nodes and interactions between them as edges. Degree, clustering coefficient, triangles, and modularity were used as segregation and connectivity metrics to evaluate forest properties and allocate stands to five predefined potential forest uses (zones). The clustering coefficient metric provided the better graph partition, allowing to obtain the best alternatives for zoning the forest in conservation areas, areas with potential for timber production, and carbon storage. Proposing forest functional zoning through complex network theory is a powerful methodological option to represent the spatial and nonspatial interactions among the relevant attributes defining a forest ecosystem condition.
Keywords
Forest Planning, Spatial Interactions, Segregation And Connectivity Metrics, Graph Theory
Introduction
Current forest management process is a complex task that requires frequent updating on the distribution, composition, structure, and modification of the forest due to the various silvicultural practices applied, particularly harvesting ([41]).
Despite the technological advancement in computer systems ([39]) and equipment for evaluating and monitoring forest resources ([26]), there is still the need to incorporate new approaches that efficiently generate supporting information for the planning of forest management programs. New methods should facilitate and strengthen decision-making processes associated with the sustainable use of forest resources.
Data that describe forest resources are constantly changing and show multidimensional spatial characteristics that make difficult their analysis using traditional descriptive techniques. Several methods have been used to characterize and group the multiple attributes that define a forest, commonly using geographic clustering techniques ([23], [41]). Most of these methods have been enhanced to cater to big data sets and relate forest variables to geographical patterns. Some popular are the Iterative Self Organizing Data Analysis (ISODATA), the Density-Based Spatial Clustering of Applications with Noise (DBSCAN), the Spatial “K”luster Analysis by Tree Edge Removal (SKATER), or the regionalization with dynamically constrained agglomerative clustering and partitioning (REDCAP - [18], [22]).
However, techniques using algorithms such as the REDCAP or SKATEX directly incorporates a spatial contiguity constraint into a traditional hierarchical clustering which could be helpful if the intention is to create homogeneous areas or when there is no need to have prior knowledge of the number of regions ([3], [21]). Instead, suppose the purpose is to characterize the multiple interactions of spatial and non-spatial forest variables per management unit, dividing the entire dataset into separate groups of stands but not creating homogeneous areas. In that case, it is more suitable to use a non-hierarchical method that could complement the forest analysis attributes ([17], [31]).
The Network theory is a novel approach that can tackle the above cases. It facilitates the representation of interactions between the elements that conform the forest system. This theory emphasizes the visualization of systems present in nature as complex networks, which allows extracting knowledge of both the individual characteristics that compose the system (nodes) and its collective properties through the presence of links or connections between nodes ([9], [37]).
Considering the forest as a complex system allows to explain the reaction of different system components to various stimuli, such as forest harvest, and identify areas with different potentials for use (functional zones) to diversify the forest management scheme. Functional zoning is a process by which management units (stands) are classified into homogeneous strata according to their environmental characteristics and productive potential. Each zone (stratum) is defined by the quality and quantity of goods and services potentially obtained in each of them ([22]).
This study proposes an alternative methodology for functional forest zoning under the complex networks approach. The forest was considered a graph, where the stands were the nodes and the connectivity between stands the graph links. Connectivity and segregation metrics were used to analyze the graph properties and to identify areas with similar topographical, biological, and productive conditions. Resulting functional zones with different productive potential were proposed to diversify the forest management scheme.
Material and methods
Relevant complex networks theory
Mathematically, a complex network is made up of nodes N = {n1, …, nN} linked by a set of links L = {a11, …, aij} where aij = {ni, nj} denotes the link that joins two nodes of the network. The nodes can represent any kind of objects or individuals described by variables, and the links the interactions between them ([7]).
The data collection of as many variables as are available about the objects and interactions that make up the network, are helpful to describe it through a mathematical summary commonly known as an adjacency matrix (A). This matrix will represent the structural connectivity and the collective behavior patterns of the nodes in the network. The number of rows and columns of the A matrix will correspond to the number of nodes in the network, and the values inside the matrix (aji) will indicate the existence/type of the link between nodes ([34], [20]).
The existence of a link between two nodes (ni and nj) can be determined by assessing their similarity or “distance” in one or several given variables (characteristics). A popular method to compute such similarity is the Mahalanobis distance (Mdij), which has been commonly used to perform classification in multi-dimensional data ([13], [5]). Mdij is defined as follows (eqn. 1):
where Zij = (Xij - mi)/si is the standardized observation of the i-th variable; C-1 is the inverse of the correlation matrix; Xij, si, and mi are the observations, the standard deviation and the mean of the i-th variable, respectively; and k is the number of variables.
Mdij is calculated between each pair of nodes and the average of this measure for the data set (complex network) is obtained. Then, to build the adjacency matrix (A), a link will be set between two nodes if their computed distance is less than the average value of Mdij ([28]). The main advantage of using the Mahalanobis distance, unlike the Euclidean distance, is that all the variables used to compare the nodes are considered equally important as it takes into account the average value, the ranges of acceptability (variance) between variables, and compensates for interactions (covariance) between them ([35]).
Depending on the links’ nature, the adjacency matrix (A) can be directed or undirected, and it also can be binary or weighted. In an undirected matrix, the order of the indexes on the links does not alter the network’s configuration; a link between node ni and node nj can be expressed indistinctively as aij or aji. In a directed matrix, the order of the indices is relevant, the expression of the link between node ni and node nj can be aij but not aji. A weighted matrix occurs when their links have a numerical value indicating the union’s intensity (number of links or a cost value). In contrast, a binary matrix occurs if only the presence or absence of a link is considered ([39], [20]).
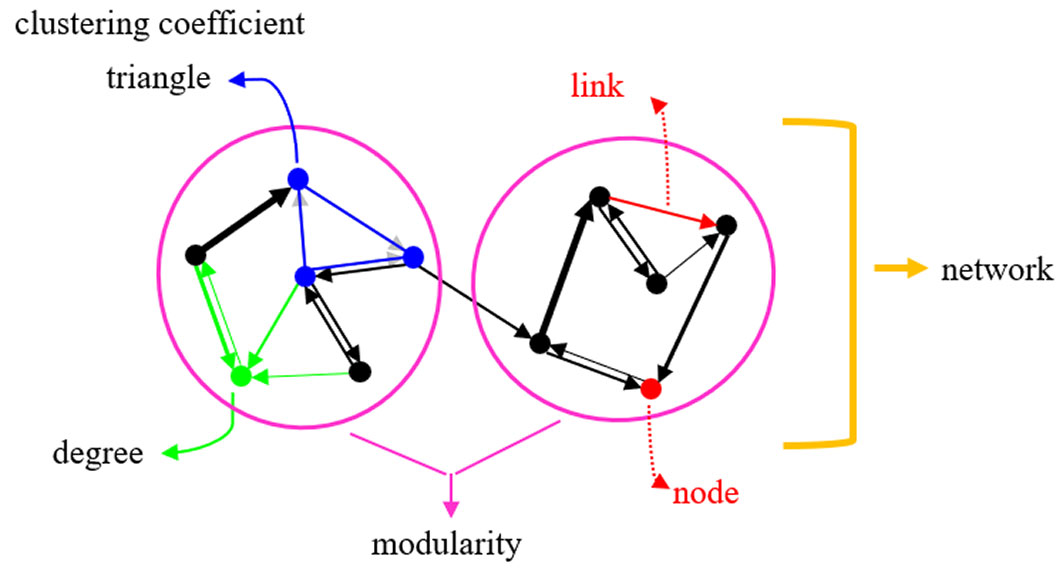
Various metrics can describe quantitatively the structure and connectivity of the network using the calculated adjacency matrix. These metrics can refer to the network elements (nodes or links) or the distribution of all of them (Fig. 1). Typically, individual element metrics reflect how a node is embedded in the network, while distribution metrics provide a more global network description ([34], [16]). The most common metrics for evaluating segregation and connectivity are degree, clustering coefficient, triangles, and modularity.
The degree (Ki) of a node is the number of connections (aij) linked to the rest of the network. The degree is the most fundamental network metric, and most other metrics are related to it ([15]). Ki is calculated as (eqn. 2):
The clustering coefficient (Ci) calculates the clustering trend of the nodes. If a node is connected to its neighboring nodes and all of them are connected, then Ci will have a maximum value of one. If its neighbors barely interact with each other, the value will be close to zero and, if there is no interaction, the value will be zero ([34]). This coefficient is given by the following (eqn. 3):
Ti is the triangles metric and represents the number of triangles that pass-through node ni. In other words, the links of the nodes ni and nj from the neighborhood of ni. Ti is the sum of the cycles of length three, between a source node and its neighbors, for all the network nodes. The “triangle” can also be understood as a clique of size three. A clique is a graph (set of nodes) in which every pair of different nodes are adjacent, and there is an edge (link) that connects them ([16]). The triangles metric is calculated as (eqn. 4):
where te and tp are the number of existing and possible triangles, respectively. Finally, modularity (Qi) evaluates a community structure in the network, that is, subnets densely connected between them ([39]). A high modularity value exists if the network has subnets densely connected internally but little connected externally. On the other hand, a low modularity value will be obtained if the network does not have dense subnets, but these are very well connected. Modularity calculates the minimum number of links that need to be removed to disconnect the network (eqn. 5):
where Pij =kikj/2L and Bij = δ(ci, cj). L is the number of links in the network, Aij is the adjacency matrix, Pij is the probability that a link between two nodes is proportional to their degrees, and Bij is a binary measure that defines whether the nodes are from the same community. A community is a high concentration of links in some areas of the network ([8]).
Data collection and processing
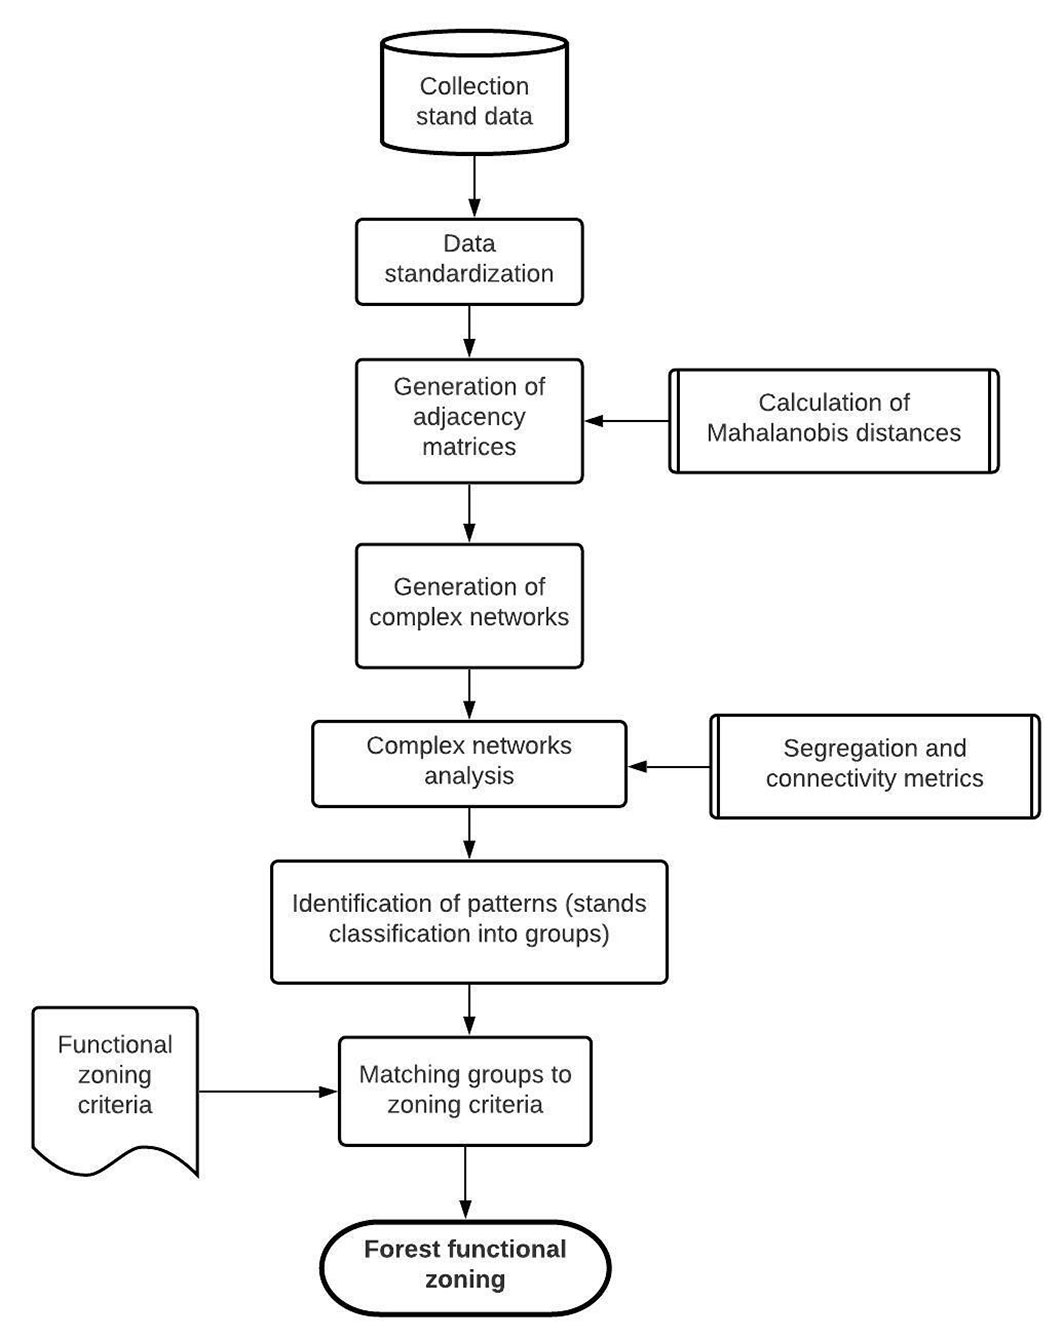
The proposed methodology for defining a functional zoning scheme through a complex networks analysis (Fig. 2), at its first step, needs defining the system for analysis and its networks. Here we defined the forest as the system for complex network analysis, the stands as the nodes, and the existing connectivity (similarity) between stands as the links of the network.
Fig. 2 - Flow chart of the proposed methodology to forest functional zoning through complex networks analysis.
The forest owned by the community of San Pedro El Alto, Oaxaca, Mexico was used as study case. This community owns 29.250.58 ha of temperate forest, which it manages sustainably through its Community Forestry Company. The forest consists of 1827 minimum management units (stands), and the current Forest Management Plan (2016-2017 / 2025-2026) includes topographic, biological, and production data per stand.
The descriptive variables available for the stands allowed us to build five complex networks. Four networks (R1-R4) included variables that describe the stand by its geophysical, dasometric, habitat diversity, or productivity attributes (Tab. 1). The fifth network (R5) included all the information available per stand. Each one of the networks were made up of 1827 nodes (stands), and the existing links between them expressed their similarity.
Tab. 1 - Data per stand included in each complex network (R1-R5) proposed.
| Network | Stand data (descriptor variables) |
|---|---|
| R1 | Area (ha), perimeter (m), current land use, slope (%), and potential productive category. |
| R2 | Average total volume (m3ha-1), mean diameter at breast height (cm), average site index (SI), age (year), average basal area (m2ha-1), average number of trees per hectare, average estimated mean annual increment (m3ha-1year-1), and habitat category (defined by tree genera dominance ). |
| R3 | Average volume per tree genera (m3ha-1). |
| R4 | Proportion per tree genera of the average total timber volume (0 - 1 values). |
| R5 | The conjunction of the data considered in the R1-R4 networks. |
After all data were standardized by computing the Mahalanobis distances between nodes, binary adjacency matrices were generated for networks R1-R4, setting the value of one if a connection (link) between a pair of stands existed, and zero otherwise. Differently, for the R5 network, the aij positions took integer values from 0 to 4. These values resulted from the union of the matrices of the R1-R4 networks. The maximum possible value of the link is four (an existing link in all the R1-R4 networks), and the minimum possible value is zero if there are isolated stands (without connections in all the networks R1-R4). Due to isolated stands identified in some matrices, the matrices’ size in networks R2, R3, and R4 were 1824, 1824, and 1715 nodes. These procedures were coded in MATLAB® software version R2020b ([36]).
Once the five adjacency matrices were obtained, the next step was to calculate the connectivity and segregation metrics on an a-per-stand basis, as described in the previous section. The degree (Ki) metric was used to evaluate the connectivity in networks’ structure, while the triangles (Ti), clustering coefficient (Ci), and modularity (Qi) were used to classify the stands into five classes (functional zones) previously defined by a panel of experts (Tab. 2). Fig. 2synthesizes the flow of tasks performed to implement the described procedure. The triangles and clustering coefficient were calculated with the Latapy method ([19]), while modularity was calculated with the Louvain method ([6]). The open-source software Gephi version 0.9.2 (201709241107) was used for this purpose.
Tab. 2 - Desirables stand attributes for the forest functional zones proposed. (BC): biodiversity conservation forest; (CS): carbon storage forest; (LpFE): low productivity forest suitable for extensive management; (HpFE): high productivity forest suitable for extensive management; (HpFI): high productivity forest suitable for intensive management.
| Zones | Desirable criteria |
|---|---|
| BC | Stands with superior tree diversity (most trees genera present) and distributed in slopes steeper than 42%) or difficult to access. |
| CS | Stands with a medium to high site index (SI), with slopes less than 42%, sites with dominance of Pinus, Abies, and Quercus genera and preferentially distributed on the periphery of the property. |
| LpFE | Stands with a low site index (IS), with slopes of 29-42%, and sites with dominance of Pinus genera. |
| HpFE | Stands with a medium to high site index (SI), with slopes of 15-28%, and sites with dominance of Pinus genera. |
| HpFI | Stands with a high site index (SI), with slopes of 0-14%, and sites with dominance of Pinus genera. |
To minimize the variation in each class, we used the Natural Breaks (Jenks) algorithm incorporated in the ArcGIS® software version 10.3.1 ([12]), which has proven good performance in zoning processes ([22]). With this algorithm, similar values are better grouped, and differences between classes are maximized.
Each functional zone represents a combination of desirables criteria (productivity, slope, and habitat) suitable for a particular production scheme. For example, low-intensity harvesting (extensive management) is suggested in low-productivity stands with steep slopes to avoid harvesting over forest growth capacity and reduce soil erosion. Thereby, to determine the classes belonging to a specific functional zone, the representative characteristics of the class (stand attributes) were matched with the desirable criteria of functional zones.
Because of the number of nodes and links existing in the complex networks (R1-R5), their visualization by drawing the network partition was useless as it looked like a fuzzy graph. For that reason, we choose the alternative of mapping the segregation metrics values per stand using ArcGIS® software for each complex network.
Results
The results were analyzed in terms of the structure of the complex networks (degree values) and the performance of the segregation metrics triangles (Ti), clustering coefficient (Ci), and modularity (Qi) to classify the stands in the five functional zones proposed. A summary of the descriptive statistics per metric evaluated in each complex network is available in the Tab. S1 (Supplementary material).
Structural analysis of the complex networks
All the evaluated networks were of the non-directed type. That is, the origin-destination order of the link present between two stands (nodes) is indifferent. However, the R1-R4 networks differ from the R5 by their weight. Networks R1-R4 have terms aij of binary type (zero if there is no link, one otherwise) in their adjacency matrices, so they are considered simple non-weighted networks. On the contrary, the R5 network has terms aij with values greater than or equal to zero, which indicate the magnitude of the connectivity, that is why it is considered a weighted network.
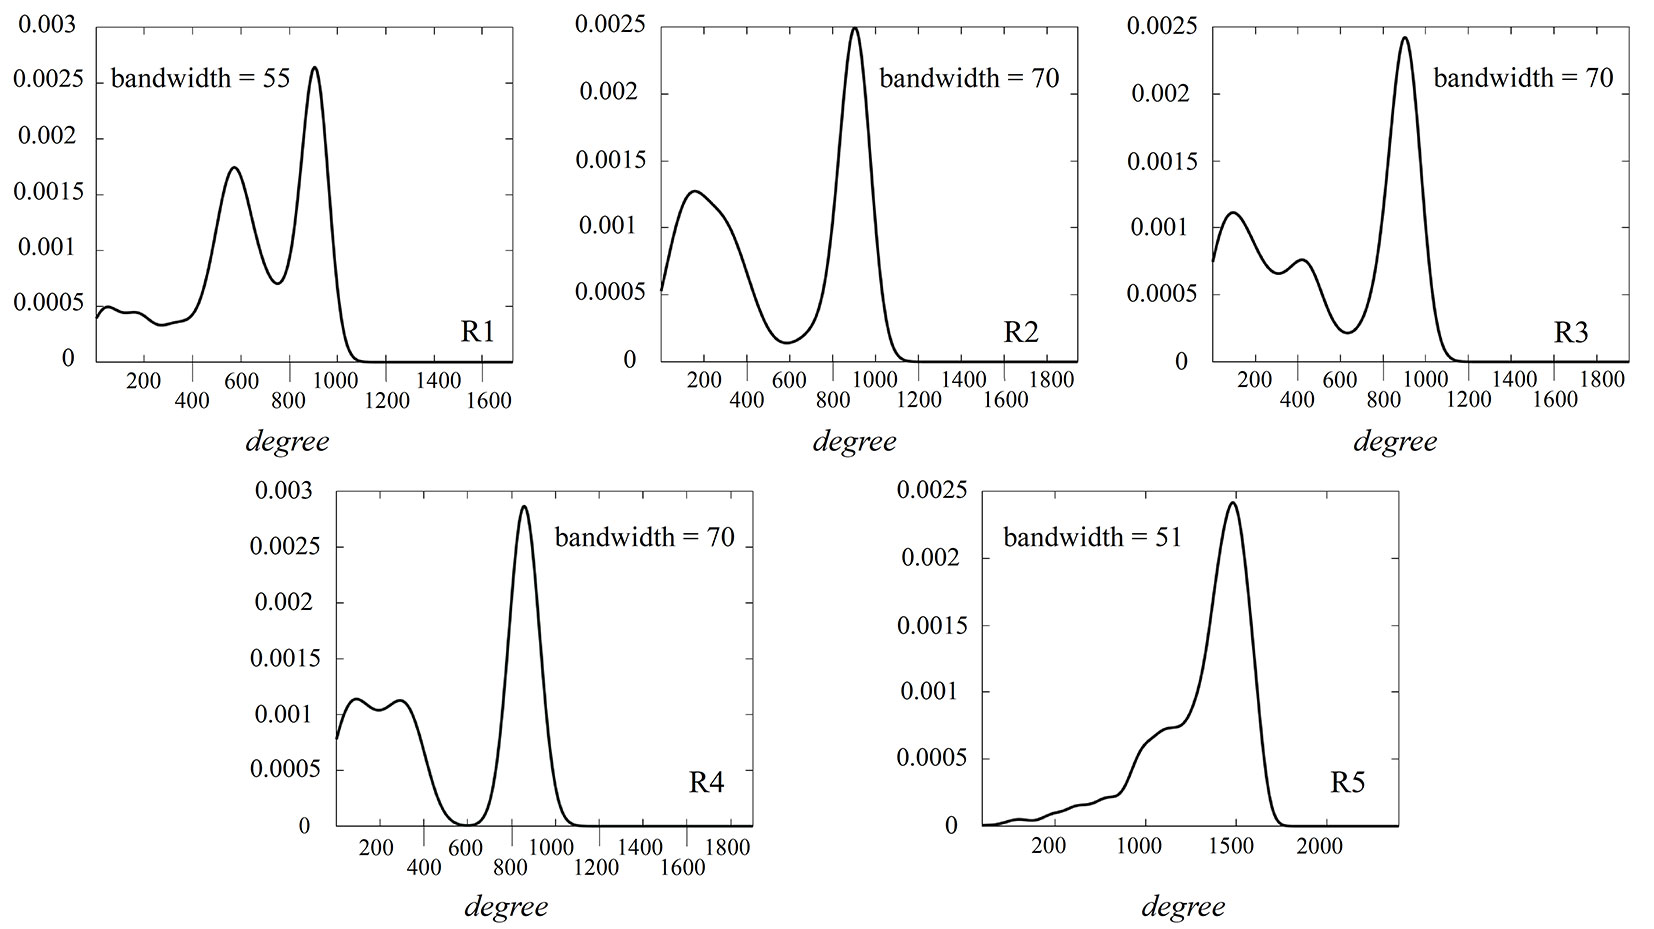
Regarding the network structure, evaluated by the degree metric (Ki), a high probability of finding stands (nodes) with a degree much higher than the average is evident (Fig. 3). Although the dimensions of the networks are different, and therefore, the maximum and minimum degree values differ between networks, the behavior of the estimated density functions for each network are pretty similar. The degree value distribution in all networks presents a negative asymmetry value where the tail of the distribution is lengthened for values below the mean. However, in the R5 network, the data were highly concentrated around the mean due to its sharp distribution curve (Fig. 3).
Fig. 3 - Probability densities estimated with Gaussian kernel for degree values in the proposed complex networks (R1 - R5).
The highest mean value of the triangles metric (Ti) was obtained by the network R5 with 707,570 cycles of length three. In comparison, the R2 network got the minimum mean value of 171,230 cycles, which is also a high number of triangles. Therefore, like the previous metric, these values suggest a high connectivity between the stands that compose the forest. However, negative kurtosis values in networks R1, R2, R3, and R5 indicate a higher proportion of stands with a high level of connectivity; meanwhile, the R4 network, which has a positive kurtosis value, shows that it includes more stands with a similar connection level (see Tab. S1 in Supplementary material).
In the clustering coefficient metric (Ci), the values obtained for R1-R4 networks were in the range of 0-1; and for the R5 network, the values were from 0.6 to 1. The highest mean value (0.9) was obtained in the R4 network and the minimum value (0.7) in R1 and R2 networks. This metric suggests a high clustering tendency between stands in all the networks due to the numerous interactions. Unlike the behavior shown by the triangles metric, most networks’ clustering values are highly concentrated around the mean, except for R2, which presents a kurtosis value of -0.78 (see Tab. S1 in Supplementary material).
Finally, the modularity (Qi) computed different values for R1-R5 networks. The range values for R1-R3 networks were 0-3, 0-4, and 0-2, respectively. In comparison, modularity values of R4 and R5 networks were higher, in a range of 0-5. But the average values calculated for the five networks were in a range of 0.5-1.4. Low modularity values mean that the network does not have densely connected communities (subnets densely isolated), but the subnets are well connected to each other (see Tab. S1 in Supplementary material).
Forest functional zoning
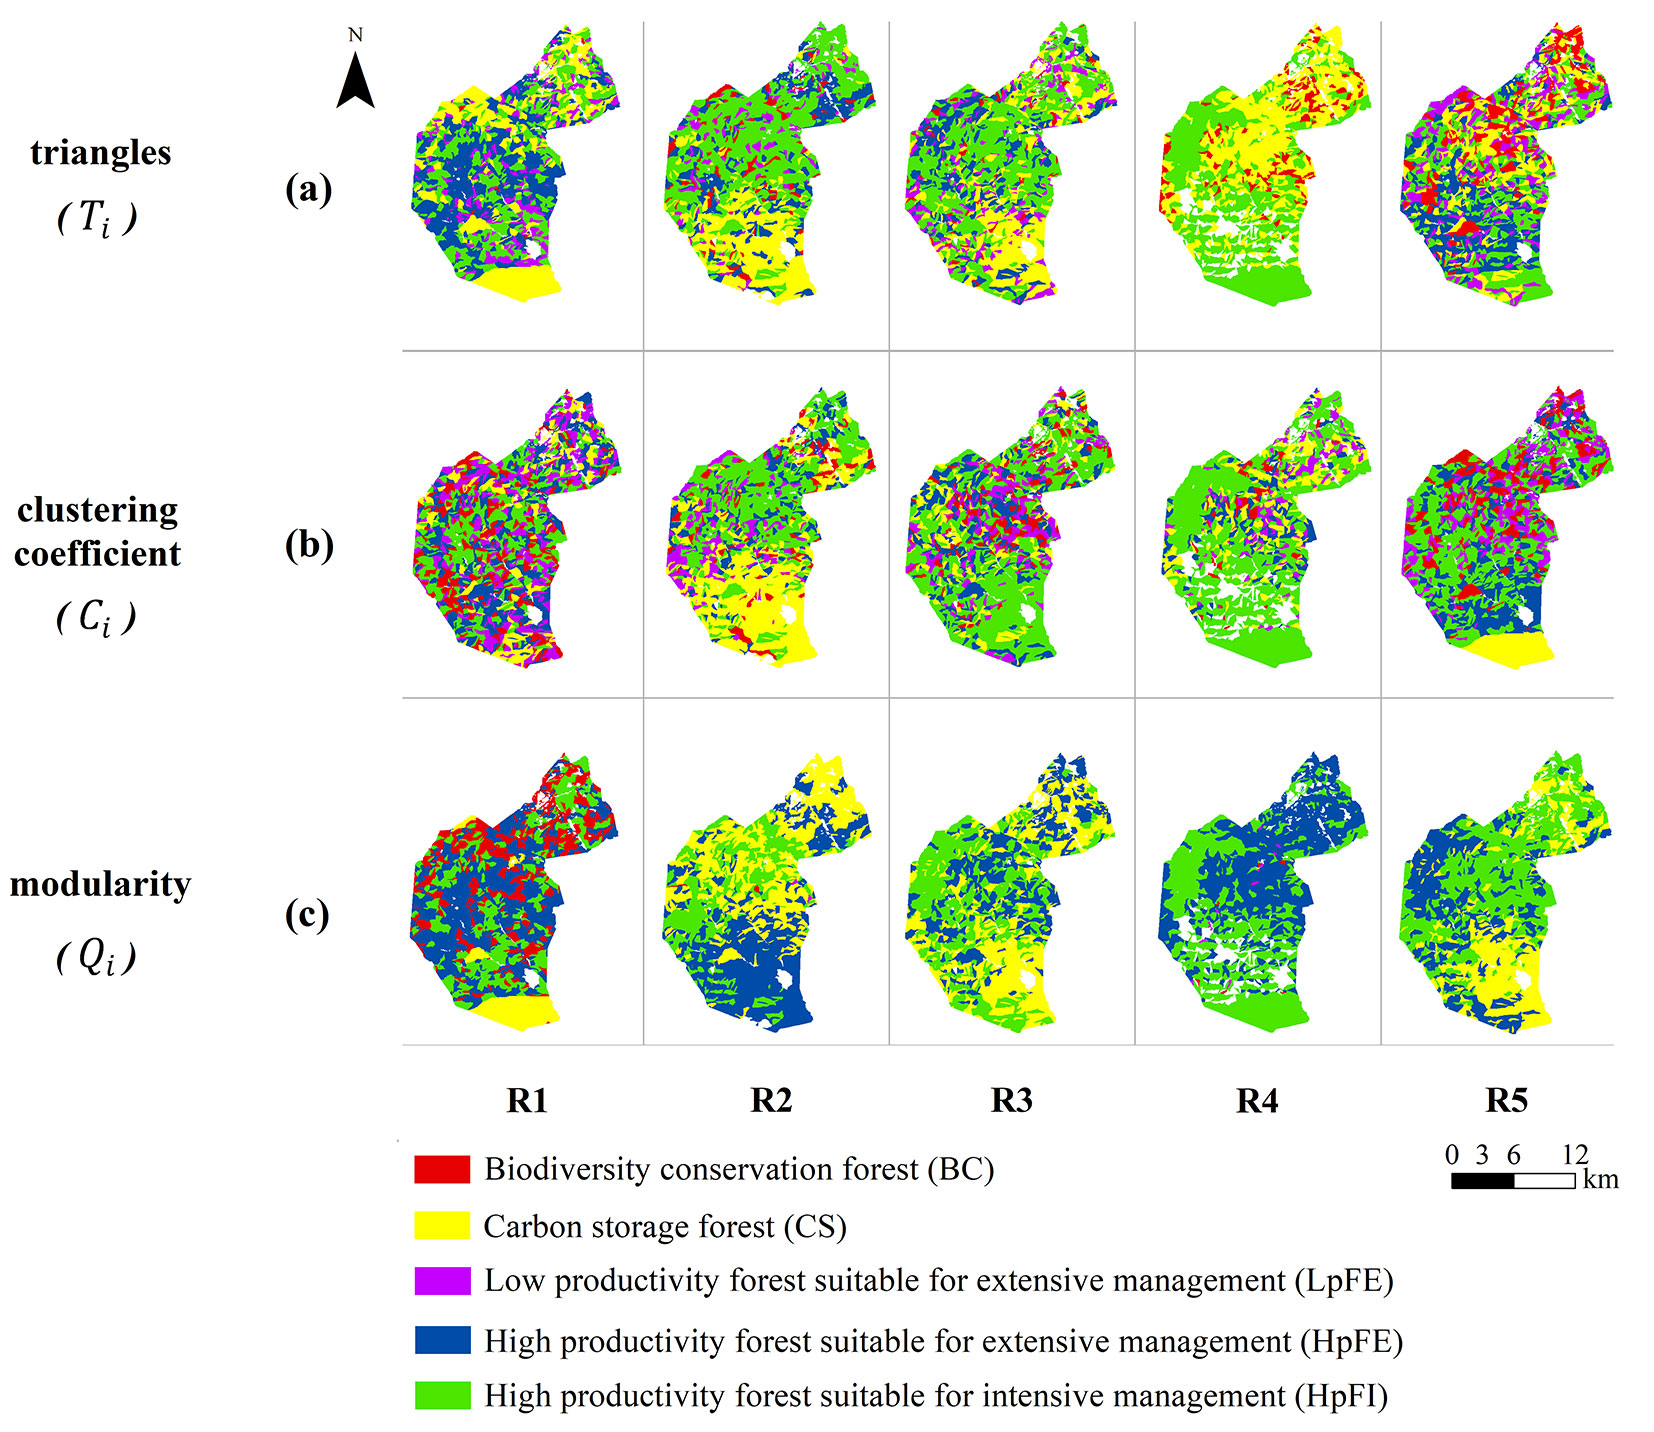
In general, the classification of the stands in one of the proposed functional zones as a function of the segregation metrics evaluated per network (triangles, clustering coefficient, and modularity) showed consistency in the proportion of allocated area to each zone (class). However, there were zones in some networks in which no stand was allocated (Fig. 4).
Fig. 4 - Allocation of stands by functional zone, according to the metrics evaluated for complex networks (R1-R5) proposed. (BC): biodiversity conservation forest; (CS): carbon storage forest; (LpFE): low productivity forest suitable for extensive management; (HpFE): high productivity forest suitable for extensive management; (HpFI): high productivity forest suitable for intensive management.
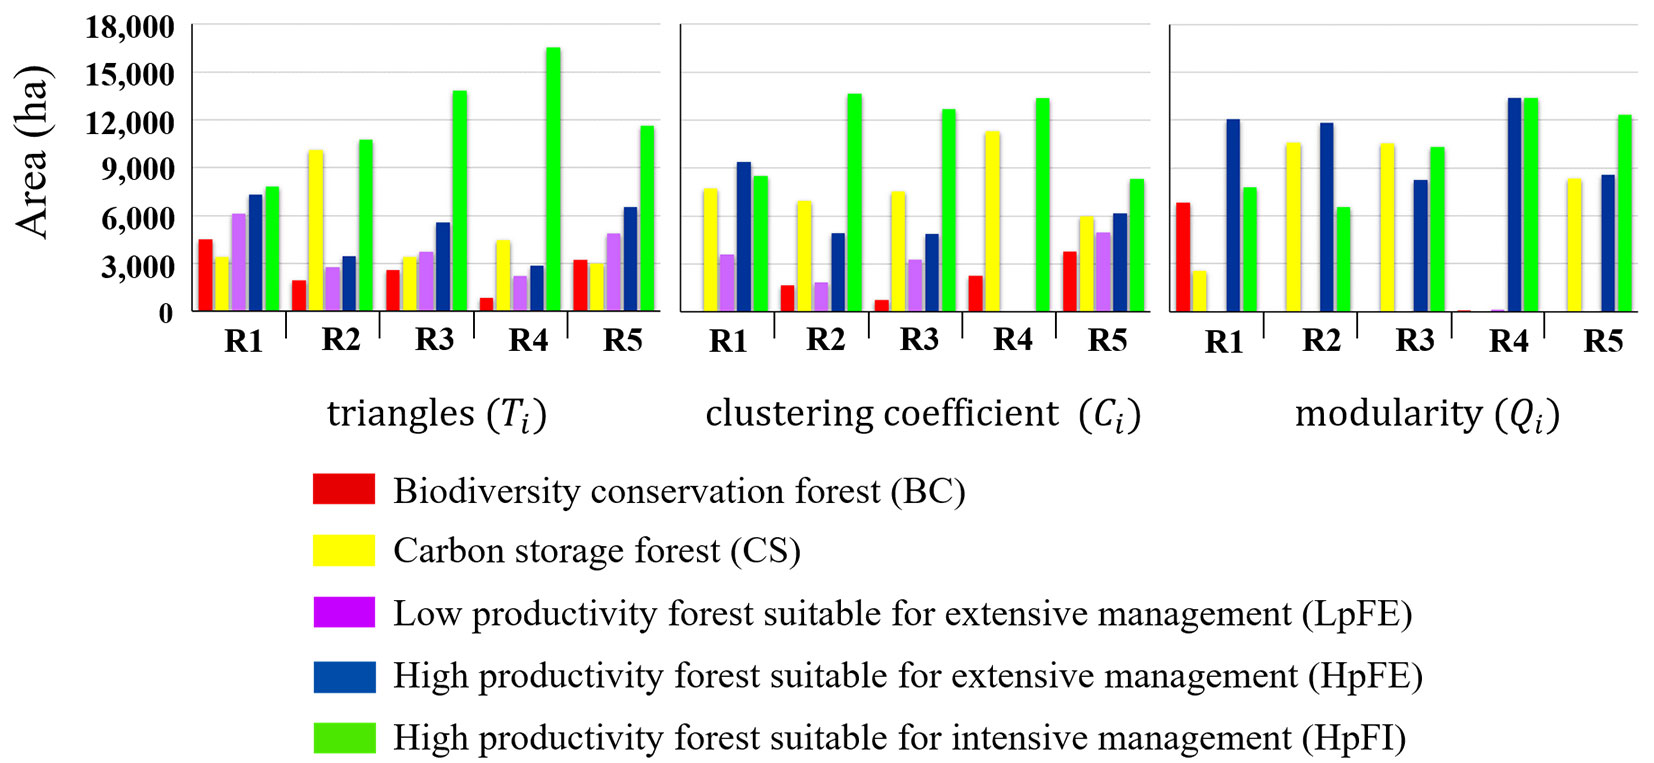
The zone with the largest assigned area (number of stands) by all the metrics was HpFI (high productivity forest suitable for intensive management) with a range of 22-47% of the total forest area. Secondly, the HpFE zone (high productivity forest suitable for extensive management) with 0-46% of the total forest. The CS zone (carbon storage forest) occupied 0-39% of the area; the BC zone (biodiversity conservation forest) occupied 0-23%, and the zone with the smallest area was the LpFE (low productivity forest suitable for extensive management) with a range of 0-21% of the territory (Fig. 5).
Fig. 5 - Area (ha) allocated to each functional zone, determined by the metrics evaluated in the complex networks (R1-R5) proposed.
If the spatial distribution of the stands that conform a zone is of interest, it can be seen that the triangles metric, calculated with all the stand’s variables available, generated zones spatially dispersed. Differently the same metric, using only geophysical and dasometric data, generated carbon storage and timber production agglomerated zones (Fig. 4a).
Contrary, the clustering coefficient metric created a single spatial agglomeration for the carbon storage zone using both all the variables per stand and dasometric variables, whereas using only the geophysical data, this metric generated a scattered scenario for all the zones (Fig. 4b). Finally, the modularity metric agglomerated the stands suitable for carbon storage and timber production in all the networks. Except in the network R1 (geophysical data), the biodiversity conservation zone was excluded from the zoning scheme (Fig. 4c).
Considering the spatial patterns described above, an expert panel selected as the best match between the stands allocation and the desirable criteria for each functional zone, the scenario obtained in the R5 complex network evaluated by the clustering coefficient metric. This functional zoning scenario was compared with the current classification of stands in the study area and validated as a viable scheme of forest zoning (see Fig. S1 in Supplementary Material for the comparing scenarios).
The present forest zoning in the San Pedro El Alto community is focused mainly on biodiversity conservation and intensive timber production. In contrast, the final functional zoning proposal showed the possibility to add productive potentials (different harvesting intensities and carbon sequestration areas) into their forest management scheme.
Discussion
Structural analysis of the complex networks
The high values of degree (Ki), triangles (Ti), and clustering coefficient (Ci) metrics in all the complex networks indicate that stands are connected significantly at stand level. This “connectivity” refers to the linkage existing between two nodes of the network. Those stands highly connected can be identified as the ones which have a high probability of dominating the existing interactions in the forest (system). In case of severe harvesting or eliminating any of these stands, there will likely be a significant impact on the rest of the forest’s ecological dynamics, i.e., the distribution patterns of animal and plant species would be affected. Therefore, the activities carried out in any of these stands will indirectly affect the dynamics and condition of adjacent and neighboring stands.
Despite the modularity metric (Qi) identifying stand communities into the forest, these are well connected both externally and internally. There is not an isolated community that can disappear by not having interaction in the system. A drastic removal or alteration of a large number of stands would be required to stop or prevent the flow of information and interactions (i.e., dispersal of biological material) that exist between the subnets or communities identified in the forest. A community, in this case, is made up of stands that share common functional characteristics and relationships.
To increase the adaptiveness of forest management plans to future environmental changes and promote the ecosystem services prevalence, we need to develop methodologies that incorporate landscape structural metrics at the stand scale such as proximity, land cover classes, diversity, and size ([10], [33]). In response to this need, several studies have developed different methodological frameworks to explore the relationships among the landscape functions and define a proper multifunctional forest zoning ([29], [4], [24], [33]). However, none has used complex network theory to date.
Complex networks theory has been recently applied to diverse scopes such as medicine, logistics and transportation, the World Wide Web, and in ecology to model ecological niches and species food chains ([1], [2]). In the forestry field, we identified the work by Messier et al. ([27]) in which complex networks theory was used to analyze the spatial connectivity of forest stands in terms of seed dispersal and tree establishment capacity as a mechanism to improve forest resilience to global change. Beside this work, we did not find any other evidence about the application of complex network theory in forest management planning, specifically in forest functional zoning.
Forest functional zoning
Independent of the information available for each complex network, all the forest stands were successfully classified into a functional zone by all the connectivity metrics. R2 and R3 networks allocated similar areas to the defined functional zones as a result of close connectivity metrics. This result is logical considering that the R2 network includes both dasometric and productivity variables per stand. Meanwhile, the R3 network synthesizes the set of dasometric variables’ information through the available timber volume per stand as a variable. On the contrary, the metrics calculated for the R3 and R4 networks evaluated the system’s behavior (forest) differently, although both contained similar information, i.e., the available timber volume by genus, and the proportion by genus present in the stand, respectively. Finally, network R5, which included more information and assigned a frequency value to existing links between stands (weighted network), generated considerably different values in the evaluated metrics and, consequently, a different definition of functional zones. In all cases, the validation of specialists and decision-makers is essential to discern which classification is the most appropriate.
Spatially aggregated zoning schemes could facilitate operational forest management, since less spatial aggregation presents a greater challenge to implement day-to-day conservation and silvicultural practices ([22]). In our study, the zoning patterns that showed the highest spatial aggregation were determined by the modularity metric. However, this metric did not include all functional zones. That is why the expert panel and the community selected the zoning scheme presented by the clustering coefficient metric in R5 (Fig. 4). It achieved a better partition of the graph (network) by proposing the best classifications of all the forest’s functional zones while producing a not negligible aggregation between them.
The San Pedro El Alto forest presents a surplus of quality timber inventory, which denotes a highly productive forest ([11]). Thus, the criteria for allocating functional zones favor the prevalence of areas that benefit from the forest productiveness, as are the timber production and carbon storage zones. In contrast, the allocation of stands to the biodiversity conservation zone is much smaller. However, the latter is not because it is unimportant but due to the assignation criteria defined for this particular zone.
As a spatial entity, the quality of the forest is heavily influenced by geographical factors. Therefore, tends to present specific zoning patterns, although these patterns may behave differently as functional characteristics of the ecosystem are integrated ([38]). The methodology proposed in our study successfully analyzed the interactions of multiple criteria related to forest productivity, intensity of forest activities, and the ecological importance of the forest to build a zoning scheme. Compared with the current classification of the stands in the community, the functional zoning scenario proposed shows the possibility of expanding the productive potential the forest.
Multiple optional spatial distribution schemes on the multifunctionality of forest ecosystems increases precision in landscape management ([30], [32]). This justifies the current demand to develop and adopt innovative methodologies for defining functional zoning schemes ([14]). Therefore, our results are outlined as valuable information to support forest managers in a previous stage before developing management plans, increasing the efficiency and the effectiveness in forest management planning.
Limitations and future research directions
In this study, only five functional zones were considered according to the ecological and economic benefits that these implied to the community (forest owners). Also, all data used to analyze the forest as a complex system came from the current management plan (no new data recompilation).
Even though we arbitrarily selected the zoning criteria and available stand information, the general results show an easy way to incorporate complex network theory in forest management planning. The proposed methodology considers geographical attributes, productivity aspects, and biodiversity characteristics of the forest, besides the participation of the owners in the decision-making process of functional zoning. However, we emphasize that no environmental characteristics, ecosystem functions other than carbon storage, and socio-cultural priorities were considered in the analysis.
To efficiently achieve ecological and economic development objectives, and to reduce negative interactions in forest management areas, further exploration of zoning methods is needed. This challenge can be met by developing a conceptual framework for multifunctional ecosystem management (forestry) in which information systems (as the one presented in this study) are an important element to facilitate the analysis of alternative management scenarios and, at the same time, support structured owners’ participation on decision making ([40], [25], [24]).
Conclusions
Complex network analysis is an innovative approach that allows taking advantage of all the information available on the conditions, characteristics, and functions identified in forest ecosystems for allocating stands to a predefined zoning scheme. It has two main benefits: (i) it facilitates the processing of large amounts of data composed of qualitative and quantitative variables; and (ii) it enables the deduction of forest properties that are not identifiable at first glance but results from the interactions between forest elements.
Although zoning is not new in forest management planning, the functional zoning strategy through the complex network approach shows a distinctive quality to encompass topographic, dasometric, production, productivity, diversity, and connectivity attributes associated with the ecosystem into the classification process. The methodology proposed in our study also showed a great capacity to operationalize a functional zoning scheme for the forest easily.
The key contribution of complexity theory to forest management is their practical analysis to achieve functional zoning and the support for decision-makers in the definition of management systems that explicitly recognize the multifunctional value of forests. In a subsequent stage, the proposed work could be integrated into optimization processes to assess the feasibility of different management scenarios, that deal with diverse political and organizational problems in forest management.
List of abbreviations
SI: site index; BC: biodiversity conservation forest; CS: carbon storage forest; LpFE: low productivity forest suitable for extensive management; HpFE: high productivity forest suitable for extensive management; HpFI: high productivity forest suitable for intensive management.
Acknowledgments
We enormously acknowledge the forest community of San Pedro El Alto, Oaxaca, and its technical team, especially to Ing. Raúl M. Hernández-Cortez, for their interest and willingness to collaborate with this research.
References
Gscholar
Gscholar
Gscholar
CrossRef | Gscholar
Gscholar
Gscholar
Gscholar
Gscholar
CrossRef | Gscholar
Authors’ Info
Authors’ Affiliation
José René Valdez-Lazalde 0000-0003-1888-6914
Héctor Manuel De Los Santos-Posadas 0000-0003-4076-5043
Gregorio Ángeles-Pérez 0000-0002-9550-2825
Forest Sciences Department, COLPOS, Mexico C.P. 56230 (Mexico)
Systems Department, UAM - Iztapalapa, Mexico City C.P. 02210 (Mexico)
Corresponding author
Paper Info
Citation
Serrano-Ramírez E, Valdez-Lazalde JR, Mora-Gutiérrez RA, De Los Santos-Posadas HM, Ángeles-Pérez G (2022). Complex networks, an innovative methodology for functional zoning in forest management. iForest 15: 299-306. - doi: 10.3832/ifor3927-015
Academic Editor
Matteo Garbarino
Paper history
Received: Jul 14, 2021
Accepted: Jun 10, 2022
First online: Aug 22, 2022
Publication Date: Aug 31, 2022
Publication Time: 2.43 months
Copyright Information
© SISEF - The Italian Society of Silviculture and Forest Ecology 2022
Open Access
This article is distributed under the terms of the Creative Commons Attribution-Non Commercial 4.0 International (https://creativecommons.org/licenses/by-nc/4.0/), which permits unrestricted use, distribution, and reproduction in any medium, provided you give appropriate credit to the original author(s) and the source, provide a link to the Creative Commons license, and indicate if changes were made.
Web Metrics
Breakdown by View Type
Article Usage
Total Article Views: 27491
(from publication date up to now)
Breakdown by View Type
HTML Page Views: 23800
Abstract Page Views: 2012
PDF Downloads: 1365
Citation/Reference Downloads: 1
XML Downloads: 313
Web Metrics
Days since publication: 1259
Overall contacts: 27491
Avg. contacts per week: 152.85
Article Citations
Article citations are based on data periodically collected from the Clarivate Web of Science web site
(last update: Mar 2025)
(No citations were found up to date. Please come back later)
Publication Metrics
by Dimensions ©
Articles citing this article
List of the papers citing this article based on CrossRef Cited-by.
Related Contents
iForest Similar Articles
Research Articles
The concept of green infrastructure and urban landscape planning: a challenge for urban forestry planning in Belgrade, Serbia
vol. 11, pp. 491-498 (online: 18 July 2018)
Research Articles
Distribution factors of the epiphytic lichen Lobaria pulmonaria (L.) Hoffm. at local and regional spatial scales in the Caucasus: combining species distribution modelling and ecological niche theory
vol. 17, pp. 120-131 (online: 30 April 2024)
Research Articles
Fragmentation of Araucaria araucana forests in Chile: quantification and correlation with structural variables
vol. 9, pp. 244-252 (online: 28 August 2015)
Research Articles
Applying complex network metrics to individual-tree diameter growth modeling
vol. 18, pp. 176-185 (online: 01 July 2025)
Review Papers
Public participation: a need of forest planning
vol. 7, pp. 216-226 (online: 27 February 2014)
Editorials
Spatial information and participation in socio-ecological systems: experiences, tools and lessons learned for land-use planning
vol. 7, pp. 349-352 (online: 19 May 2014)
Review Papers
Landscape genetics of fragmented forests: anticipating climate change by facilitating migration
vol. 2, pp. 128-132 (online: 30 July 2009)
Research Articles
Communicating spatial planning decisions at the landscape and farm level with landscape visualization
vol. 7, pp. 434-442 (online: 19 May 2014)
Research Articles
Quantifying forest net primary production: combining eddy flux, inventory and metabolic theory
vol. 10, pp. 475-482 (online: 12 April 2017)
Research Articles
Species interactions in pure and mixed-species stands of silver fir and European beech in Mediterranean mountains
vol. 14, pp. 1-11 (online: 02 January 2021)
iForest Database Search
Google Scholar Search
Citing Articles
Search By Author
Search By Keywords

