Chloroplast DNA barcoding genes matK and psbA-trnH are not suitable for species identification and phylogenetic analyses in closely related pines
iForest - Biogeosciences and Forestry, Volume 15, Issue 2, Pages 141-147 (2022)
doi: https://doi.org/10.3832/ifor3913-015
Published: Apr 25, 2022 - Copyright © 2022 SISEF
Research Articles
Abstract
The largest and most economically important conifer genus Pinus is widespread in the northern hemisphere. Comprehensive phylogenies relying on complete chloroplast gene sequences are now available for the entire genus. However, phylogenetic relationships remain unresolved for certain lineages. One such example, which is also inconsistent in terms of biogeography, is within the subsection Pinus and includes five taxa: Pinus densiflora, P. nigra, P. resinosa, P. sylvestris and P. mugo / uncinata species complex. In this study, we use this clade as an example to explain weak support in phylogenetic studies of closely related pine species and show that some of the most popular genetic markers, namely the chloroplast DNA barcoding sequences matK, psbA- trnH and rbcL, are not recommended for species identification purposes in European pines. In addition, we show that matK and psbA-trnH contain contradicting phylogenetic signals in some of the most economically important pine species.
Keywords
Introduction
Identification of individuals and multispecies phylogenies are usually based on established universal markers, so called DNA barcodes. DNA barcoding markers matK and rbcL are the standard markers for plants ([21]). However, additional DNA regions are often needed to identify specimens at species level in plant groups that contain little variation among these markers, such as conifers ([22]). In pines in particular, the most frequently used additional markers are the intergenic spacer psbA-trnH and more recently, the highly variable ycf1 gene ([39], [19], [7]).
The psbA-trnH region has been successfully used in a few phylogenetic Pinaceae studies ([18], [43]) but due to technical problems related to the sequencing of the duplicated psbA-trnH region in some pines ([29], [30], [19]), the use of this marker has been limited. In addition, observations that BLAST searches performed on psbA-trnH sequences do not always match conspecific specimens from GenBank (P. cembra, P. nigra, P. mugo and P. Sylvestris - [2]) puts into question the reliability of this marker for species identification purposes. Within-species variability and high plasticity of the psbA-trnH intergenic spacer with frequent indels and inversions have been observed in angiosperms and bryophytes ([3]).
The largest and most economically important conifer genus Pinus is widespread in the northern hemisphere. The number of species is currently estimated to be from about 110 to more than 200, but there exists disagreement about the exact numbers ([41], [15], [8], [10]). Over the years, several classifications have been proposed for the genus Pinus based on morphological and anatomical traits ([12]), isozyme loci ([25]), restriction patterns of chloroplast genome ([50], [28]), sequence data from nuclear ITS (Internal Transcribed Spacer - [31]), mainly chloroplast organelle regions ([14], [9]) as well as the full chloroplast genome ([38]). However, and although these numerous studies are based on different and complementary methods, some taxonomic subdivisions within each subgenus remain unresolved, especially among terminal taxa in some of the subsections ([9], [38], [16]).
One example of species relationships that has been difficult to resolve is within the section Pinus, subsection Pinus where a group of four Eurasian (Pinus densiflora Siebold & Zucc., Pinus nigra Arnold, Pinus sylvestris L. and Pinus mugo Turra) pines and the North American Pinus resinosa Aiton, are placed in the same clade ([14], [9]). In particular, the sister-species relationships of P. nigra and P. resinosa first published by Eckert & Hall ([9]), has aroused comments. In this phylogeny, the clade appeared during the Oligocene approx. 30 million years ago and the divergence between the North American P. resinosa and the Eurasian P. nigra dates from much later, approx. 4 million years ago, in clear contradiction with geological events dating the opening of the Atlantic Ocean at 65 million years ago ([53]). The authors themselves interpreted the close relationship of these two species to be an incorrect inference of topology. However, this relationship reappears in other studies based on comprehensive taxon sampling and eight sequenced chloroplast markers ([11], [47]). The sequences used in these studies came from independent sources: the study by Eckert & Hall used sequences originally published by [57] (P. nigra: matK AB019854, rbcL AB019817) and [13] (P. resinosa: matK AB063516, rbcL: AB063384), while Gallien et al. ([11]) and Saladin et al. ([47]) used the whole chloroplast sequences produced by Parks et al. ([38], [40]). It is noteworthy that Parks et al. ([40]) published a tree based on the whole chloroplast sequences that disagrees with the P. resinosa-P. nigra relationship, as do several other studies. In Gernandt et al. ([14]), who also used matK and rbcL but mainly newly produced sequences (P. nigra: matK AB084498, rbcL AB019817; P. resinosa: matK AY497288, rbcL AY497252), these species are placed in unresolved position within the subsection Pinus. Using nuclear genes ([37]) or a combination of molecular and morphological data ([17]), P. nigra was more closely related to P. sylvestris than to P. resinosa.
We wanted to study if differences in gene tree topology could be the explanation for incongruent results in the phylogenetic relationships of certain taxa between studies. As an alternative, we wanted to test if within-species variation in P. nigra was a reason for incongruent phylogenetic placements. P. nigra has a large distribution area where five subspecies are generally described ([56], Euro+Med PlantBase - ⇒ http://www.emplantbase.org/), although up to six different lineages are recognized by the most recent genetic study on this group ([49]). Yet another possibility was that the material in GenBank includes hybrids or introgressed individuals, since hybridization is quite common in conifers, and not always visible from a morphological point of view ([54]). Errors in labeling and misidentification of specimens in sequences deposited in GenBank could not be ruled out either. Especially young trees might be difficult to identify. Therefore, we re-sequenced the chloroplast markers matK, psbA-trnH and rbcL from several new samples, including different subspecies of P. nigra, and compared them to sequences deposited in GenBank in order to provide a critical assessment on these barcoding genes and the reliability of sequence information obtained from GenBank. We discuss why inconsistencies may be frequent in phylogenies of the genus Pinus and possibly other conifers, and propose solutions to this problem.
Material and methods
Taxon sampling and sequence data
During preliminary analyses of the sequence data produced for this study, including the five pine species P. densiflora, P. nigra, P. resinosa, P. sylvestris and P. mugo / uncinata, we noticed that there existed multiple types of DNA sequences in samples from the same species, both among our and the downloaded sequences. To understand the reasons for inconsistent sequences in these markers, all available matK, rbcL and trnH-psbA sequences for these species based on Blast search results were downloaded from GenBank. P. halepensis was used as outgroup in the analyses. To minimize the possibility of mislabeled samples, we re-sequenced several additional samples focusing on the emblematic clade of Eurasian and New World species that include P. densiflora, P. nigra, P. resinosa, P. sylvestris and P. mugo / uncinata species complex. Sequences from Scotti-Saintagne et al. ([49]) were obtained, consisting of 21-34 P. nigra individuals representing a total of 20 different populations (the number of individuals and populations varied among markers) and the five P. nigra subspecies (as defined in Euro+Med PlantBase - [56]). They were complemented with additional sequences (matK: MK028114 - MK028128; rbcL: MK092816 - MK092835; trnH-psbA: LR590646 - LR590656). The number of individuals sequenced in this study ranged, per species, from a minimum of two to a maximum of fifteen (Tab. 1).
Tab. 1 - Number of sequences generated for this study. The number of individuals, country of origin and number of sequences per DNA region are shown.
| Species | No. ind | Country | matK | rbcL | trnH-psbA |
|---|---|---|---|---|---|
| Pinus halepensis | 13 | France/ Israel/ Morocco/ Turkey | 12 | 13 | 13 |
| Pinus nigra | 34 | Algeria/ Austria/ Bulgaria/ Croatia/ Cyprus/ France/ Greece/ Italy/ Morocco/ Romania/ Serbia/ Spain/ Turkey/ Ukraine | 21 | 25 | 34 |
| Pinus sylvestris | 7 | France | 7 | 4 | 6 |
| Pinus uncinata | 3 | France | 3 | 2 | 2 |
DNA was extracted from leaf tissue using the DNeasy® 96 Plant Kit (QIAGEN, Germany) at the INRA molecular biology laboratory in Avignon, France. Primers were obtained from Kress & Erickson ([26] - matK and rbcL) and Kress et al. ([27] - trnH-psbA). Polymerase chain reactions (PCR) were performed according to the following conditions: denaturation at 95 °C for 5 min, followed by 35 cycles at 94 °C for 30 sec, 48 °C or 53 °C (matK or rbcL and trnH-psbA) for 30 sec and 72 °C for 45 sec with a final 10 min extension step at 72 °C. PCR final volume was optimized to 30 μl and the PCR mix contained: 0.2 mM of each dNTP, 2.5 mM of MgCl2, 0.3 μM of each primers, 1X GoTaq® Flexi Buffer, 1.25 U of GoTaq® DNA Polymerase (Promega, USA) and 30 ng DNA. PCR products were quality-checked on 1.5% agarose gel stained with Ethidium Bromide (EtBr) and successfully amplified samples were sent to the French Genomics Institute “Genoscope” for Sanger sequencing. Sequences were quality checked and edited using CodonCode Aligner® v. 3.7.1 (CodonCode Co., MA, USA); low quality sequences were trimmed and a consensus sequence for each individual using both forward and reverse sequences were obtained, when possible.
The alignments were edited with PhyDE® v. 1.0 ([34]). The re-sequenced and downloaded sequences were organized in groups of identical sequences, i.e., haplotypes, and the species together with their number of occurrence was recorded.
Phylogenetic analyses
Phylogenetic trees using both Bayesian and maximum likelihood approaches were built for each marker. Bayesian analyses were performed using MrBayes v. 3.2.3 ([45]), applying the best-fit substitution model selected using the AIC criterion in jModeltest v. 2.1.10 ([5]). Four runs with four chains (106 iterations each) were run simultaneously. Chains were sampled every 1000 iterations and the respective trees written to a tree file. The burn-in was set at 250.000 generations. Tracer v. 1.6 ([42]) was used for the output of the model parameters to examine the sampling and convergence results. In addition, the concatenated data matrix was analyzed by maximum likelihood (ML) after automatic model selection using ModelFinder ([24]) implemented in IQ-Tree v. 1.4.2 ([35]) applying 1000 ultrafast bootstrap replicates. Consensus topologies and support values from the different methodological approaches were compiled and drawn using TreeGraph2 ([51]).
Results
Within-species polymorphism detected in conservative chloroplast markers
All three sequence regions among these closely related pines are conserved and contain a low number of variable and parsimony informative (present in at least two samples) sites (Tab. 2). The three alignments were deposited in Zenodo at ⇒ https://zenodo.org/deposit/4889916.
Tab. 2 - Alignment statistics. Length of alignment (bp), number of variable sites, percentage of variable sites, number of parsimony informative sites and percentage of parsimony informative sites are shown.
| Region | Bp | variable | %variable | informative | %informative |
|---|---|---|---|---|---|
| matK | 510 | 19 | 3.7 | 12 | 2.4 |
| trnH-psbA | 541 | 22 | 4.1 | 17 | 3.1 |
| rbcL | 627 | 4 | 0.6 | 2 | 0.3 |
Our results show that the counter-intuitive grouping of P. resinosa with P. nigra is not due to the representation of a specific subspecies by the selected P. nigra sample. No variation was detected at barcoding cytoplasmic genes within the P. nigra subspecies despite their high morphological, physiological and ecological variability as well as high diversity at other nuclear genes ([49]). However, when comparing the newly produced sequences with sequences available in GenBank, different haplotypes of P. nigra were detected for each marker (Tab. 3). Likewise, the P. halepensis and P. uncinata sequences produced for this study were monomorphic but different haplotypes were retrieved from GenBank. The re-sequenced P. sylvestris samples represented two different haplotypes, complemented with further downloaded haplotypes (see Tab. S1 in Supplementary material for accession information and references for all sequences used in this study). Since several haplotypes were shared across species, the selection of one sample or another would affect the results of phylogenetic analyses based on these markers. The inclusion of all haplotypes in the analyses performed to resolve taxonomic relationships among the five pine species (P. densiflora, P. nigra, P. resinosa, P. sylvestris and P. uncinata) resulted in ambiguous placements of several species, not consistent with species delimitations (Fig. 1, Fig. 2, Fig. 3). Due to the detected within-species variability and low number of parsimony-informative sites, the taxonomic position of the studied species based on only these markers could not be reliable.
Tab. 3 - A list of matK, psbA-trnH and rbcL haplotypes. The haplotypes are named according to the species they occurred in. The column nb indicates the total number of individuals represented by each haplotype. The last column indicates the number of individuals per species.
| Region | Haplotype | nb | Species |
|---|---|---|---|
| matK | halepensis_1 | 14 | - |
| densiflora-sylvestris | 7 | densiflora: 6, sylvestris: 1 | |
| densiflora-mugo-uncinata-sylvestris | 36 | densiflora: 11, mugo: 10, uncinata: 3, sylvestris: 12 | |
| nigra-resinosa | 37 | nigra: 35, resinosa: 2 | |
| nigra_1 | 1 | - | |
| resinosa_1 | 3 | - | |
| sylvestris_1 | 1 | - | |
| sylvestris_2 | 1 | - | |
| uncinata_1 | 1 | - | |
| psbA-trnH | halepensis_1 | 25 | - |
| halepensis_2 | 1 | - | |
| halepensis_3 | 1 | - | |
| densiflora_1 | 3 | - | |
| densiflora-sylvestris | 30 | densiflora: 16, sylvestris: 14 | |
| mugo | 1 | 1 | |
| mugo-sylvestris-uncinata | 13 | mugo: 5, sylvestris: 1, uncinata: 7 | |
| nigra_1 | 27 | - | |
| nigra_2 | 1 | - | |
| nigra_3 | 1 | - | |
| nigra_4 | 1 | - | |
| resinosa_1 | 1 | - | |
| resinosa_2 | 1 | - | |
| sylvestris_1 | 6 | - | |
| sylvestris_2 | 1 | - | |
| rbcL | halepensis-resinosa | 20 | halepensis: 14, resinosa: 6 |
| densiflora-nigra-resinosa-sylvestris | 39 | densiflora: 16, nigra: 4, resinosa: 1, sylvestris: 18 | |
| densiflora-nigra | 5 | densiflora: 4, nigra: 1 | |
| mugo_1 | 1 | - | |
| mugo_2 | 1 | - | |
| nigra-sylvestris | 24 | nigra: 20, sylvestris: 4 | |
| uncinata_1 | 2 | - |
Fig. 1 - Phylogram based on matK sequences. The haplotypes are named according to the species they occurred in, with a font size scaled according to the frequency (bigger font for more common haplotype). The tree represents the majority consensus of trees sampled after stationarity in the Bayesian analysis. Posterior probability values from the Bayesian inference are indicated first and the corresponding bootstrap values of the maximum likelihood analysis are shown after when applicable. Only bootstrap values ≥ 50 are indicated.
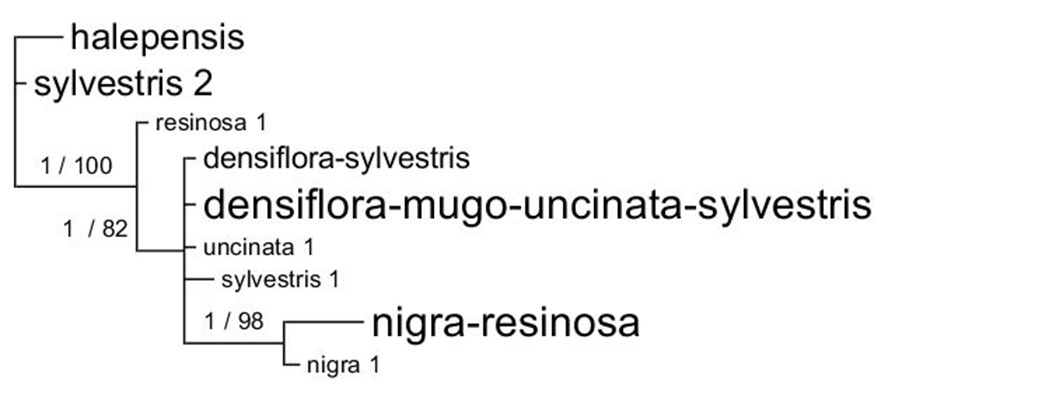
Fig. 2 - Phylogram based on trnH-psbA sequences. The haplotypes are named according to the species they occurred in, with a font size scaled according to the frequency (bigger font for more common haplotype). Different haplotypes from same species are colored with the same color. The tree represents the majority consensus of trees sampled after stationarity in the Bayesian analysis. Posterior probability values from the Bayesian inference are indicated first and the corresponding bootstrap values of the maximum likelihood (ML) analysis are shown after when applicable. Only bootstrap values ≥ 50 are indicated. Square brackets indicate topological conflict between Bayesian and ML tree.
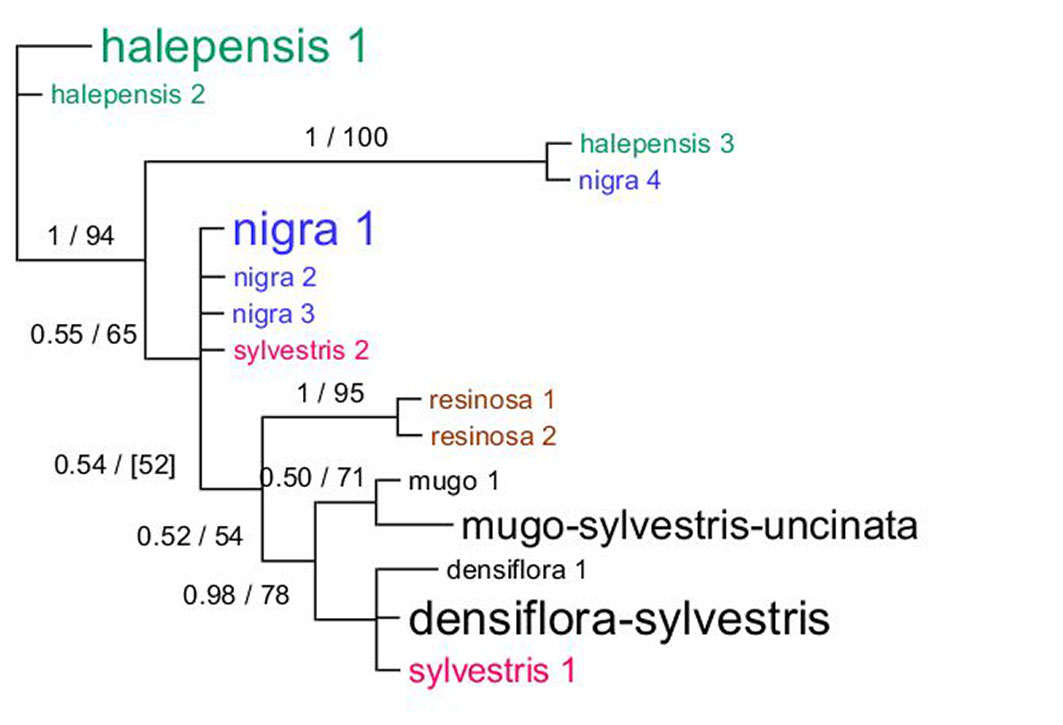
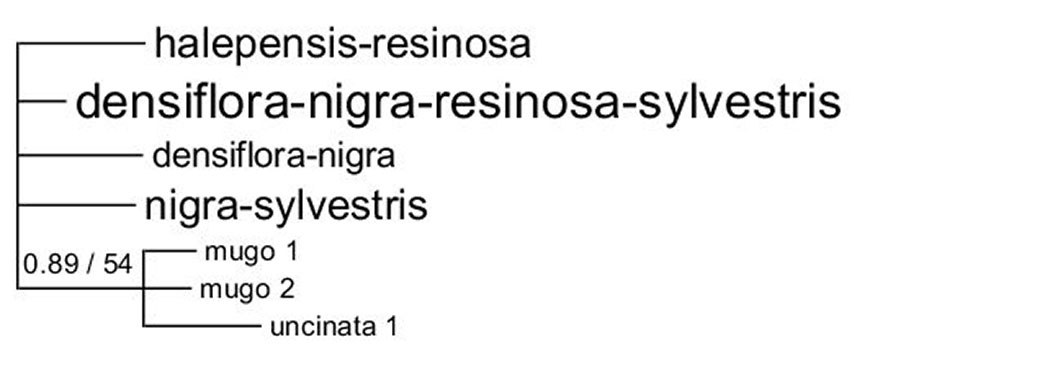
Fig. 3 - Phylogram based on rbcL sequences. The haplotypes are named according to the species they occurred in, with a font size scaled according to the frequency (bigger font for more common haplotype). The tree represents the majority consensus of trees sampled after stationarity in the Bayesian analysis. Posterior probability values from the Bayesian inference are indicated first and the corresponding bootstrap values of the maximum likelihood analysis are shown after when applicable. Only bootstrap values ≥ 50 are indicated.
Variation in matK causes species non-monophyly
There were nine haplotypes present in the matK alignment. Only the P. halepensis sequences were species-specific and monomorphic (except for one unresolved base in JN854197). The most frequent haplotypes were shared by different species: the densiflora-mugo-uncinata-sylvestris haplotype was present in 36 samples from several different studies, while the nigra-resinosa haplotype contained mainly sequences from P. nigra and two resinosa samples from two different studies. The densiflora-sylvestris haplotype contained six densiflora samples and one sylvestris, all from the same study.
It was not possible to build a well-resolved phylogenetic tree based on the matK alignment. In addition to lack of support for the nodes, the branch lengths were short. Noteworthy, P. sylvestris and P. resinosa were resolved as non-monophyletic. The expected outgroup P. halepensis was grouped together with a P. sylvestris haplotype (sylvestris 2) represented by only one sample. This P. sylvestris sample (MK036240) was produced within the current study and a Blast search showed that the compared sequence parts were identical with other pine species (P. canariensis, P. pinea, P. pinaster and P. roxburghii) instead of P. Sylvestris.
Random distribution of the psbA-trnH intergenic spacer sequences
Again, the phylogenetic tree based on the psbA-trnH intergenic spacer is not likely to represent a satisfactory hypothesis of relationships (Fig. 2). The sequences did not group according to species, as can be observed both from the aligned sequences and the phylogeny based on them. The resolution and support values were low for many branches in both Bayesian and ML analyses. Since incongruences at nodes with high support were not present, only the Bayesian consensus tree is shown (Fig. 2). The only species that appeared monophyletic based on this data set is P. resinosa. The position of P. halepensis as outgroup was not supported. One P. nigra sequence (nigra 4 haplotype, EU531715) was almost identical (only 1 bp difference) to a sequence from P. halepensis (halepensis 3, FN689388), including a 10 bp inversion at the beginning of the sequences, and both were shown by a BLAST search to share 100% similarity with sequences from P. pinaster. The most common haplotypes of both P. halepensis (halepensis_1) and P. nigra (nigra_1) represented numerous samples (25 and 27, respectively). The most common psbA-trnH haplotype was the densiflora-sylvestris haplotype with sequences shared by 30 samples. Although the level of variation was generally low in these closely related species (Tab. 2), several small repetitions, deletions and inversions were observed in the alignments with an apparently random distribution across species.
Conservative rbcL region
The rbcL region contained only four variable sites of which two were parsimony informative. In addition, two of the variable sites were located at the ends of the alignment, within the first or last 5 bp, which might affect their reliability due to bad quality sequences in the ends of sequences. The most common haplotypes were shared among species: the densiflora-nigra-resinosa-sylvestris type was detected in 39 samples, the nigra-sylvestris type in 24 samples, the halepensis-resinosa in 20 samples and the densiflora-nigra in 5 samples. The low level of variation within this region was insufficient to resolve phylogenetic relationships in the species included in this study (Fig. 3).
Discussion
Evaluation of barcoding markers in pines from subsection Pinus
The chloroplast DNA markers matK, psbA-trnH and rbcL have been shown to be poor barcoding genes for hard pines ([19]) and the P. mugo complex ([4]), as well as Cycads ([48]) and closely related angiosperm species complexes ([46], [55], [60]). Nonetheless, they are still commonly used for taxonomic identification and phylogenetic inference in all land plants. Our results confirmed that none of them are well suited for species identification and phylogenetic inference in the group of pines we studied, and in addition, pointed out inconsistent within-species variability.
It is difficult to conclude with certainty whether the variability is due to real variation or independent errors caused by technical artifacts, wrong identification and mislabeling among the studied samples. In general, very few studies report error rates on sequencing and labeling. As an exception, the thorough study by De Vere et al. ([6]) mentioned an error rate of 4.8% for rbcL and 3.8% for matK region. This error rate was reported on sequence production, and because of verification of results and correction of identified errors, the error rates in sequences that are actually used in research and submitted to GenBank can be assumed to be lower. Attention must naturally be paid when using material downloaded from external sources, but if human error is assumed to be the source of all variability in the studied sequences, then the error rate among this particular group of organisms would be exceptionally high and, in our opinion, unlikely. However, if the detected variation was real, there might be several biological reasons for this.
Wind pollination and predominantly paternally inheritance of chloroplast genome, large effective population sizes, genetically variable populations, hybridization and chloroplast capture are factors that cause incomplete lineage sorting and therefore interfere with species division based on genetic markers in conifers. Indeed, local chloroplast capture has been documented in the genus ([23], [33], [32], [59], [19]). Also, Heuertz et al. ([20]) reported that the genetic variation based on chloroplast SSR data in the P. mugo / uncinata complex was not structured according to morphology, but according to geography, and that some haplotypes were shared between P. mugo and the closely related P. sylvestris.
Chloroplast capture is possible only where species are sympatric, either current-day or sometime in the past. In this study we did not observe clear differentiation by geographic region, though a tendency of finding the same haplotypes within the same published study can be observed. Again, mix-up of samples within the study and consistent artifacts (i.e., caused by bad quality sequences) usually in the ends of the sequences, when the same primers and sequencing methods are used, might explain some of these differences. In general, results based on regions with low variability and especially variation at sequence ends should be considered with caution since they could be low-quality sequence induced errors. Consistent differences were detected in the middle of the sequences of several samples, and we therefore believe that real biological differences exist, in addition to possible artifacts and human errors.
Perspectives and alternative molecular markers
We confirm that the chloroplast DNA markers matK, psbA-trnH and rbcL should not be used for reliable phylogenetic and taxonomic inference in pines. We also suggest that the reliability of the studied markers need to be analyzed in other conifer species. Within-species variation might go unnoticed in multi-species phylogenetic analyses in which it is often common practice to use only one specimen per species due to limited resources. Furthermore, when different gene variants exist and one of the forms is locally more common, even the inclusion of several samples would not make an obvious difference. The fast evolving marker ycf1 harbors a large amount of variable sites but it might not reflect species relationships correctly ([47]). In addition, its usefulness for species identification using a large amount of samples still needs to be studied.
The use of nuclear genes will be useful for evolutionary and phylogenetic analyses. While chloroplast capture often occurs in the absence of nuclear introgression ([44]), hybridization also affects nuclear genes. On one hand, nuclear genes are exchanged less freely between species ([58]). On the other hand, nuclear genes are likely to show non-monophyly in taxa sharing similar life history traits due to the absence of allelic coalescence ([52]). It will be important to employ both chloroplast and nuclear markers to study phylogenetic relationships and evolutionary history, including possible hybridization and chloroplast capture in these species. Currently the only nuclear barcoding marker is the widely used internal transcribed spacer (ITS), but its complex and unpredictable evolutionary behavior has been shown to reduce its utility in phylogenetic analyses ([1]), being especially puzzling in pines ([31]). Recent studies have provided large amounts of nuclear sequence regions, e.g., using Hyb-Seq ([16]) or identification of orthologous genes ([36]) for specific pine groups, but it remains to test which of these potential markers are suitable to be used as general DNA barcoding markers in all pines.
Acknowledgements
We thank Denis Vauthier (INRAE UEFM, Avignon, France) for sample collection. We appreciate comments from four reviewers on the current and an earlier version of the manuscript.
This work was supported by: The French Office National des Forêts “Programme global de conservation des populations françaises de pin de Salzmann”; the French DNA barcoding program “Bibliothèque du Vivant”; the Spanish Ministry of Economy and Competitiveness (MINECO) contract to SO [PTA2015-10836-I]; the Aix-Marseille Université, France (Ecole Doctorale ED251) grant to GG; the short-term scientific mission program of the COST Action FP1202 grant to GG.
References
Gscholar
Gscholar
Gscholar
CrossRef | Gscholar
CrossRef | Gscholar
Supplementary Material
Authors’ Info
Authors’ Affiliation
Department of Forest Ecology & Genetics, Forest Research Centre, INIA-CSIC, Carretera de la Coruña km 7.5, E-28040 Madrid (Spain)
Anne Roig
Bruno Fady 0000-0003-2379-7617
INRAE, UR629, Ecologie des Forêts Méditerranéennes - URFM, Domaine Saint Paul, F-84914 Avignon (France)
Giovanni Giuseppe Vendramin 0000-0001-9921-7872
Institute of Biosciences and Bioresources, National Research Council, Division of Florence, I-50019 Sesto Fiorentino, FI (Italy)
Corresponding author
Paper Info
Citation
Olsson S, Giovannelli G, Roig A, Spanu I, Vendramin GG, Fady B (2022). Chloroplast DNA barcoding genes matK and psbA-trnH are not suitable for species identification and phylogenetic analyses in closely related pines. iForest 15: 141-147. - doi: 10.3832/ifor3913-015
Academic Editor
Alberto Santini
Paper history
Received: Jun 25, 2021
Accepted: Feb 15, 2022
First online: Apr 25, 2022
Publication Date: Apr 30, 2022
Publication Time: 2.30 months
Copyright Information
© SISEF - The Italian Society of Silviculture and Forest Ecology 2022
Open Access
This article is distributed under the terms of the Creative Commons Attribution-Non Commercial 4.0 International (https://creativecommons.org/licenses/by-nc/4.0/), which permits unrestricted use, distribution, and reproduction in any medium, provided you give appropriate credit to the original author(s) and the source, provide a link to the Creative Commons license, and indicate if changes were made.

Web Metrics
Breakdown by View Type
Article Usage
Total Article Views: 41739
(from publication date up to now)
Breakdown by View Type
HTML Page Views: 33717
Abstract Page Views: 3670
PDF Downloads: 3763
Citation/Reference Downloads: 10
XML Downloads: 579
Web Metrics
Days since publication: 1532
Overall contacts: 41739
Avg. contacts per week: 190.71
Article Citations
Article citations are based on data periodically collected from the Clarivate Web of Science web site
(last update: Mar 2025)
Total number of cites (since 2022): 2
Average cites per year: 0.50
Publication Metrics
by Dimensions ©
Articles citing this article
List of the papers citing this article based on CrossRef Cited-by.
Related Contents
iForest Similar Articles
Research Articles
Adaptive response of Pinus monticola driven by positive selection upon resistance gene analogs (RGAs) of the TIR-NBS-LRR subfamily
vol. 10, pp. 237-241 (online: 02 February 2017)
Research Articles
Early flowering and genetic containment studies in transgenic poplar
vol. 5, pp. 138-146 (online: 13 June 2012)
Research Articles
Seedling emergence capacity and morphological traits are under strong genetic control in the resin tree Pinus oocarpa
vol. 17, pp. 245-251 (online: 16 August 2024)
Review Papers
Fifteen years of forest tree biosafety research in Germany
vol. 5, pp. 126-130 (online: 13 June 2012)
Research Articles
Characterization of two poplar homologs of the GRAS/SCL gene, which encodes a transcription factor putatively associated with salt tolerance
vol. 8, pp. 780-785 (online: 19 May 2015)
Technical Advances
Gene flow in poplar - experiments, analysis and modeling to prevent transgene outcrossing
vol. 5, pp. 147-152 (online: 13 June 2012)
Research Articles
Comparison of genetic parameters between optimal and marginal populations of oriental sweet gum on adaptive traits
vol. 11, pp. 510-516 (online: 18 July 2018)
Research Articles
Genetic variation and heritability estimates of Ulmus minor and Ulmus pumila hybrids for budburst, growth and tolerance to Ophiostoma novo-ulmi
vol. 8, pp. 422-430 (online: 15 December 2014)
Commentaries & Perspectives
The genetic consequences of habitat fragmentation: the case of forests
vol. 2, pp. 75-76 (online: 10 June 2009)
Research Articles
Genetic diversity of core vs. peripheral Norway spruce native populations at a local scale in Slovenia
vol. 11, pp. 104-110 (online: 31 January 2018)
iForest Database Search
Search By Author
Search By Keyword
Google Scholar Search
Citing Articles
Search By Author
Search By Keywords
PubMed Search
Search By Author
Search By Keyword


