A multisource approach helps to detect a forest as a reference site in an intensively used rural landscape (Uckermark, NE Germany)
iForest - Biogeosciences and Forestry, Volume 14, Issue 5, Pages 426-436 (2021)
doi: https://doi.org/10.3832/ifor3774-014
Published: Sep 21, 2021 - Copyright © 2021 SISEF
Research Articles
Abstract
The sharp decline in seminatural areas worldwide is undisputed, but the consequences of this decline, apart from the loss of biodiversity, cannot be fully assessed. To restore ecosystems or landscapes, it is essential to have so-called reference sites. We want to show how reliable reference sites can be found in heavily used landscapes with the help of independent sources, and we present an approach that can be used in other regions, because it is very well suited for developing essential databases in the context of theses at different levels. A forest of seminatural stocking was selected in northeast Germany as a case study. The mapping of archival sources and the analyses of historical maps as well as field investigations were combined to reconstruct the dynamics of vegetation and soil for the last several centuries to thousands of years. Palynological data from nearby sites show that the study area has been forested for several millennia and has been less influenced by humans in the last 450 years. Together with historical maps of tree species composition, it allows to infer that the specific forest has been preserved in good ecological conditions for at least 250 years. Soil inventory and field studies on two catenas and corings support this conclusion, as they rarely show signs of anthropogenic erosion and related colluviation. Using a multisource approach, it is possible to identify potential reference sites that provide a reliable basis for ecosystem or landscape restoration.
Keywords
Ancient Forest, Geo-bio-archives, Historic Maps, Land Use Legacy, Pollen Analysis, Reference Site
Introduction
With the ongoing growth of the world population, intensive land use across extensive areas has become a global phenomenon, and seminatural terrestrial ecosystems are diminishing ([9], [42]). Even in sparsely populated landscapes, evidence of past land use has been found, such as traces of Neolithic farmland in the boreal zone of northern Europe ([3]) or of “field systems” in the Amazonian forests ([31]). Densely populated regions such as Central Europe seem to lack any seminatural sites ([35]). Even peripheral sites of this area, such as the famous Bialowieza Primeval Forest in eastern Poland and western Belarus, have been demonstrated to be impacted by land use in the last two millennia ([18]). Despite these extensive human interventions on the landscape, there are still areas/sites that are in fairly good ecological conditions and, in many cases, are designated as protected areas. They can serve as reference sites for formulating restoration targets for other areas/sites, for example, to restore higher species diversity or protect soil functions in an ecosystem. There are different approaches used to obtain an idea of the seminatural state of ecosystems as references for ecological/environmental change. Such approaches include: (i) the reconstruction of past vegetation; (ii) the concept of potential natural vegetation; (iii) the creation of indices for biological/ecological integrity or naturalness; and (iv) the detection of reference sites.
The reconstruction of vegetation before human intervention uses historical data, e.g., notes from old field surveys and paleo-ecological sources ([17]). Such investigations provide information on pre-impact vegetation for the restoration of seminatural ecosystems ([39]). Potential natural vegetation (PNV) is defined as the hypothetical state of vegetation after human influence has ceased, assuming constant climatic conditions. Unlike the previous approach, PNV units are constructed based on the modern vegetation present in an area and represent a projection into the future (not into the past - [4]). This approach does not define an ideal state of nature or an ecosystem; however, the approach can contribute to better management, which amounts to the restoration and improvement of good ecological conditions, including biodiversity ([50]). Biological integrity is defined as the capability of supporting and maintaining a balanced, integrated, adaptive community of organisms having a species composition, diversity, and functional organization comparable to that of the “natural” habitat of a region ([57]). It is usually measured by key attributes, such as plant or animal species, as well as by compositional, structural and functional indicators ([60]). The reference concept has been developed in restoration ecology and aims for concrete representations of ecological references or reference sites supported by quantitative models ([39]). There is no explicit definition for an ecological reference or a reference site, but rather general statements are made such as “ecosystems in self-organized condition” or “intact ecosystems”. McDonald et al. ([32]) provide a definition that very strongly focuses on concrete projects. According to this definition, “a reference ecosystem is a model characteristic of the particular ecosystem that informs the target of the restauration project” ([32]).
In this study, we adopt a pragmatic approach that can best be understood as a combination of the four approaches outlined above to find potential reference sites in the sense of sites that are in good ecological condition. We used a spatiotemporal top-down approach (regional to local scale, several 1000 years ago until today) by focusing on long-term vegetation and soil development (palynology, soil catena), (pre)historic land use (archaeological finds, archive documents), land cover (historical maps) and forest stand development (inventory data). Starting from the regional scale (landscape approximately 50 km radius around the study area) via a sub-regional scale (water catchment) to the local scale (Kiecker Forest), we prove that the study area is a representative site of the hilly landscape of north-eastern Germany. Our aim was to bring together expert knowledge from different disciplines to provide an explanation as sufficient as possible for the maintenance of good ecological conditions in the Kiecker Forest. Using this approach, we wanted to show how reliable reference sites could be found with the help of independent sources, and we presented an approach that can also be applied in other regions.
Material and methods
Study area
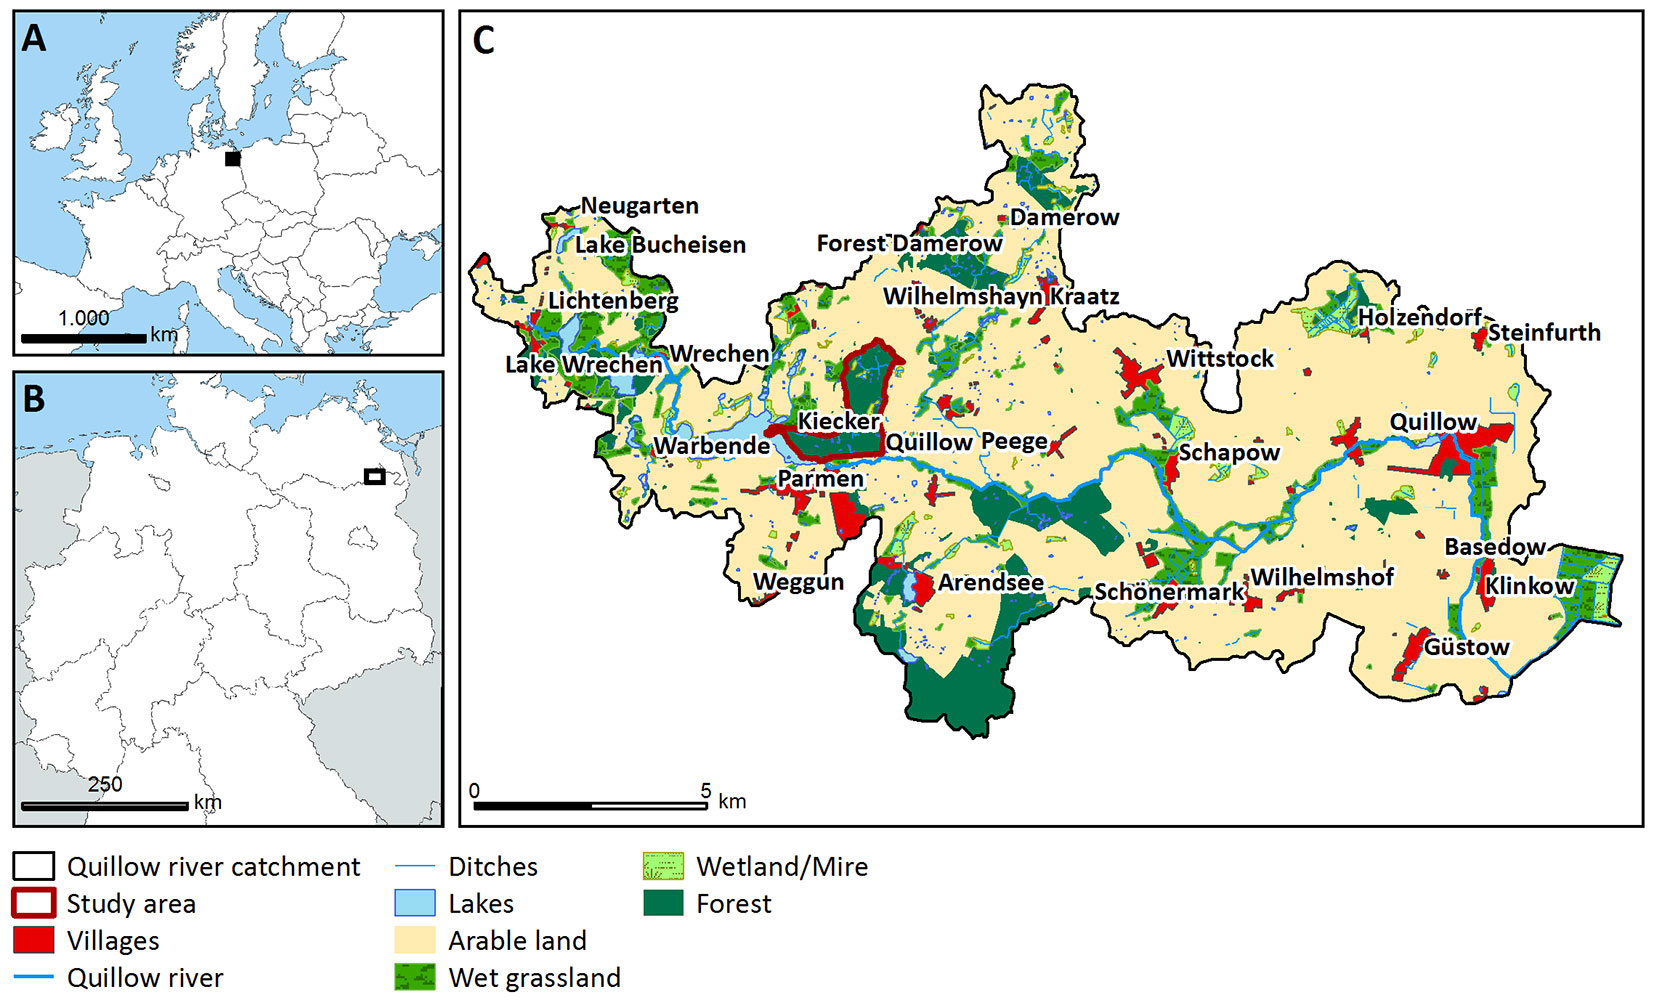
The Kiecker forest (53° 22′ N, 13° 36′ E - Fig. 1 and Fig. S1 in Supplementary material) has been a nature reserve since 1992, designated to protect seminatural deciduous tree vegetation with high biodiversity amidst an intensively used “agricultural steppe” ([5]). It is not strictly protected, as partial cutting and salvage logging are allowed. The forest has a size of 261 ha. The main forest vegetation is composed of beech (Fagus sylvatica L.) covering approximately 60% of the forest area, followed by oak (Quercus robur L.) and birch (Betula pendula L.) with approximately 9% and 6% coverage, respectively, resulting in the main vegetation type of Melico-Fagetum according to Hofmann & Pommer ([14]). The remaining area is covered by coniferous tree species (approximately 17%) and other tree species (approximately 8%). Additionally, some small water areas and mires with reed and sedge vegetation occur in glacial kettle holes. The climate of the region can be classified as temperate humid. The study area is part of a transitional zone from submaritime to subcontinental climate conditions ([12]). The local weather station at Feldberg/Mecklenburg-Vorpommern, approximately 10 km to the southwest of Kiecker, recorded a mean annual air temperature of 7.7 °C and a mean annual precipitation of 611 mm y-1 in the period 1961-1990 (⇒ http://www.pik-potsdam.de/). The terminal moraine of the Weichselian (last Glacial) Gerswalder Staffel formed the geological and geomorphological setting of the study area ([27]). The relief is undulating with several pronounced hilltops, rather steep slopes and closed depressions, having an elevation range between 89 and 127 m a.s.l. The sediments on the surface consist mainly of sand-covered till, boulder layers and glaciofluvial sand. Peat locally occurs in depressions. The soil cover is dominated by Albic Luvisols and Arenosols/Cambisols supplemented by Stagnosols, Gleysols and Histosols, which is a soil pattern typical for morainic sites in the region ([49]). In contrast with the intensive agricultural land surrounding the forest ([21]) and even with other forested sites in the region ([20]), only marginal traces of past soil erosion have been detected at Kiecker thus far. The Kiecker forest belongs to the catchment of the Quillow River, which origins in Lake Parmener See on the southwestern border of the study site. The Quillow catchment (approximately 16.094 ha) can be regarded as an original assemblage of undrained (sub) catchments, which were connected by artificial ditches probably no earlier than the 13th century AD, draining the catchment since then to the Ucker River ([6]). In general, the study area represents a site that is very typical of the morainic landscape of the region.
Fig. 1 - Location of study area. (A) Location in northeast Germany; (B) location in northeast Brandenburg; and (C) shown in detail (Kiecker forest red bordered), within the Quillow catchment.
Palynological records (regional and local scales)
Although a number of peat-filled depressions and thus potential sedimentary geo-bio-archives exist in the Kiecker forest, a local pollen analysis has been discarded, as there was too much evidence for disturbance of the deposits. Most of the depressions were drained in the 19th/20th centuries, which led to the destruction of the uppermost decimetres of peat and thus of the pollen records for the last centuries. Instead, the pollen analysis of a peat profile from a small kettle hole mire in the Conower Werder forest provides information on local forest dynamics. Conower Werder forest is situated only 11 km southwest and is very comparable to the Kiecker forest in terms of site conditions, current vegetation (Melico-Fagetum), and knowledge on land use history. To use pollen data from a different site bears the potential of misinterpreting the development in the Kiecker forest. However, both the palynological data and the local land use history, including nearby glass production in the 18th century, provide no evidence for serious differences between these localities. The palynological record from Lake Carwitzer See ([37]) provides information on regional vegetation development. The record represents the vegetation in a radius of approximately 50 km ([54]) and therefore covers the Kiecker forest that lies 10 km northeast of Lake Carwitzer See.
Pollen analysis was carried out on 18 peat samples from Conower Werder and 32 sediment samples from Lake Carwitzer See. Preparation ([8]) of the pollen samples (0.25 ml volume) included the addition of one Lycopodium tablet, treatment with 10% HCl, 20% KOH, sieving (120 µm), acetolysis (7 min), and HF digestion (three days in a shaker). Samples were mounted in silicone oil. Counting was carried out at 400× magnification. Samples were counted up to a minimum pollen sum of 100, with some exceptions. Pollen identification and nomenclature followed Moore et al. ([34]). Regional vegetation was reconstructed from the Carwitzer See record by using the REVEALS model to obtain land cover percentages for the taxa ([52], [55], calculated with the “REVEALSinR” function at ⇒ https://disqover.botanik.uni-greifswald.de/revealsinr/ (parameters: PPE, MV2015; distribution model: LS). The local vegetation reconstruction from the Conower Werder pollen record was carried out with the MARCO POLO model to obtain land cover percentages for the taxa, and was calculated using the MARCO POLO R-function at ⇒ https://disqover.botanik.uni-greifswald.de/revealsinr/ (reference data: Carwitzer See record; r-values: from [38]).
Archaeological finds (local scale)
Archaeological data, reflecting the prehistoric and historic settlement and potential land use of the study area, were obtained from the state archaeological survey (Untere Denkmalschutzbehörde 2016, unpublished data) and from the literature ([47]). The digital data were visualized and analysed for a landscape window of 5 × 5 km with the Kiecker forest in the centre using the QGIS package. The distribution of archaeological finds follows both functional and cultural (i.e., chronological) features.
Soils and sediments (local scale)
Soil data are available for Kiecker from an already existing soil map (from 2009 - [26]) and from numerous (n>70) point data sources (corings and soil pits) originally aiming to obtain site information for forest management ([26]). Furthermore, in the southern and central parts of Kiecker, a soil survey was performed within this study to characterize the local soil cover and to use soil morphology as a proxy for potential past soil erosion following forest clearing and agriculture ([46]). Therefore, 32 soil profiles were recorded, including the preparation of two soil catenas, each consisting of three profiles along a slope. These two catenas were investigated to characterize the local toposequences in detail. The site selection was based on the available soil mapping data, the relief structure and the presence of old tree stands. Furthermore, we paid particular attention to depressions and foot slopes, screening these sites for colluvial deposits by means of auger corings (n=20). Soil research in this area was based on the German classification standards ([48], [1]). The classification of soil types followed the international IUSS Working Group ([15]) standard. From six profiles and a total of 33 samples, soil analyses were performed on the matrix <2 mm (Tab. S1 in Supplementary material) to assist in the designation of sedimentary facies and soil horizons. For grain size analysis, samples were air dried and hand-crushed. If present, organic matter and carbonate were removed using 30% H2O2 and 10% HCl, respectively. The grain-size distribution was estimated in a laser particle size analyser using laser diffraction spectroscopy (model LA-950®, Horiba Scientific, Kyoto, Japan). CaCO3 was estimated as total inorganic carbon. It was calculated as total carbon minus total organic carbon, which was measured by elemental carbon analysis (Vario EL® analyser, Elementar Analysensysteme GmbH, Langenselbold, Germany). Soil pH was analysed potentiometrically in 0.01 M CaCl2 (soil:solution ratio = 1:5).
Archive documents (local scale)
There are some archive materials published by Enders ([6], [7]), which provide information on land use at the regional scale, but also on ownership and use of the Kiecker forest and the immediate surroundings (local scale), e.g., in 1751, the former owner Count von Schwerin sold large parts of the forest to the Mecklenburg Lord Steward von Wenderin for his glassworks. Originals that we have consulted were in the main archive of the State of Brandenburg (BLHA) documents for the whole Fürstenwerdersche Heide forest beeches and oaks on the higher parts and birches and alders (Alnus glutinosa [L.] Gaertn.) in the lower parts (BLHA, Signature 2A I HG 692) in the 19th century.
Historical maps (sub-regional scale)
For the Quillow catchment and surrounding area of the Kiecker forest, land cover data were obtained from both historic maps (for the time phases 1767, 1826, 1890, 1957, 1985) and a current topographical map (2010 - Tab. 1). The oldest reliable map was produced between 1767 and 1787 by the Count von Schmettau. These map sheets are available in rectified form and provide much information about land use at that time ([13]). The next most recent maps are the so-called “Ordnance Survey Maps”, which were produced between 1820 and 1872 ([23]), and the subsequent map of the so-called “Prussian Land Survey” (1875 to 1912 - [2]). Both the 1957 and the 1985 maps are precise topographical maps of more modern time. All maps, provided by Landesvermessung und Geobasisinformation Brandenburg, comprise scales in the range of 1:50.000 to 1:25.000. After georeferencing and digitalization of map contents, the data files were analysed using the software package ArcGIS® v. 10.6.1 (ESRI, West Redlands, CA, USA).
Tab. 1 - Land cover in the Quillow River catchment from 1767 to 2010. The changing in the total land cover generally depends on the precision of the map source. (*): For 1826 the value of total land cover is lower because of missing data in the north-western part of the region.
| Land cover | 1767 | 1826* | 1890 | 1957 | 1985 | 2010 | ||||||
|---|---|---|---|---|---|---|---|---|---|---|---|---|
| (ha) | (%) | (ha) | (%) | (ha) | (%) | (ha) | (%) | (ha) | (%) | (ha) | (%) | |
| Arable field | 8.757 | 55 | 9.897 | 68 | 12.286 | 76 | 12.455 | 77 | 12.683 | 79 | 11.594 | 72 |
| Forest | 3.907 | 25 | 2.054 | 14 | 1.343 | 8 | 1.529 | 9 | 1.568 | 10 | 1.707 | 11 |
| Grassland | 1.405 | 9 | 696 | 5 | 527 | 3 | 969 | 6 | 611 | 4 | 1.355 | 8 |
| Wet-/ Peatland | 1.050 | 7 | 1.281 | 9 | 1.225 | 8 | 391 | 2 | 349 | 2 | 436 | 3 |
| Others | 770 | 5 | 545 | 4 | 713 | 4 | 751 | 5 | 883 | 5 | 1.002 | 6 |
| Total | 15.880 | 100 | 14.473 | 100 | 16.094 | 100 | 16.095 | 100 | 16.094 | 100 | 16.094 | 100 |
Forest inventory data (local scale)
Some information on tree species can be obtained from the maps from approximately 1780, 1820 and 1880, but the information is not sufficient for a comprehensive representation. We used the 2009 biotope type mapping of the State of Brandenburg, which is available on a scale of 1:10.000 ([29]) for the most recent time. However, to obtain a clear representation of tree species at the local level as far back in time as possible, we also used the so-called forest data store (FDS) of the State of Brandenburg from 2013 ([40]); here, the data store in its basic structure is presented. The data store is designed to automatically update basic data such as the age and height of trees. We chose 120 years as a tree age limit to show the distribution of the main tree species from approximately 1880/1890 over the largest possible area (approximately 50%). To obtain enough single trees over the whole forest area, we had to limit the tree age to 120 years because even older trees are rare and so scattered that it is not possible to draw conclusions about dominant tree species. Additionally, we chose 80 years as another tree age limit to produce a map for approximately 1930 to compare it with the forestry management map from 1937. This forestry management map gives the exact distribution of the main tree species down to the level of the subdivisions (smallest forestry unit, characterized by more or less uniformly structured trees of the same age). Another forest district map with the same resolution dates to January 1st, 1979.
Results
Palynological records (regional and local scale)
The reconstructed regional vegetation (Fig. S2 in Supplementary material) was dominated by forests for the past 6000 years until approximately 450 years ago. Early (mid-Holocene) forests consisted of lime (Tilia), ash (Fraxinus excelsior L.), oak (Quercus), elm (Ulmus) and pine (Pinus). Since the understorey shrub hazel (Corylus avellana L.) shows stable proportions, at least part of the forests must have formed relatively open stands. Beech (Fagus sylvatica L.) started to invade the region in approximately 4000 cal. B.P. and was the dominant vegetation covering up to 40% of the landscape after 2200 cal. B.P. Since this time, hornbeam (Carpinus betulus L.) has also been present at 5-10%. Pine and oak maintained a presence at 5-10% as well, whereas all other tree species occurred only sparsely (Fig. 2). In approximately 6000 cal. B.P., open land vegetation covered 10% of the region consisting of some herbs and mainly wild grasses (Poaceae) that are associated with naturally open vegetation, such as reeds (Phragmites) growing on lake shores and peatlands. Only after 5500 cal. B.P., human activity was evidenced by anthropogenic indicator herb taxa (Plantago lanceolata L., Cerealia) and supported by the increase in grass proportions. Starting with low intensity in the Neolithic, human impact became stronger from approximately 3600 cal. B.P. onwards with Bronze Age settlement activities ([45]). After 2200 cal. B.P., forest cover increased until it reached pre-settlement values of approximately 1000 cal. B.P. Then, open land expanded again due to Slavic settlement and German colonization. Since 400 cal. B.P., open land cover reached its highest values of more than 50%, with a high proportion of arable fields indicated by cereal pollen. Pine became a dominant forest component either as a pioneer tree on devastated land or later as a tree planted by forestry. The cover of deciduous trees (including beech) has dramatically declined. The local forest development of Conower Werder followed general regional succession. From 5800 cal. B.P. onwards, lime dominated the forest stand, with ash, oak, elm and hazel as further components. The shift to beech dominance of more than 95% started relatively late, at only approximately 2400 cal. B.P., but took place quickly and dramatically. Most of the time, low human impact is indicated by herbs (including grasses). Only in the period between 1300 and 400 cal. B.P. (650-1550 CE) did the shares of herbs and hazel reach up to 30%, which hints at open conditions in a normally light-limited beech stand, possibly due to human influence.
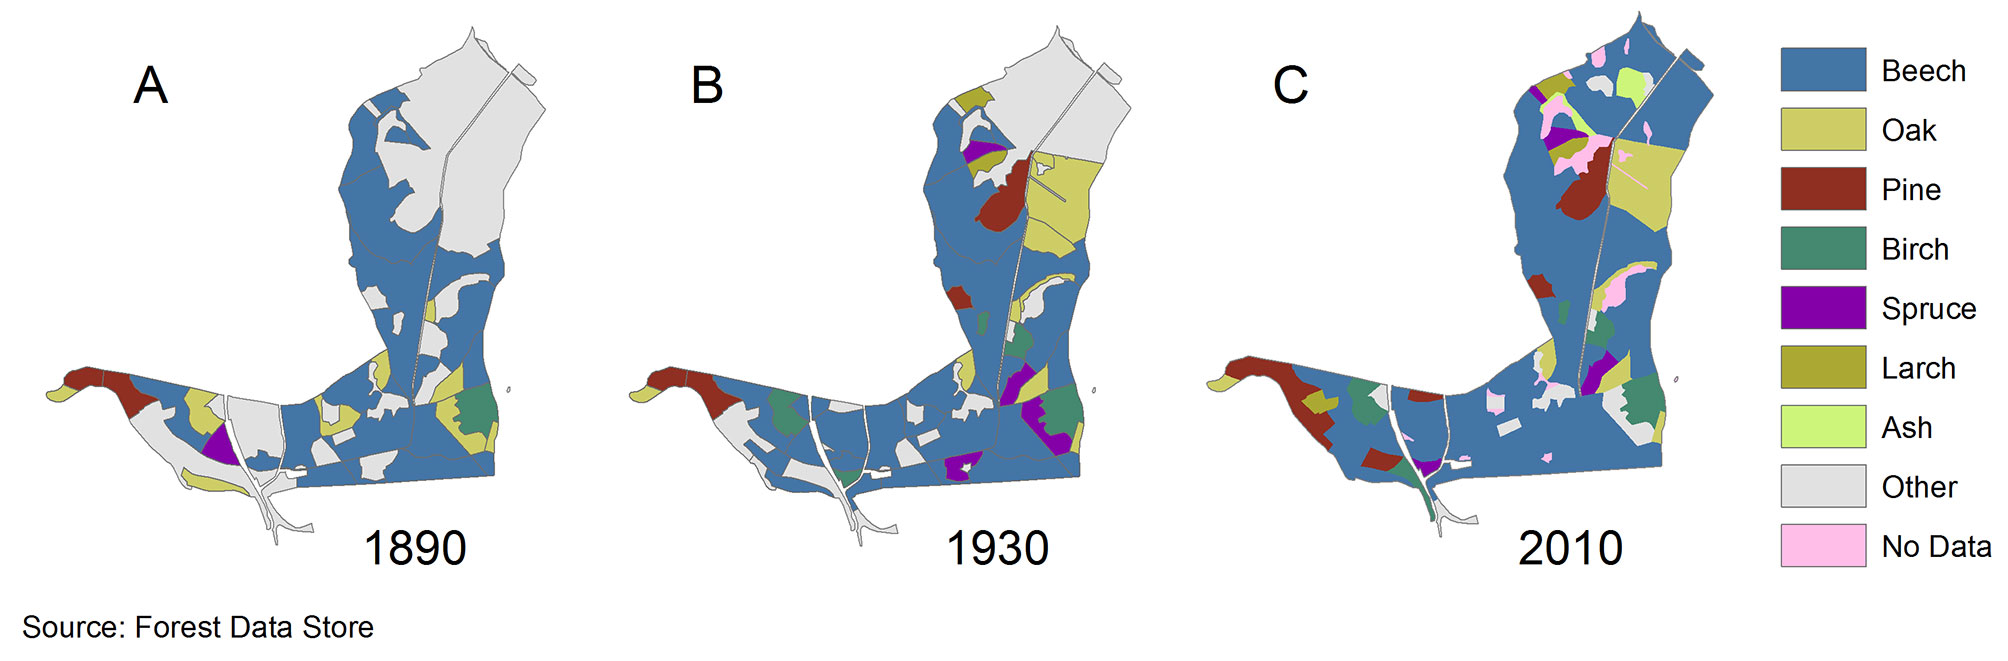
Fig. 2 - Dominant tree species and their distribution in the Kiecker forest as extracted from the Forest Data Store. (A) In 1890, (B) in 1930 and (C) in 2010.
Archaeological finds (local scale)
In addition to a few Mesolithic and Neolithic finds and settlements/burials, a rather large number of settlements and burial mounds from the Bronze Age have been recorded inside and immediately outside of Kiecker (Fig. S5 in Supplementary material). Remarkably, such burial mounds (n=25) occurred in all parts of Kiecker, certainly indicating local forest clearing and probably agricultural land use during the Bronze Age. Even in subsequent prehistoric periods (Pre-Roman Iron Age/Roman Age), the surroundings of Kiecker, at a minimum, were settled and used for agriculture and metallurgy. The first mentions of the adjacent villages of Parmen (1302 AD), Weggun (1331 AD) and Raakow (1373 AD) in the 14th century AD ([7]) indicated late medieval colonization, agriculture and further land use of the immediate surroundings of Kiecker. All the village names have a Slavic word stem, referring to an earlier settlement period, i.e., at least late Slavic (10th-13th centuries), which has been proven even for the wider surroundings ([22]). Thus, surrounded by agricultural land and villages, Kiecker was surely impacted by human activities in the last millennium to a certain extent.
Soils and sediments (local scale)
Both investigated sandy slope catenas primarily consist of glacial diamictons (till) overlaid by loamy-silty cover sands (German: “Geschiebedecksand”, “Kryosand” - [1]), which are locally underlain by glaciofluvial sand (Tab. S1 in Supplementary material). This sediment association, together with the strongly undulating relief, is typical for terminal moraine sites in the region. Dry, natural soil formation of such sites tends towards silicate weathering/browning forming Arenosols/Cambisols and towards clay illuviation forming Albic Luvisols. Even combined pedogenic processes at the same site occurred. The vegetation of both slopes consisted of old-growth beech forest, including some ca. 150- to 200-year-old tree individuals. Catena 1, with a length of 70 m and a relative height of 13 m, showed a soil profile (KIE-2) on the lower slope with a complete appearance of the expected soil horizons and related thicknesses (Albic Luvisol - Fig. S1F in Supplementary material). In contrast, both the top and the depression positions showed clear modifications of the anticipated soil morphology. A Stagnic Luvisol was formed on the top, whose potentially occurring upper horizons (Bv, Al) were widely lacking (Fig. 3, Fig. S1E). The decalcification depth of only 70 cm is considerable compared to the ca. 100-120 cm depth found in other dry-site Luvisols in the region ([24]). Both observations indicate a reduction in the profile depth by erosion of ca. 30-50 cm. In the depression, a ca. 30 cm-thick layer of silty colluvial sand covered buried soil (Colluvic Stagnosol - Fig. 4A, Fig. S1G in Supplementary material), indicating a past input of eroded sand from the slope section above. Catena 2, with a length of 90 m and a relative height of 15 m, generally showed similar soil profiles (Luvisols, Arenosols/Cambisols - Fig. 4, Fig. 5B) but lacked morphological signs of soil erosion or aggradation as described for catena 1. From a soil analytical perspective, the contents of organic carbon in the 10 to 20 cm-thick humic topsoil horizons (Ah) were rather high (up to 8% - Tab. S1 in Supplementary material), referring to a long-lasting period of organic matter enrichment by continuous forest vegetation. Correspondingly, the pH values were very low (pH 3.3-3.6), which indicated strongly acidic soil conditions caused by the long-term turnover of organic substances. Auger corings in several depressions and at footslopes around the catenas showed that only a minority of 2 of a total of 20 corings had thin sandy colluvial layers (below 10 cm each). Furthermore, small charcoal pieces in the colluvial sands indicated past wood burning.
Fig. 3 - Map of soil types and location of the two catena and soil surveys.
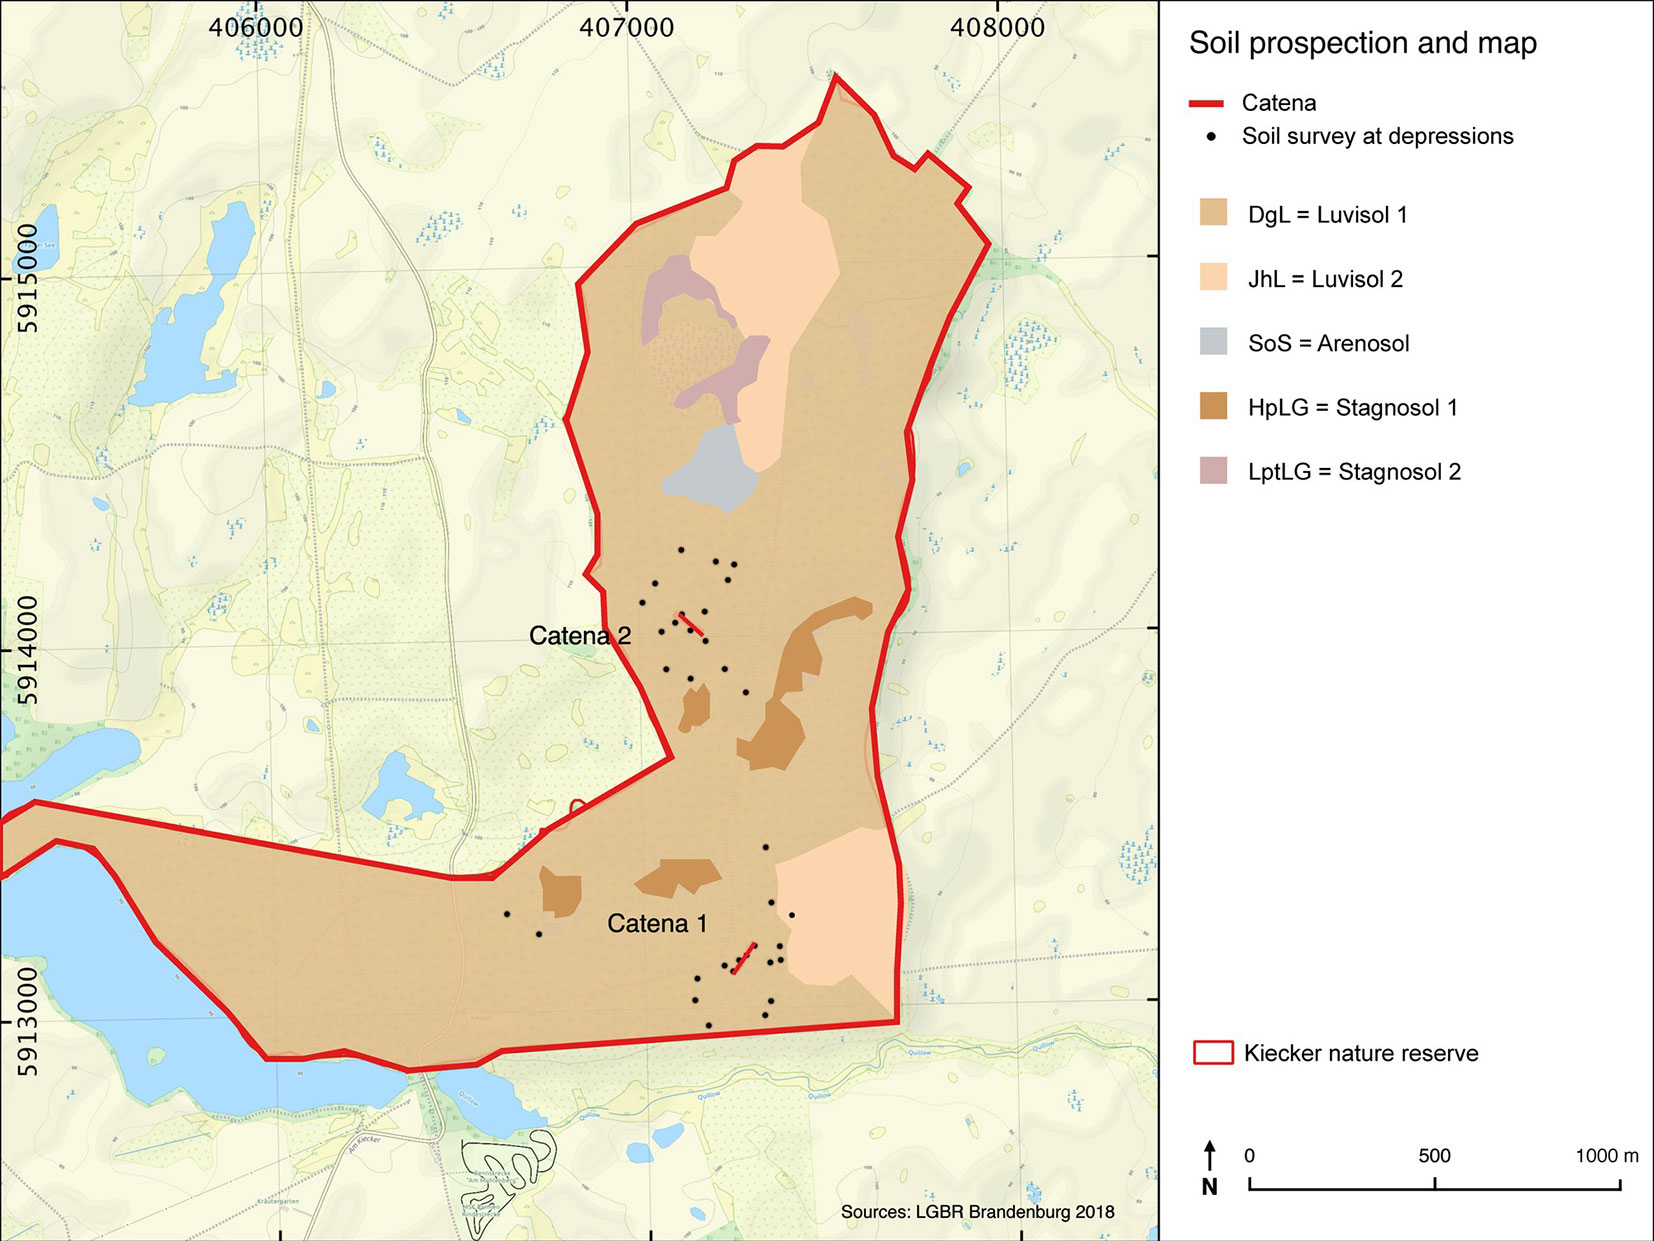
Fig. 4 - Scheme with soil profiles of (A) catena 1 and (B) catena 2.
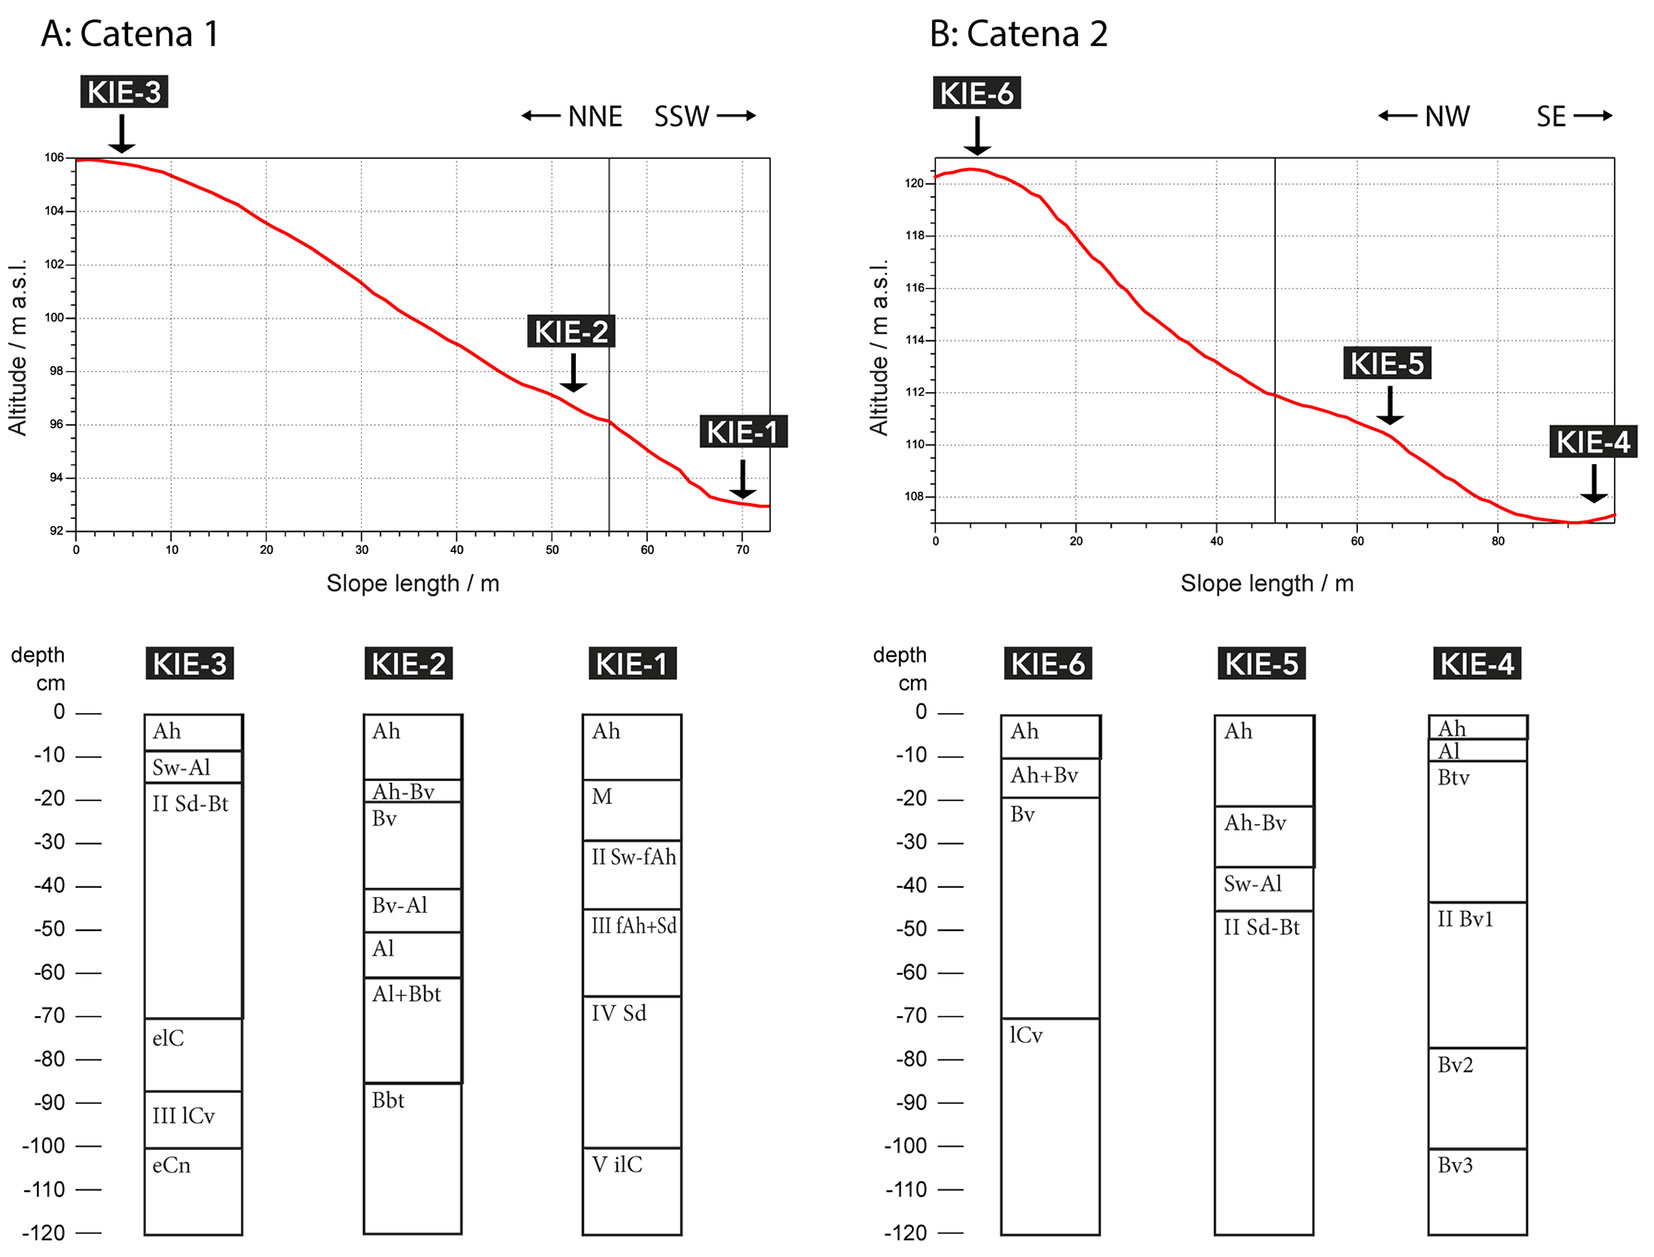
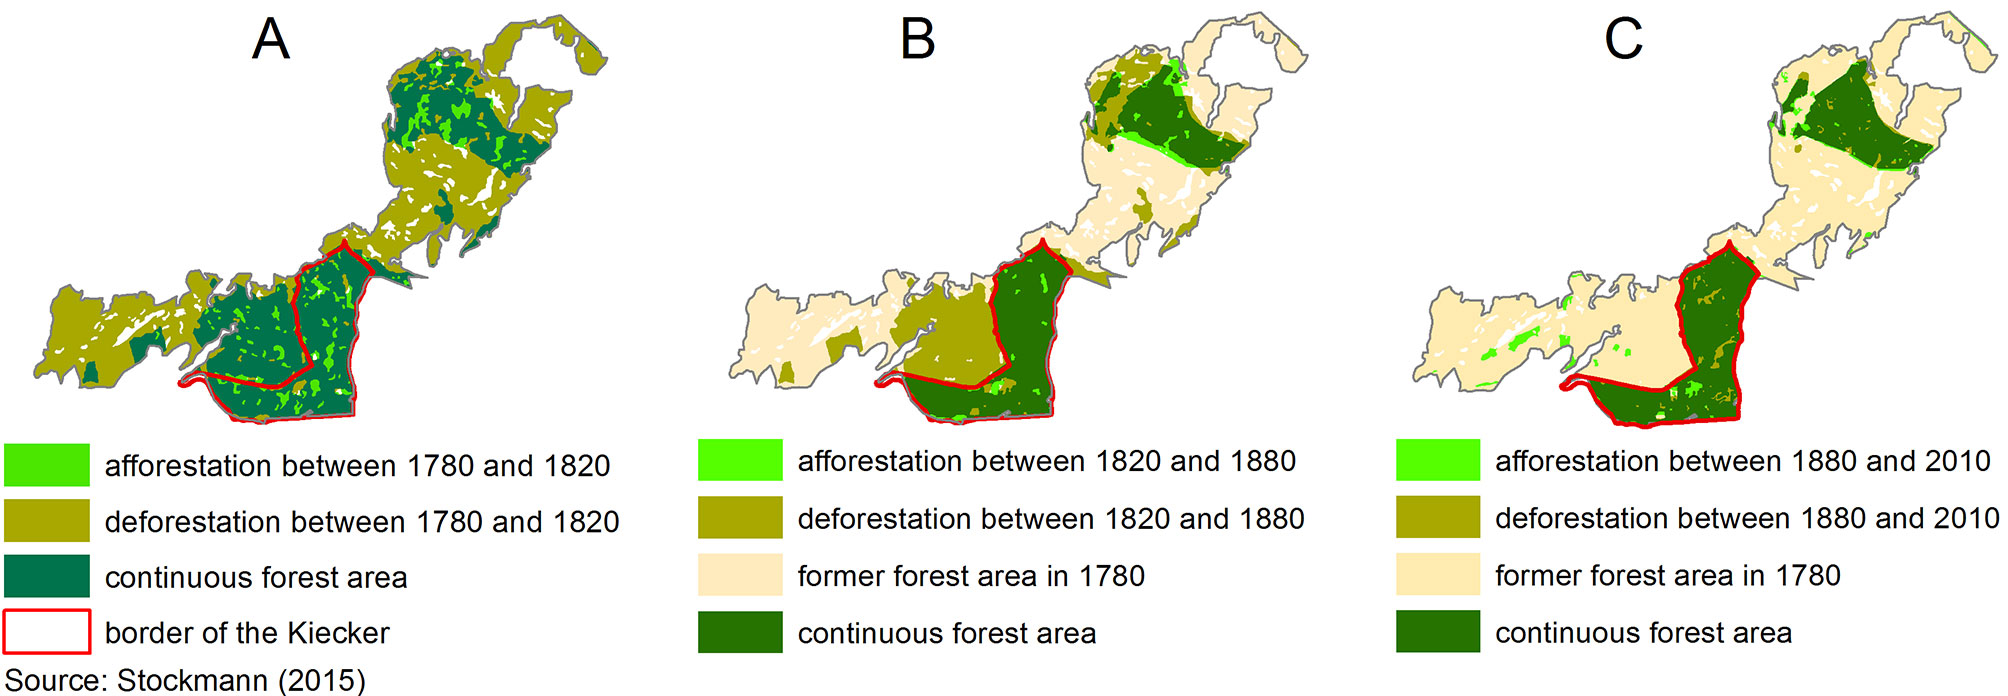
Fig. 5 - Land cover changes of the former Fürstenwerdersche Heide according to Stockmann ([51]). (A): from 1780 to 1820; (B): from 1820 to 1880; (C): from 1880 to 2010.
Historical maps (sub-regional and local scale)
The analysis of land use data obtained from cartographic sources showed a marked increase in arable land on the subregional scale (Quillow catchment) from 55% in 1767 to 68% in 1826 and to 79% in 1985. However, the Kiecker forest has remained constant in its present shape. In the same period, the forest cover decreased in the catchment from 25% to 10% (Tab. 1). Transformation into arable land particularly took place in the western part of the catchment, where a forest area intermingling with grassland was cleared at the end of the 18th century and over the course of the 19th century (Fig. S3 in Supplementary material). At the same time, the number of small settlements (usually outlying estates) and of industrial and domestic infrastructures (e.g., glassworks, tarn and charcoal kilns, roads, mills, melioration ditches) increased ([44]). As is clear from historical research, the clearings were transformed into agricultural land as part of the regional recultivation after the Thirty Years’ War in the first half of the 17th century ([6]). Before the 18th century, historical and archaeological data, as well as, to a certain extent, palaeobotanical data, allow only generalized considerations about regional land cover dynamics. Very sparsely populated during the final Paleolithic and Mesolithic ([53]), the region underwent complex cultural landscape dynamics since the early Neolithic, with the first agriculture in the eastern part of the catchment approximately 7000 years ago ([25]). All subsequent prehistoric periods are proven in the whole catchment by archaeological records ([47]), indicating agricultural economies at that time.
Since the Kiecker forest (local scale) is a remnant of the formerly much larger Fürstenwerdersche Heide forest, a brief overview of the changes in forest cover is given first. The border of the Fürstenwerdersche Heide cannot be identified on the oldest map from approximately 1780. The border was determined with the help of manor and district boundaries, as well as research results on the settlement history and descriptions of the forest area ([51]). The land cover change was presented on a precise scale (1:50.000) in three time intervals ([51]) and illustrates the dramatic decline of the former forest area (Fig. 5). Tab. 2 shows that only approximately one-third of the original forest area has been preserved, while arable fields prevail, with two-thirds of the area and grasslands cover approximately 15% of the former forest area. To illustrate the changes between 1780 and 2010 in a clearly perceptible manner, only the changes in forest cover compared to other types of land use (including arable fields, grasslands, water bodies and settlements) from 1780 to 1820, from 1820 to 1880 and from 1880 to 2010 are shown above (Fig. 5).
Tab. 2 - Change of land cover on the former area of the Fürstenwerdersche Heide forest (data from [51]).
| Land cover | 1780 | 1820 | 1880 | 2010 | ||||
|---|---|---|---|---|---|---|---|---|
| (ha) | (%) | (ha) | (%) | (ha) | (%) | (ha) | (%) | |
| Forest | 1187.2 | 90.1 | 648.8 | 49.2 | 399.7 | 30.3 | 409.9 | 31.1 |
| Arable field | 10.1 | 0.8 | 529.0 | 40.1 | 816.8 | 62.0 | 607.8 | 46.1 |
| Grassland | 117.9 | 8.9 | 116.8 | 8.9 | 48.7 | 3.7 | 199.1 | 15.1 |
| Others | 2.4 | 0.2 | 23.0 | 1.8 | 52.4 | 4.0 | 100.8 | 7.7 |
| Total | 1317.6 | 100 | 1317.6 | 100 | 1317.6 | 100 | 1317.6 | 100 |
Forest inventory data (local scale)
Data on the main tree species in approximately 1780, 1890 and 2010 for the entire Uckermark have already been published ([59]). For comparison, these data together with data for the Quillow catchment area and the Kiecker forest are shown in Tab. 3. All data for the local scale in detail refer to the actual total area of 261 ha for comparability (Tab. 4). For 1890 and 1930, only trees over 120 and 80 years of age were considered, and approximately 45% and 67% of the total area was covered by the FDS to obtain an idea of the main tree species at the two points in time. However, it became clear that beech has been the dominant tree species for at least 130 years. With information on beech wood-demanding glassworks from approximately 1750-1800 ([56], [10]), we can extend the period back 100-150 years, totalling 230 to 280 years. The FDS data for 1930 cover only approximately one-third of the area, so comparability with the 1937 map is limited. Basically, the FDS values remained below those of the map, but the relations among the tree species were very similar, with the exception of the three coniferous species (Tab. 4). A close look at the current Kiecker forest shows that the majority of the forest area is an ancient deciduous forest dominated by beech, while other main tree species are limited to comparatively small areas, except in the northernmost part of the forest (Fig. 2).
Tab. 3 - Main tree species distribution of the past and at present in the Uckermark (UM), Quillow catchment and Kiecker (empty cells = no data).
| Forest/Species | 1780 | 1890 | 2010 | ||||||
|---|---|---|---|---|---|---|---|---|---|
| UM (%) |
Quillow (%) |
Kiecker (%) |
UM (%) |
Quillow (%) |
Kiecker (%) |
UM (%) |
Quillow (%) |
Kiecker (%) |
|
| Deciduous forests | 12.4 | 10.0 | - | 3.4 | 3.2 | 41.4 | 6.9 | 3.8 | 80.4 |
| - Alder/birch | 0.8 | 0.1 | - | 0.3 | 0 | 1.6 | 2.3 | 1.1 | 10.9 |
| - Pure beech | 2.6 | 0 | - | 0.3 | 0.3 | 35.2 | 3.1 | 1.9 | 60.1 |
| - Beech/oak | 7.8 | 8.3 | - | 2.4 | 2.5 | - | 0.1 | 0.1 | - |
| - Pure oak | 1.2 | 1.6 | - | 0.4 | 0.4 | 4.6 | 1.4 | 0.7 | 9.4 |
| Mixed forests | 1.4 | 0 | - | 3.8 | 1.6 | - | 0.8 | 0.1 | - |
| - Pine/beech | 0.1 | 0 | - | 0.5 | 0 | - | 0.6 | 0.1 | - |
| - Pine/oak | 1.3 | 0 | - | 3.3 | 1.6 | - | 0.2 | <0.1 | - |
| Coniferous forests | 8.8 | 3.0 | - | 14.4 | 2.4 | 3.7 | 14.4 | 2.6 | 13.0 |
| - Pure Pine | 8.8 | 3.0 | - | 14.4 | 2.4 | 2.1 | 14.4 | 2.6 | 6.4 |
| Non-forest and other areas | 77.4 | 73.4 | - | 78.4 | 92.8 | 54.9 | 77.9 | 93.5 | 6.6 |
Tab. 4 - Main tree species in the Kiecker forest in about 1890, 1930, 1937 and 2010. Oak is Quercus robur L., with the exception of Quercus rubra L. (introduced around 1900 according to FDS data). (*): according to Geiges-Erzgräber ([11]), data derived from map of 1937; (**): remaining area of 13.8 ha belongs to non-forest area, like water bodies and small grasslands. (nd): no data.
| Species group |
Tree species |
ca.1890 | ca.1930 | ca. 1937 | ca.2010 | ||||
|---|---|---|---|---|---|---|---|---|---|
| (ha) | (%) | (ha) | (%) | (ha) | (%) | (ha) | (%) | ||
| Deciduous | Beech | 91.9 | 35.2 | 110.2 | 42.2 | 136.8 | 52.4 | 156.9 | 60.1 |
| Oak | 11.9 | 4.6 | 24.6 | 9.4 | 35.0 | 13.4 | 24.4 | 9.4 | |
| Birch | 3.8 | 1.5 | 7.6 | 2.9 | 11.4 | 4.4 | 9.8 | 6.4 | |
| Ash | 0.2 | 0.1 | 2.6 | 1.0 | 3.3 | 1.3 | 6.5 | 2.5 | |
| Hornbeam | 0.04 | 0.02 | 0.04 | 0.02 | 2.9 | 1.1 | 0.04 | 0.01 | |
| Alder | nd | - | 1.1 | 0.4 | 8.2 | 3.1 | 5.3 | 2.0 | |
| Coniferous | Pine | 5.6 | 2.1 | 11.8 | 4.5 | 22.7 | 8.7 | 16.7 | 6.4 |
| Spruce | 3.1 | 1.4 | 6.1 | 2.3 | 23.1 | 8.8 | 9.2 | 3.5 | |
| Larch | 0.5 | 0.2 | 3.7 | 1.4 | nd | - | 8.0 | 3.1 | |
| Others | - | nd | - | 6.4 | 2.4 | nd | - | 10.3 | 3.9 |
| No data | - | 143.4 | 54.9 | 87.0 | 33.3 | nd | - | 13.8** | 5.3 |
| Total | - | 117.64 | 45.1 | 174.03 | 66.7 | 243.4* | 93.3 | 261 | 100 |
Discussion
In a landscape that has been influenced by humans for thousands of years, natural ecosystems or primeval forests are not to be expected. Winter et al. ([58]) express this assumption very clearly when they state that 99% of the European landscape has lost its reference site in terms of naturalness. Nevertheless, many studies have dealt with the naturalness of ecosystems for practical application as a conservation value in itself ([41], [33]). The term naturalness seems inappropriate in view of the massive human influences, so in this study, we prefer the term reference site in the sense that the forest area is in good ecological condition. The evidence for this result comes from various scientific disciplines and consistently shows that the Kiecker forest has a long continuity as a forest site, the stocking is largely semi-natural, forestry interventions, although not excluded, have been relatively minor or date back a very long time, and ultimately natural soil development has been able to take place, as discussed in more detail below.
Land cover and land use at (sub)regional and local scales
In the late 12th and 13th centuries, German colonization of that area took place, drastically increasing the population and the land required for agriculture and thereby widely deforesting the Uckermark region, including the Quillow catchment ([6], [22], [47]). Several phases of severe economic decline (e.g., the Thirty Years’ War) and recovery followed, always accompanied by land cover changes. Currently, nearly the whole Quillow catchment is dominated by intensive industrial agriculture, which is characterized by high crop yields contrasted with serious environmental threats (e.g., eutrophication, soil erosion). At the local scale, the high number of Bronze Age burial mounds and other archaeological evidence show that at least some parts of the Kiecker forest have been cleared or drastically thinned out during prehistory (Fig. S5 in Supplementary material). This finding applies likewise for the medieval and early modern periods, when nearby villages at only 1 to 2 km distance (Parmen, Raakow, Weggun) may have used Kiecker, e.g., for timber and firewood harvesting, hunting, beekeeping and forest pasture. However, after cessation of this extensive use, dense tree vegetation recovered, resulting in the present-day beech-dominated forest.
Long-term presence of semi-natural vegetation
The postglacial vegetation development of the nearer surroundings of the Kiecker forest, derived from the pollen record of Lake Carwitzer See, corresponds very well with other records in the region ([16]). Beech started to invade forests that were composed of lime, oak, ash, elm, hazel and pine 4000 years ago. It dominated the forests for more than 2000 years. As the presence of beech has been proven in the Conower Werder since approximately 2400 cal. B.P., the forest seems to be one of the last areas where beech came in. This fact and the lack of evidence for human activity argue for natural development here. The dominance of beech at Conower Werder lasts until today (Fig. S2 in Supplementary material). Almost pure beech forests therefore represent the natural vegetation at Conower Werder. Due to the similar site conditions and history of both forests, they were most likely present for a long time in the Kiecker forest. A further hint at the long-term presence of beech is the presence of glassworks in the 18th century, which is known from archaeological and written sources for the Kiecker forest and Conower Werder ([7]). As a rule, much beech wood is needed to operate glassworks ([56]); therefore, beech occurrences from glassworks are obvious and have been proven by various studies in north-eastern Germany ([10], [7]). The rather high percentage of preserved old beech trees in the Kiecker area and the palynological evidence of a low human influence during the last 450 years at Conower Werder (Fig. S2 in Supplementary material) underline this fact, proven by historical maps that this is an ancient forest ([59]). The results from old maps (1890 and 1937) also underline the long existence of a seminatural forest (Fig. 2, Fig. S2). The Kiecker forest is not a single case. There are many similarities with the “Grumsiner Forst” located approximately 50 km southeast of the Kiecker forest, which has been in existence continuously for at least 400 years, is also dominated by beech, and probably originated largely from natural regeneration ([30]). A further example is the “Heilige Hallen” forest reserve, located approximately 15 km southwest of Kiecker. Here, beech regenerated in the late 18th century after cessation of forest use by wood extraction and pasturing ([36]).
Soils and sediments as proxies for past land use dynamics
In general, pedological research in the Quillow River catchment has shown that this area has been heavily impacted by past and present soil erosion ([49]). The oldest colluvial deposits date back to the Late Bronze Age. Most dates cluster within the last 600 years with a peak in the last 200 years, ascribing the main phase of soil erosion to the recent past ([21]). However, for the Kiecker forest, the areal soil inventory for forest management ([26]) and our local survey at catenas 1 and 2, as well as the auger corings at selected depressions, revealed a widely seminatural status of the soil cover. This finding means that the seminatural soils typical of this landscape (mostly Albic Luvisols and Arenosols/Cambisols at dry sites and Stagnosols and Gleysols/Histosols at wet sites - [49], [20]) are widely preserved, rarely showing signs of human-induced erosion and related aggradation. Thus, a spatially complete clearance of this site with very drastic change in the land cover, in the extreme case a transformation into arable land, can be excluded for the past. From this perspective, the Kiecker forest is very suitable as a reference site because it reflects the natural site conditions of a morainic landscape typical for this region. In terms of hemeroby, the soil cover of Kiecker reflects an oligo- to meso-hemerobic state ([28]).
Critical reflection on sources and methods
With a research question as local as this one, the most critical aspect is the spatially explicit allocation of the data and information used. This aspect applies to the evaluation of palynological analyses and to written and graphic archival sources for vegetation development. Palynological analyses depend on the existence of suitable archives (e.g., mire, lake, soil). If there is any archive available, it should be (i) close to the site of interest, (ii) as small as possible, and (iii) preferably untouched by drainage/desiccation. Point (i) can be complicated, as the position of existing archives might not be ideal, or the localization of an undisturbed area might require an analysis of several sites that is not feasible. In such cases, the gaps can be filled with other methods. The point (ii) requirement might limit the precision of the analyses, e.g., the deposits of a small basin of only ~30 m diameter mainly reflect the vegetation in a radius of up to several hundred metres. Smaller basins would be more precise but are very rare, and larger basins lack the needed spatial precision. In general, the basic requirement for a meaningful use of the pollen archive is an undisturbed record (point iii), i.e., the exclusion of potentially pollen-destroying drainage. Due to anthropogenic drainage, the most recent and, in this case, the most interesting deposits are particularly affected. In the case of Kiecker, most of the small glacial kettle holes were drained by ditches in the 19th/20th centuries, as has often been the case elsewhere in the region ([19]). There is no question that our study area is potentially dominated by beech forests ([14]), so it remains to be examined to what extent back in time this vegetation type can be proven. In our case, the oldest historical evidence for beech occurrence in recent times is the reference to glassworks, which consumed high quantities of calorific firewood, particularly beech. We estimated extensive stocks for profitable processing. In general, local glassworks were operated for 12 years and consumed approximately 2000 to 3000 solid cubic metres of wood per year (equivalent to 3000 to 5000 cubic metres of stacked wood), which means 20 to 30 ha of forest area per year ([56]). Even with only 10 years of glasswork operation time, 200 to 300 ha of forest area must have been present in total for exploitation. Apart from the location of the glassworks (on the original Ordnance Survey Map from 1826 the “Kleiner und Großer Glasort” shown on the north-western edge of Lake Parmener See near the village Parmen - Fig. 1C), the spatial extent of the beech forests remains uncertain. The second-oldest evidence is provided by regional historical maps, which often give relatively rough spatial information but, together with forest inventory maps, provide reliable results. In addition, the FDS allows a retrospective view of approximately 50% of the area back to approximately 1890. This source is especially reliable because the data are based on former field visits in the 1970s. However, even if beech is the dominant tree species within the forest, other native tree species such as alder, birch, hornbeam and oak can be found with several old individuals, with oak being supported by humans for the purpose of former acorn fattening and hornbeam a common accompanying tree species to oak. Forest pasture with fattening of pigs goes back until the Stone Age, so the delayed immigration of beech can also be explained by this fact ([6]).
The traces of local soil erosion and related colluviation detected in catena 1 (Fig. 4, Fig. 5A, Fig. S1E, Fig. S1G) and in two of the 20 auger drillings might have been caused by human impact, as mentioned above. However, even natural forest dynamics are capable of forming ultralocally eroded soil profiles and colluvial sediments. As both regional and supra-regional research has proven, windthrow/uprooting has to be considered an important geomorphic-pedogenic factor in old growth forests ([43]), and we also consider it for the Kiecker forest. With regard to the archaeological records on the potential prehistoric human impact on the Kiecker forest, it should be noted that there are only a few findings (burial mounds) and no findings from the forest itself. However, since the forest is relatively small, the archaeologically well-documented surroundings provide a plausible idea about the early human impact. Finally, direct (modern) human influence on the relief and soils at Kiecker is locally detectable, particularly in the form of ditches used for the drainage of kettle holes, colluvial fans poured from the surrounding fields and forest road construction.
Conclusion
Reference sites or terrestrial sites that are less affected by humans are non-renewable natural resources that must be maintained ([42]). Reference sites are necessary to carry out impact assessments of anthropogenic interventions as comprehensively as possible and are therefore an indispensable basis for the concretization of sustainable land use. Without sustainable land use, the basis for human survival is questionable, which is reflected in the formulation of soil protection laws and UN sustainability goals. The search for reference sites is thus not a purely scientific end in itself but makes an important contribution to land use that ensures the preservation of the basis of life ([42]). Our study proves the successful search for reference locations with the help of different independent sources or research approaches and the presentation of complex data/information acquisition in a clear scheme. We found direct and indirect evidence for the long-term continuity of the Kiecker forest and its seminatural tree species composition and soil development. Direct evidence in this study includes maps of different ages together with forest inventory data showing spatially explicit tree species cover data. Indirect evidence includes the rare archaeological finds in the forest area that indicate former settlement. We also assume that such an obvious phenomenon cannot be explained by gaps in research, especially since several finds have been found in the greater vicinity. Thus, we could show that it is possible to find reference sites. However, the proof requires a significant expenditure of time and staff with different expertise (Tab. 5), and for the clarification of local facts, often the inclusion of unpublished or so-called grey literature published facts, which then receive special importance.
Tab. 5 - Overview of data sources, their information and accuracy as well as accessibilities and time investment as experienced from our studies in northeastern Germany.
| Looking back | Sources | Information | Accuracy | Accessibilities | Time investment |
|---|---|---|---|---|---|
| up to 8000 yrs and more | Palynological records | Vegetation development, land use | depends on availability of archives (the closer the better) and their spatial resolution | Difficult; availability of archives, expertise for sampling and time-consuming analyses | Weeks to month |
| Archaeological finds | Historic and prehistoric land use | depends on the intensity of exploration, mostly exact locations | Moderate; data on request from monument protection authorities | Weeks | |
| Soils and sediments | Soil development, land use activities | exact location of single small spots, spatially extended by multiple spot investigation (e.g. catena, grid) | Difficult; requires at least two experts for time-consuming field work, laboratory analyses | Weeks | |
| up to 800 yrs | Archive documents (e.g. place names, title deeds, glass production) | Scattered information on diverse matters (plants, management, property) | (Rarely) high to low: sometimes vague descriptions, localization may be critical | Easy to moderate; needs research in internet, libraries and public archive | A few days to weeks |
| up to 350 yrs | Historical maps | Areal extend | High to low: mostly whole forest area, older maps may lack accuracy and resolution | Easy; reprints mostly available via public platforms of national institutions | Days to weeks for research, provision of reprints, digitisation of maps |
| up to 150 yrs | Forest inventory data | Tree stands, areal extend | High; detailed data for whole forest area, more detailed for subsections | Moderate; data only available for scientists and via official request | Weeks for provision of data, only days for data processing |
List of abbreviations
The following abbreviations have been used throughout the paper:
- AD: Anno Domini;
- Ah: humus topsoil;
- Al: Topsoil horizon from which clay particles were washed out (l: lessivated);
- BLHA: Brandenburgisches Landeshauptarchiv (main archive of the State of Brandenburg);
- Bv: Subsoil that is browned and clayey due to weathering;
- cal. B.P.: Before Present, calibrated;
- FDS: Forest Data Store;
- HL: Hydrofluoric acid;
- IUSS: International Union of Soil Science;
- LFB: Landesforstbetrieb (State Forestry Service);
- LUGV: Landesamt für Umwelt, Gesundheit und Verbraucherschutz Brandenburg (Brandenburg State Office for the Environment, Health and Consumer Protection);
- UN: United Nations;
- UNESCO: United Nations Educational, Scientific and Cultural Organization;
- WRB: World Reference Base.
Acknowledgements
The authors express their gratitude to Horst Gerke, Wilfried Hierold and Michael Sommer for stimulating discussions and to Gernot Verch for logistical support. The archaeological data for the Kiecker forest and its surroundings were kindly provided by Mathias Schulz. The soil analyses were supported by German Research Center for Geosciences and the Technical University of Berlin. Several maps were kindly provided as photos by the actual owner Detlef Graf von Schwerin and actual forester Ulrich Koch of the Kiecker forest. Our thanks also go to Ute Jahn (ZALF), who provided technical support, and to the Nature Conservation Authority of the district of Uckermark for the permission to carry out the investigations. We thank two anonymous reviewer for providing valuable advice and comments on this manuscript.
This investigation was partly financed by the State Forest Authorities of Mecklenburg-Vorpommern, Germany.
References
Gscholar
Gscholar
Gscholar
Gscholar
Gscholar
Gscholar
Gscholar
Gscholar
Gscholar
Gscholar
Gscholar
CrossRef | Gscholar
Gscholar
Gscholar
Gscholar
Gscholar
Online | Gscholar
Gscholar
Gscholar
Gscholar
Gscholar
Gscholar
CrossRef | Gscholar
Gscholar
Gscholar
CrossRef | Gscholar
Gscholar
Gscholar
Gscholar
Gscholar
Gscholar
Gscholar
Gscholar
Gscholar
Authors’ Info
Authors’ Affiliation
Research Area 2 - Land Use and Governance, Leibniz Centre for Agricultural Landscape Research - ZALF, Müncheberg (Germany)
Christoph Kappler 0000-0001-9099-1546
Oliver Bens 0000-0003-3872-0081
GFZ German Research Centre for Geosciences, Potsdam (Germany)
Institute of Botany and Landscape Ecology, University of Greifswald, Partner in the Greifswald Mire Centre, Greifswald (Germany)
Institute for Geographical Science, Free University of Berlin, Berlin (Germany)
Institute for Ecology, Technical University of Berlin, Berlin (Germany)
Institute of Earth and Environmental Science, University of Potsdam, Potsdam-Golm (Germany)
Faculty of Landscape Management and Nature Conservation, Eberswalde University for Sustainable Development, Eberswalde (Germany)
Corresponding author
Paper Info
Citation
Wulf M, Kaiser K, Mrotzek A, Geiges-Erzgräber L, Schulz L, Stockmann I, Schneider T, Kappler C, Bens O (2021). A multisource approach helps to detect a forest as a reference site in an intensively used rural landscape (Uckermark, NE Germany). iForest 14: 426-436. - doi: 10.3832/ifor3774-014
Academic Editor
Emilia Allevato
Paper history
Received: Feb 05, 2021
Accepted: Jul 18, 2021
First online: Sep 21, 2021
Publication Date: Oct 31, 2021
Publication Time: 2.17 months
Copyright Information
© SISEF - The Italian Society of Silviculture and Forest Ecology 2021
Open Access
This article is distributed under the terms of the Creative Commons Attribution-Non Commercial 4.0 International (https://creativecommons.org/licenses/by-nc/4.0/), which permits unrestricted use, distribution, and reproduction in any medium, provided you give appropriate credit to the original author(s) and the source, provide a link to the Creative Commons license, and indicate if changes were made.

Web Metrics
Breakdown by View Type
Article Usage
Total Article Views: 33499
(from publication date up to now)
Breakdown by View Type
HTML Page Views: 27522
Abstract Page Views: 2907
PDF Downloads: 2316
Citation/Reference Downloads: 5
XML Downloads: 749
Web Metrics
Days since publication: 1748
Overall contacts: 33499
Avg. contacts per week: 134.15
Article Citations
Article citations are based on data periodically collected from the Clarivate Web of Science web site
(last update: Mar 2025)
Total number of cites (since 2021): 1
Average cites per year: 0.20
Publication Metrics
by Dimensions ©
Articles citing this article
List of the papers citing this article based on CrossRef Cited-by.
Related Contents
iForest Similar Articles
Research Articles
500 years of coppice-with-standards management in Meerdaal Forest (Central Belgium)
vol. 9, pp. 509-517 (online: 17 March 2016)
Research Articles
Standing tree assessment for the maintenance of historic wooden buildings: a case study of a World Heritage site in China
vol. 6, pp. 169-174 (online: 08 May 2013)
Research Articles
Predicted occurrence of ancient coppice woodlands in the Czech Republic
vol. 10, pp. 788-795 (online: 16 September 2017)
Research Articles
Below- and above-ground biomass, structure and patterns in ancient lowland coppices
vol. 10, pp. 23-31 (online: 06 November 2016)
Research Articles
Scale dependency of the effects of landscape structure and stand age on species richness and aboveground biomass of tropical dry forests
vol. 16, pp. 234-242 (online: 23 August 2023)
Short Communications
Towards an optimal sampling effort for paternity analysis in forest trees: what do the raw numbers tell us?
vol. 5, pp. 18-25 (online: 27 February 2012)
Research Articles
Monitoring spatial and temporal pattern of Paneveggio forest (northern Italy) from 1859 to 2006
vol. 3, pp. 72-80 (online: 17 May 2010)
Research Articles
Historical and contemporary forest ecosystem changes in the Beskid Mountains (southern Poland) between 1848 and 2014
vol. 10, pp. 939-947 (online: 19 December 2017)
Research Articles
Quantitative assessment of past and future tropical forest transition and its dynamic to streamflow of the catchment, Malaysia
vol. 17, pp. 181-191 (online: 30 June 2024)
Research Articles
How do urban dwellers react to potential landscape changes in recreation areas? A case study with particular focus on the introduction of dendromass in the Hamburg Metropolitan Region
vol. 7, pp. 423-433 (online: 19 May 2014)
iForest Database Search
Search By Author
Search By Keyword
Google Scholar Search
Citing Articles
Search By Author
Search By Keywords
PubMed Search
Search By Author
Search By Keyword


