Monitoring spatial and temporal pattern of Paneveggio forest (northern Italy) from 1859 to 2006
iForest - Biogeosciences and Forestry, Volume 3, Issue 3, Pages 72-80 (2010)
doi: https://doi.org/10.3832/ifor0530-003
Published: May 17, 2010 - Copyright © 2010 SISEF
Research Articles
Abstract
This paper presents the results of a forest cover analysis over a time span of 150 years in a protected area of Eastern Trentino (Northern Italy), Paneveggio Pale di S. Martino Nature Park. With the aid of Grass GIS two historical maps (1859 and 1936) and a set of aerial photographs taken from 1945 to 2006 have been analysed, orthorectified and classified with a supervised method, in order to derive a series of forest cover maps. Techniques applied and problems encountered in using heterogeneous material are discussed. The research shows that from 1859 to the present the increase of forest cover is about 25%, due to the reduced impact of forestry and farming. Timberline dynamics have also been considered; an average growth of about 1 m/year has been estimated for the last 150 years and the data have been compared with the timberline cartography and to field surveys. Timberline estimation for recent years appears to be affected mainly by lower human pressure while the relationship with climate changes is difficult to evaluate. Landscape metrics were used to quantify the changes in forest fragmentation and to identify three core areas that have remained unchanged over time. This case study fills a gap of knowledge about the history of forest cover in the area, shows how multi temporal analysis can support protected area management. This study has been requested by the Park managers, a sign t that landscape planners are becoming aware of past landscape importance.
Keywords
Forest cover change, Timberline, Alps, Historical landscape, Landscape change, Aerial photography, Historical forestry maps, Spatial pattern, Park management, GIS
Introduction
Forest cover in the Alps in the past centuries was shaped by human activities: agriculture and timber harvesting affected the lower and intermediate elevations while farming the higher ([32]). In fact, the traditional form of farming in the Alps involved moving livestock (mainly cows and sheep) from the valleys to the higher pastures according to the season. In winter the animals were sheltered in the valleys while during the summer they were carried to higher pastures where they could exploit the seasonal abundance of food. The herdsman used to stay in the typical mountain dairy called “Malga” surrounded by natural pastures or grassland derived from forest clearance ([40]). Farming in these areas was traditionally extensive and carried out by means of local and frugal breeds.
During World War I the forests of the eastern Italian Alps were extensively exploited by the soldiers because the fighting took place on the national border which ran along the tops of the mountains in the area being investigated. Since the end of World War II land use in mountain areas has changed dramatically: as many people moved to the cities, the traditional activities were almost abandoned, and consequently the pressure that shaped the vegetation for centuries was no longer there ([14], [48], [47]). While these social issues affect the Alps as well as in the study area, their impact on vegetation distribution and composition are harder to estimate ([53], [43], [10], [15], [19]).
There are interesting studies showing that agriculture related biodiversity is highly threatened both through abandonment and intensification but, unfortunately, much of the available data concerns arable and lowland farmland, although there is a lack of knowledge in mountain areas ([33]).
The anthropic induced equilibrium between open areas and forest created an ideal habitat for some species, whose population are dependant on clearings ([9]) such as the capercaillie (Tetrao urogallus) and the black grouse (Tetrao tetrix). The loss of this equilibrium in European mountain areas is recognised as a threat to both biodiversity and to cultural landscapes ([32], [60], [55])
The problem has been fully recognised also at EU level: a recent EEA report ([16]) stresses the fact that the prevalence of high nature value farmland is in less productive areas, such as those located in southern Europe and in mountainous regions. Many relevant conservation efforts have been undertaken at a European level, such as the Pan-European biological and landscape diversity strategy, the Bern Convention, the European Landscape Convention, the Birds and Habitats Directives.
In order to understand the ecological dynamics in the Alps under changing social and climatic conditions, it is crucial to develop a knowledge of what the forest landscape was like in the past and to get a precise idea of the rapidity of the natural succession set up in the open semi-natural grassland habitats.
Multi-temporal analysis of historical maps, aerial photographs and satellite images with the aid of GIS is the best tools to reconstruct the past distribution of forest cover. The recent availability of aerial and satellite imagery and of the instruments to handle this kind of information, has proved to be an effective tool in ecological studies and has already been widely used to evaluate the forested cover change in temperate Europe ([12], [7], [18], [28], [10]). Image classification and multi-temporal analysis techniques are widely used in forestry and ecological studies ([20], [36], [31]), however each work poses different challenges, especially in mountain areas or when dealing with historical or relatively old material. Although research about landscape dynamics and land use change has been performed for a long time in different parts of the world, in the Mediterranean region similar studies are still lacking ([46]) because of the diverse topography and the millenarian human pressure on the environment, especially on forests ([43]).
This study has been carried out within the framework of the revision of the Paneveggio Pale di S. Martino Natural Park Plan, strongly inspired by Natura 2000 principles, as a tool to support decision making. The aims of this work are:
- to reconstruct the forest cover of the area of Paneveggio from 1859 to 2006;
- to quantify the change in cover and timberline;
- to analyse the changes at landscape level;
- to compare the results with field surveys.
Protected areas play a fundamental role in biodiversity conservation, and management strategies are often developed and tested within their boundaries. Therefore in those areas it is particularly important to know what the forest cover was like in the past and its changes, in order to address forest management and silviculture so as to preserve the forest ecosystem ([8]). The problems encountered in photograph processing and interpretation, as well as the limits in image supervised classification are also briefly discussed.
Study area
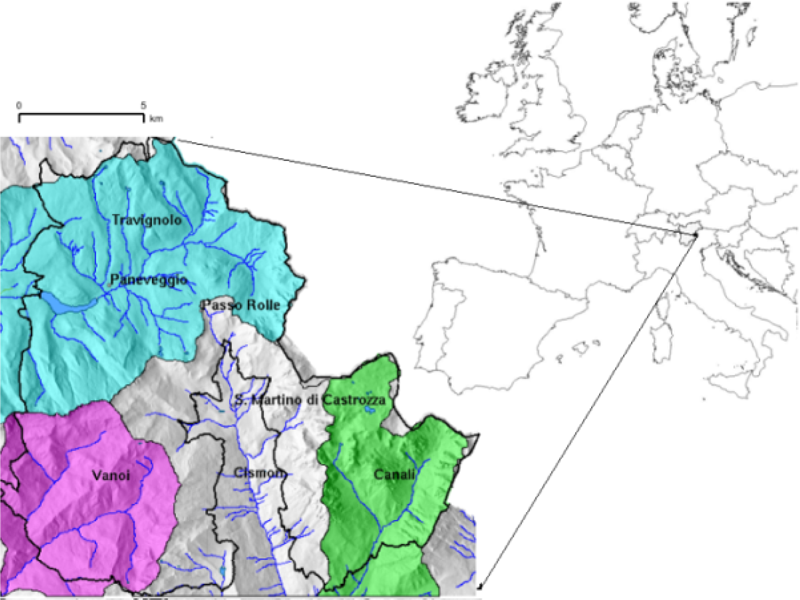
The Paneveggio-Pale di S. Martino Natural Park (194 km²), henceforth referred to as “the Park”, is located in the southern Alps, in Trentino Province, north-east Italy (Fig. 1), at about 46° N and 11° E in a very representative area of eastern Italian Alps. The Park was established in 1967 but it has actually been operating since 1987: the area has not been protected for most of the time considered in this study. The study area is a square of about 18 x 18 km centred around the Park, concerning mainly an alpine environment (elevation ranging from to 774 m to 3182 m) with a very diverse geomorphology: from the Dolomites east of the S. Martino ski resort, to porphyry rocks in the Lagorai mountains (west), to volcanic rocks in the valley of Travignolo with Lake Paneveggio (north), closed by a dam since 1953. In the area four main valleys can be identified and were analysed in this study: Cismon valley in the middle oriented NS, Canali valley in the south (bottom right of the study area), Vanoi valley (left) and Travignolo valley oriented EW, as displayed in Fig. 1. Forest composition reflects this diversity: Travignolo valley’s forest is mainly composed of spruce (Picea abies Karst) and European larch (Larix decidua Mill.) while beech is completely absent. In Cismon and Vanoi valleys the forests below 1000 m host beech (Fagus sylvatica L.) which is replaced by spruce and larch as the altitude increases. Silver fir (Abies alba Mill.) is also present, especially in Val Canali, often mixed with beech. In the study area traditional livestock farming is still practised in some mountain dairies located within and outside the Park boundaries. Many other malgas have been abandoned and the pastures around them are being invaded by forest since most of them lie below the local average timberline. A large portion (about 40%) of the study area is located above the local average timberline (1970 m according to [39]), where bare rocks and glaciers can also be found. The climate is alpine, with cold and long winters, rainy summers with about 1300 mm rainfalls per year. Temperature and rainfalls have been recorded in the province since 1921, the two meteo-stations located in the study area, at Rolle Pass (1995 m. a.s.l.) and near the village of S. Martino di Castrozza (1450 m. a.s.l.) have been marked on the map in Fig. 1. Climate records have been analysed by Bellin & Zardi ([4]), who identified a slightly rising precipitation trend, in agreement with the IPCC (Intergovernmental Panel on Climate Change - [24]), but not as evident as in other parts of Europe. Average annual temperature also shows a rising trend from 1921 to the present, mainly due the higher winter temperature ([4]).
Fig. 1 - Location of the study area around Paneveggio Natural Park (thick black line). In the enlarged area are also reported the four water basin considered in the analysis (Travignolo, Cisomon, Vanoi and Canali) in which the park is divided. The locations of the two meteo stations are marked with a black dot (Passo Rolle and S. Martino di Castrozza).
Materials and methods
Forest cover as it was in the past was derived from a set of different sources as shown in Tab. 1, including historical maps and aerial photos of the study area. The material collected allowed us to analyse a time span of 147 years, from 1859 to 2006 with a tight temporal scan: historical maps date back to 1859 and 1936, while from 1954 to 2006 six sets of aerial photos have been considered. One of the last copies of the 1936 Italian Kingdom Forestry map, unexpectedly found by one of the Authors in the national archives, allowed us to fill the century gap between 1859 and the first aerial survey, gap that is present in similar studies in other parts of the Alps ([54]). The Timberline Regional Cartography is a set of maps describing the real and potential forest cover as derived from field surveys taken between 1987 and 1990 by Piussi ([39]). In addition to cited data the Digital Terrain Model (10 m) and the base official cartography from Trento Province (1:10000) have been used for elaboration and display purposes. The coordinate reference system used here is Gauss-Boaga, west fuse with Datum Rome 40.
Tab. 1 - Summary of the material used for this work. Date of survey is reported in the column “Date”; “N” is the number of images or sections used to cover the study area; “Scale” is the average scale in case of aerial photos. All photos are black and white but the colour ortho-photos referred as “Volo IT2000” and “TerraitalyTm”.
| Name | Date | N | Scale | Media |
|---|---|---|---|---|
| Asburgic Cadastre Map | 1854-1859 | 7 | 1:10000 | Digital |
| Italian Kingdom Forestry Map | 1936 | 2 | 1:100000 | Paper map |
| G.A.I Flight | 1954 | 8 | 1:35000 | Photographic paper |
| Flight Rossi s.r.l. | 1973 | 12 | 1:10000 | Digital |
| Flight CGR “Volo Alta Quota” | 1983 | 13 | 1:10000 | Photographic paper |
| Flight CGR “Volo Italia” | 1994-1995 | 12 | 1:10000 | Digital |
| Flight CGR “Volo IT2000” | 1998-1999 | 12 | 1:10000 | Digital |
| Flight CGR “TerraitalyTm” | 2005-2006 | 12 | 1:10000 | Digital |
| Timberline Regional Cartography | 1987-1990 | 5 | 1:50000 | Paper map |
The work has been accomplished using exclusively open source software; all geographic data has been handled and processed using open source GIS: Grass versions 6.1 and 6.2 ([17]) and Quantum GIS version 0.8.0. ([41]).
Digitalisation and ortho rectification
The paper material has been digitalised with the aid of a A3 scanner with a 800 dpi resolution, chosen to guarantee a pixel resolution of about 1 m with an appropriate memory usage. Scanned aerial photos have been orthorectified using the projected DTM and a referenced map in order to obtain an image with the chosen coordinate system, compensated for relief distortions and photographic tilt. The process includes the fiducial points definition, the camera parameters definition and the identification of Ground Control Points (GCP) on the aerial image. We used about 9 reference points per image to identify the coordinates of unchanged points and the official province DTM (10m) to estimate elevation, obtaining on average a RMS of 7.5m for 1983 photos with a ground sampling distance (GSD) of 1.2, and a 13.6 m RMS with 1.7 GSD for 1954 photos. GCP identification has been time consuming, because it has been done by the operator who was searching for unchanged points from 1954. Homologous points are usually houses or roads, which are not very common items in mountain areas and not always obvious to locate in a changed landscape. The Timberline Regional Cartography needed only to be georeferenced according to the Italian reference system Gauss-Boaga, west Fuse, datum Rome 1940 as was the rest of the geographic data set.
Classification
A supervised classification was performed on the aerial photos and maps in order to detect forested and non forested land in each year of analysis. The diversity of data sources didn’t allow a classification of forest types. A semi automatic algorithm was preferred to manual digitalisation of forest boundaries because of the repeatability and higher objectivity, as in similar analysis of forest environments ([51], [10]). Moreover, the extent of the area under study and the number of images for each year were not suitable for manual analysis.
Spectral signature classification was performed on the colour digital ortho photo, with the built in tools for image classification. A region containing a forested area was outlined manually on the image, in order to calculate the signature based on the cells that are within that region. The resulting spectral signature is composed of region mean and covariance matrix and is then used to classify the whole image.
Black and white photo classification was obtained in a similar way using the single band of grey levels from 0 to 256. For each image, a rule to separate forested and unforested pixels was based in the grey level value, identified during a training session. Then each original photo was reclassified as described in Ciolli et al. ([10]) with a pixel based classification approach. The Kingdom Forestry map and the Regional Timberline map were digitalised manually as vector layers because of the neat boundaries and the relative small scale. They were then converted to raster maps for the analysis.
Forest Maps
Forest maps have been developed based on the previous classification, by mosaicing all the images of the same year together and correcting some classification errors. Misclassification of lakes and urban areas as forests occurred in the area because of the dark colour; this error can be easily fixed using the base maps of lakes and urban area as a mask. Other dark features such as areas covered by shadows, clouds or marks (in the 1954 image set there is a black mark over and around the dam, for military security), were also misclassified by the algorithm used, and only for those areas was a manual classification performed. Nevertheless some parts of the photos could still not be interpreted, and have been classified as “not detectable” and therefore excluded from the analysis. A 7 pixel modal neighbourhood filter has been applied to all the reclassified maps in order to smooth the final result.
Landscape Analysis
Landscape analysis was also performed in order to quantify the changes in landscape structure for the period examined, as forest pattern is related to ecological processes in general ([34]). In this work the analysis concerned the single class “forest” and the matrix which includes all the areas classified as “non forested” from 1954 to 2006. This analysis has been applied only to the forest maps derived from aerial photos because of the texture and scale ([13]): the even forest polygons in 1859 and 1936 maps could not be compared in a meaningful way with the forest obtained by a pixel-based classification. Landscape metrics were calculated with the module r.le, a tool for multiscale analysis of landscape structure for Grass 6.2 ([1]), whose calculations are equivalent to those performed by Fragstats ([35], [59]). Metrics about patch size, shape, texture, and edge have been selected among the many available as the most significant reported in literature ([34], [6]) and better suited to explain forest changes at landscape level with two classes ([52]). Contrast Index was also calculated because it is a measure of local variation and it is considered one of the most significant indexes for texture analysis ([2]).
Results and Discussion
Forest cover analysis
Image classification and error correction allowed the creation of a time series of high resolution raster maps (2m) showing forest cover over time, see Fig. 2 for an enlarged area. Classified maps derived from aerial photographs have been validated against a random sample of about 100 points per year and visually checked against the original images: the algorithm reclassified with an accuracy of about 90% the photos from 1954, 1984 and 1994, with 93% from 2000 (colour image) and with 86% from 1973. The different performance in classification for the 1973 set is mainly due to shot condition: the photographs were taken in autumn after a snowfall and the white soil made a strong contrast among the trees resulting in a misty pattern for the forest (Fig. 2). However the classification accuracy is regarded as satisfactory in all cases. Two shots from 1983 presented the same problem, and forest classification in Val Travignolo resulted misty even after filtering. In all the sets from the different years there were shadows cast by the mountains hiding different areas that could therefore not be detected. Fig. 3 shows that the extent of non detectable areas is more significant in the year 2000 (4%). The 2006 aerial photos were instead shot at the appropriate time of the day and have a higher (0.5 m) resolution allowing a complete intelligibility of the forest. In order to compare forest cover over time, total area must be constant, so we removed from the analysis the few undetectable zones in any year, leaving 260 km suitable for analysis.
Fig. 2 - This series presents the changes of forested area over time in a square area of 6 x 6 km located in the SE part of the study area. Green is forest cover, red undetectable, light grey unforested, black line is the park border.
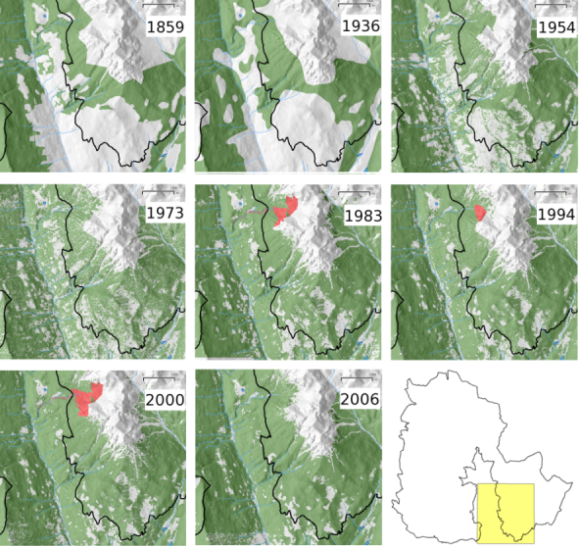
Fig. 3 - Percent of forest cover in the study area over time.
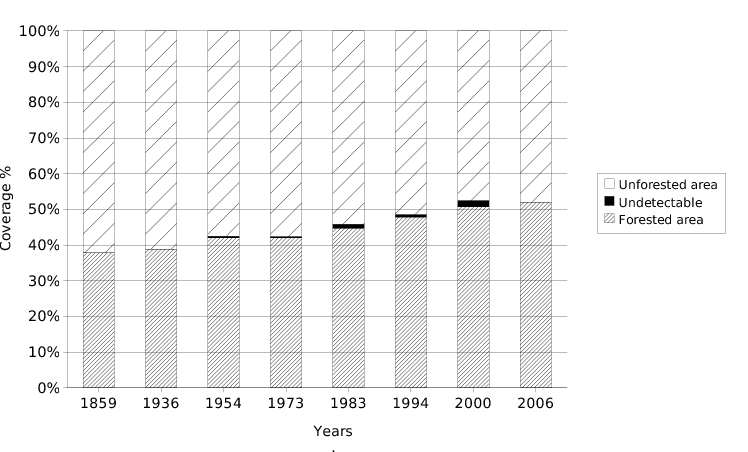
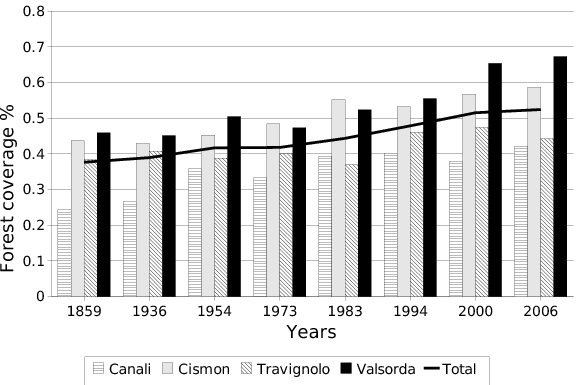
With the aid of GIS we calculated the amount of forest cover for each period: the trend has been increasing, starting from 97.9 km of woodland in 1859 (38% of the study area) to 133.9 km (52%) in 2006 (Tab. 2 - total column). The forested area in 2006 is 26% larger than in 1859, a result in accordance with similar situations over the Alps ([18], [50]). The trend shows an acceleration since 1973, which coincides with human migration to the cities and the abandonment of traditional rural activities. Forest dynamics have been evaluated within the Park boundary and outside: Tab. 2 shows that forest growth happened increasingly more rapidly outside the protected area than inside. The spatial pattern of forest growth is best appreciated on the maps (Fig. 2) where the lack of trees in the valleys until 1936 is evident. The analysis has been repeated considering each of the four watershed in the study area: the trend of forest growth follows the same pattern in all areas, but the difference in elevation leads to higher forest cover in Valsorda and Cismon rather than Canali and Travignolo (ANOVA, p-value = 0.001), as presented in Tab. 3.
Tab. 2 - Comparison between the relative forest cover (%) and the actual surface covered by forest (km) for the total study area, the area inside and the area outside Park boundaries.
| Year | Forest cover % | Forested area km | ||||
|---|---|---|---|---|---|---|
| Out of Park | Into the Park |
Total | Out of Park | Into The Park |
Total | |
| 1859 | 40.16 | 36.72 | 37.66 | 28.69 | 69.22 | 97.91 |
| 1936 | 45.46 | 36.50 | 38.96 | 32.47 | 38.97 | 101.28 |
| 1954 | 50.43 | 38.39 | 41.70 | 36.03 | 72.37 | 108.40 |
| 1973 | 52.78 | 37.65 | 41.80 | 37.70 | 70.97 | 108.67 |
| 1983 | 56.94 | 40.60 | 45.09 | 40.68 | 76.53 | 117.21 |
| 1994 | 59.38 | 43.51 | 47.87 | 42.42 | 82.01 | 124.44 |
| 2000 | 65.60 | 46.21 | 51.54 | 46.86 | 87.11 | 133.98 |
| 2006 | 67.40 | 46.18 | 52.01 | 48.15 | 87.05 | 135.20 |
Tab. 3 - Forest cover percentage in the four watershed of the study area for the period investigated.
| Year | Basin | Total | |||
|---|---|---|---|---|---|
| Canali | Cismon | Travignolo | Valsorda | ||
| 1859 | 24.37 | 43.73 | 38.41 | 45.93 | 37.66 |
| 1936 | 26.61 | 42.93 | 40.78 | 45.14 | 38.96 |
| 1954 | 35.81 | 45.26 | 38.82 | 50.49 | 41.7 |
| 1973 | 33.32 | 48.41 | 39.99 | 47.34 | 41.8 |
| 1983 | 39.37 | 55.19 | 37.00 | 52.36 | 44.36 |
| 1994 | 40.19 | 53.23 | 46.01 | 55.48 | 47.87 |
| 2000 | 38.00 | 56.68 | 47.39 | 65.38 | 51.54 |
| 2006 | 42.18 | 58.61 | 44.23 | 67.32 | 52.43 |
The comparisons between areas inside and outside the park’s boundaries show that the presence of a protected area has no influence on forest re-colonisation: the speed of ecological processes in this case seems to be affected more by the morphology and the social changes than by the establishment of a protected area. This outcome is also affected by the fact that tree growth is faster at lower elevations than near the timberline, where the Park is mainly located. The area outside the Park includes valleys and medium elevation slopes, where forest ecosystems reacted more promptly when exploitation for agriculture, farming and timber harvesting ceased around 1950. The forest expansion observed here has a similar pattern in other mountain areas across Europe that underwent analogous social and land use changes ([32], [16], [18], [29], [54]). This thesis is also supported by the analysis in the different watershed that showed negligible differences in recolonisation trends despite the different exposition and environmental features of the four valleys (Fig. 4). This explains how forest re-colonisation is greater outside the protected area.
Fig. 4 - Comparison among relative forest cover in the four water basins and the whole study area.
Timberline analysis
Analysis of the forest edge at a higher elevation was also performed on the dataset and compared with field data. The study area above 1700 m was divided into 13 altimetric belts of variable heights: one belt from 1700m to 1900m, 11 belts of 20 m each up to 2120 m, the last belt from 2120 m to the tops. The belts have been designed to allow a comparison with Piussi’s field survey carried out in the late the 1980s ([39]).
For each belt, tree cover was calculated, and if greater than 30% of the total area, the belt is considered covered by forest. The 30% threshold was chosen in order to be coherent with the same value adopted by Piussi ([39]) so the results can be compared. The timberline in each year is estimated to occur in the belt where the forest cover is close to that 30% cover value: the elevation of the timberline increases over time as reported in Tab. 4. By dividing the estimated rise by the number of years we estimated an increase of 0.6 m/year of the timberline for the whole period, and of 1.3 m/year if counting only the aerial photo data from 1954 to 2006. The reduced grazing activities can explain this trend: from 1950 to 2005 the surface of pastures used around the mountain dairies of the areas shrank from 4200 ha to 2200 ha and the number of cattle from 2010 to 1350 units (Forest and Wildlife Office of Trento, unpublished).
Tab. 4 - Timberline in different years is estimated in the belt where the forest cover is about 30%.
| Year | Timberline belt |
|---|---|
| 1859 | 2000-2020 |
| 1936 | 2000-2020 |
| 1954 | 2020-2040 |
| 1973 | 2040-2060 |
| 1983 | 2040-2060 |
| 1994 | 2060-2080 |
| 2000 | 2080-2100 |
| 2006 | 2080-2100 |
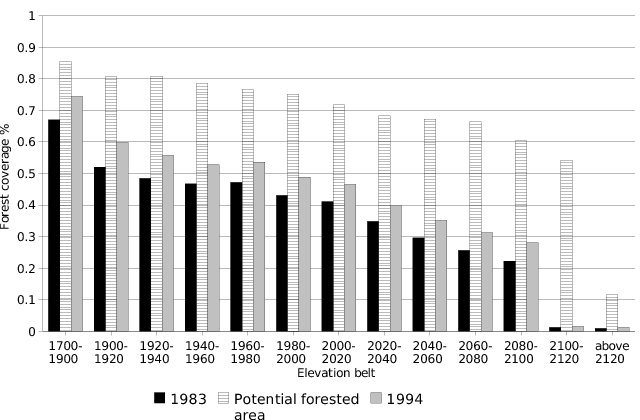
This result was compared to the Timberline Regional Cartography, taken as an independent data set because it was drawn from field surveys above 1700 m, without using aerial imagery ([39]). In this map four cover classes are reported: “forest”; “beyond limits”, i.e., areas above isolated trees; “potential”, i.e., areas that can be colonised by trees in the future and “excluded potential”, i.e., areas that cannot be colonised by trees because of various limiting factors (rocks, slope, etc.) even if the elevation is suitable. A raster version of this map was processed using the same elevation belts prepared for the timberline analysis in order to compare the vegetation cover estimated from the aerial photos taken a few years before (1983) and after (1994) Piussi’s survey. Fig. 5 shows a comparison between forest cover per altimetric belt: below 1960 and above 2100 m there is good agreement with the forest estimated by field survey, while between the 1960 and 2100 m belts the photo interpreted forest is greater than that. This can probably be due to the fact that Piussi did not consider the mountain pine cover (Pinus mugo mugo) as belonging to forest class, while it is classified as forest in photo interpretation. Forest cover estimated with photo interpretation is in good agreement with the Timberline Regional Cartography, being always between forest class and potential class (see Fig. 5 and Fig. 6). Some areas, classified as potential by Piussi, could have been occupied by young trees at the time of his survey but classified as forests by the algorithm as this does not take into account the trees’ height. Field measurements, taken in summer 2005 in the south east of the study area ([11]), confirm forest occurrence with trees older than 20 years above 1960 m and support the use of image interpretation for timberline estimation. Photo interpreted forest cover is always lower than the potential, meaning that at this elevation forest colonisation is far from achieving its theoretical potential.
Fig. 5 - Comparison between forest cover estimated in the analysis and those measured in the fields by Piussi ([39]).
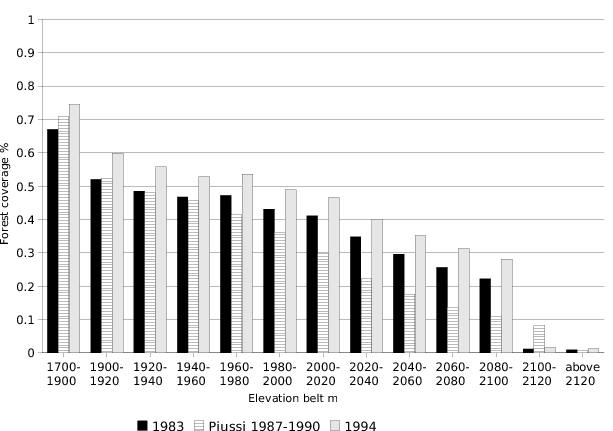
Fig. 6 - Comparison between forest cover estimated in the analysis and the potential cover proposed by Piussi ([39]).
Landscape analysis
Landscape analysis was performed on forest maps derived from aerial photos, allowing us the quantification of landscape changes in forest between 1954 and 2000 at a spatial resolution of 10 m. Tab. 5 shows the metrics calculated for 10 m grid resolution, the metrics have been computed also at 100 m grid size, but there were no differences except for the area metrics, which are affected by pixel size. Patch number, Patch size and its Standard Deviation, though not spatially explicit metrics, can give an overview of the changes that have occurred: the number of forested patches decreases while average and maximum patch area increases over time, meaning that marginal patches merge together in bigger forests thus creating a more continuous landscape (see also Fig. 2). Sum of edges is a measure of ecotones between forest and other environments and reflects the complexity of patch shape: from 1954 to 2006 this metric decreases, indicating that forested areas are more compact and have a more linear perimeter. Whereas the reduced anthropic pressure allowed an increase of forest cover to the detriment of agricultural land, on the other hand, the reduction and disappearance of clearings and ecotone margins can affect wildlife and plant species diversity ([30], [26]).
Tab. 5 - Landscape metrics calculated on photo derived forest maps.
| Landscape metrics | 1954 | 1973 | 1983 | 1994 | 2000 | 2006 |
|---|---|---|---|---|---|---|
| Patch Number | 10181 | 8048 | 8528 | 7806 | 5862 | 3936 |
| Mean Patch size ha | 11.02 | 13.94 | 17.95 | 16.37 | 23.09 | 35.6 |
| S.D. Patch Size ha | 58.93 | 69.65 | 69.85 | 79.25 | 96.36 | 160.6 |
| Max. patch Size ha | 4045.22 | 4251.52 | 5290.06 | 4944.57 | 5188.72 | 5122.05 |
| Sum of edges km | 5384.34 | 7751.49 | 4264.18 | 4672.59 | 3397.85 | 2860.31 |
| Contrast Index | 0.08 | 0.12 | 0.07 | 0.07 | 0.06 | 0.05 |
Contrast Index which was calculated in an 8 cell neighbourhood resulted almost constant in both cases of different grid sizes: local variation at these scales did not change over time, meaning that forested areas had a thick cover and were neatly separated from unforested areas in all the years considered. Landscape analysis enhanced the difference in classification accuracy concerning 1973 data, a slightly different trend is detectable in all the calculated metrics especially Sum of Edges and Contrast Index and this is a consequence of the discussed different shot condition of the original material. Even if this data confirms the general trend in all the aspects considered, caution must be adopted when performing landscape analysis on low contrast images. Landscape metrics have been used as an attribute to reclassify forest maps in order to display landscape changes spatially: three forest patches whose area is greater than the average patch size can be identified. These core areas persisted during the whole time span considered, increasing their size and making the landscape more homogeneous. From this analysis it is possible to assert that forest colonisation followed a dynamic of enlargement and merging of existing patches, filling the open gaps abandoned by human activities rather than forming new expansion kernels.
Conclusions
Forest changes from mid 1800 to 2006 in the Park area have been estimated and analysed with GIS tools using historical maps and aerial photographs and developing forest maps over a 150 year timespan. The good quality of the original material together with the tight temporal scan allowed us to observe how the change progressed over time and to trace a detailed development of what happened from 1859 to the present. Supervised classification of original material was performed to identify forested areas in different periods; the resulting maps were corrected and validated, presenting an average accuracy of 90%. The forest cover maps obtained for every year was used as a data source to develop the study of forest changes in cover and structure over time. During the period examined, the social and economical situation of the area changed dramatically, with visible consequences on the landscape. The trees have been able to recolonise the areas that were no longer used for farming and timber harvesting thus increasing by approximately 26% the forest cover. The spatial pattern of forest recovery can be seen in Fig. 2, which shows the rapid colonisation of the valley floor and the mid-elevation pastures leading to a more continuous and homogeneous forest cover.
Forest expansion occurred also around the timberline, which rose by about 1.3 m/year from 1954 to the present. The timberline estimated in 1983 and 1994 could be compared with the 1992 field survey reported on the Timberline Regional Cartography: forested areas evaluated with photo interpretation overlap with the samples on the field or with the land defined as potential. The increase of forest surface and the rise of timberline issued from this work share similar trends with other parts of the Alps ([40], [32], [58]). The relationships between the rise of the timberline and climate changes remains an open issue here and elsewhere in the Alps ([21]). The quality of the results and the comparison with field surveys allowed us to quantify the changes in landscape, timberline and landscape pattern for more than a century and confirm the validity of photo interpretation in analogous situations.
The results obtained will give the possibility to monitor the future landscape changes whilst taking into account the past forest landscape of the area, thus adding an important interpretation key both within and outside the Park boundaries. As assessed by Turner and Kintz, parks and reserves established to preserve and conserve biodiversity have drawn special attention in regard to the land dynamics in which they exist and much research demonstrates that land practices, pressures, and changes outside the reserve affect the biota within it ([56], [27]).
Landscape analysis allowed us to clarify the spatial dynamics of forest colonisation: forested areas once isolated and separated, have enlarged around their edges and merged in the continuous landscape that can now be observed, resulting in a progressive loss of ecotones whose presence is important for wildlife.
The detection of three main core areas has highlighted the need to plan carefully the future interventions in those areas in order to decide on the future of the landscape and the forest environment of the park.
As expected, the hypothesis that the present work could be useful to support decision making for the Park has been confirmed, and the results of this study have been taken into account when defining management guidelines in the Park Plan, which is currently in an advanced phase of revision. In particular this work has been used:
- to help define the landscape units that are the basis for the Park zoning;
- to quantify the amount of forest colonisation around each Malga so as to guide the planning and management of abandoned pastures in order to decide which among them is worth recovering taking into account not only the ecological characteristics of each pasture but also the neighbouring landscape;
- as a basis for the wildlife plan, since species are particularly influenced by landscape mosaic composition at a very detailed scale ([45], [38]).
Another interesting result of this work is that the visual approach that comes out in printed maps expressing the multi temporal landscape changes can be very useful also to support a participative approach during the planning process. The dramatic quantitative and qualitative changes of forest cover and landscape fragmentation can be far more understandable from a series of maps than using numerical tables, and this was particularly important at those times when public opinion and stakeholders were involved such as during the interviews carried out with the farmers. Our experience confirms the statement reported by Hanley et al. ([23]) that the knowledge of the past have an impact on preferences for future landscapes. Further development of this work include the opportunity to produce scenarios which are being today considered increasingly important in order to carry out an effective participative approach ([25], [49], [42], [5]).
Quantification and localisation of a simplified forest mosaic in the past years are objective basic elements to address for future planning in order to preserve a minimum landscape diversity that can sustain local wildlife and plant diversity ([37]) and to reduce the existing uncertainty ([22]). Monitoring historical data is a prerequisite for understanding processes and is essential for modelling ([3], [44], [57]) as well as for supporting land use planning and management. The fact that the managers of Paneveggio Park requested a multi temporal analysis is the demonstration that planners are becoming aware of the importance of this information. The results brought new insights on the forest dynamics and supported the managers in the accomplishment of the planning process.
Acknowledgements
This research was funded by the Paneveggio Pale di S. Martino Natural Park and developed within the framework of the Park plan revision. The authors wish to thank: Bruno Zanon from the University of Trento, coordinator of the plan revision; Ettore Sartori, the Park’s director, who believed in the importance of historical information in actual planning; Gino Taufer from the park staff for his valuable help and Nick Vilday for English proofreading.
The Italian Kingdom Forestry Map from 1936 has been kindly provided in the framework of the agreement between CRA-MPF (Agricultural Research Council, Forest Monitoring and Planning Research Unit) and MIPAF-CFS (Ministero delle Politiche Agricole e Forestali and Corpo Forestale dello Stato).
References
Gscholar
Gscholar
Gscholar
Gscholar
Gscholar
Gscholar
Gscholar
Gscholar
Gscholar
Gscholar
Gscholar
Gscholar
Gscholar
Gscholar
Gscholar
Gscholar
Gscholar
Gscholar
Gscholar
CrossRef | Gscholar
Gscholar
Gscholar
Authors’ Info
Authors’ Affiliation
M Ciolli
MG Cantiani
Laboratorio di Ecologia, Dipartimento di Ingegneria Civile e Ambientale, Università degli Studi di Trento, v. Mesiano 77, I-38123 Trento (Italy)
Unità di ricerca per la Gestione dei Sistemi Forestali dell’Appennino, CRA, v. Bellini 8, I-86170 Isernia (Italy)
Corresponding author
Paper Info
Citation
Tattoni C, Ciolli M, Ferretti F, Cantiani MG (2010). Monitoring spatial and temporal pattern of Paneveggio forest (northern Italy) from 1859 to 2006. iForest 3: 72-80. - doi: 10.3832/ifor0530-003
Paper history
Received: Nov 24, 2009
Accepted: Feb 05, 2010
First online: May 17, 2010
Publication Date: May 17, 2010
Publication Time: 3.37 months
Copyright Information
© SISEF - The Italian Society of Silviculture and Forest Ecology 2010
Open Access
This article is distributed under the terms of the Creative Commons Attribution-Non Commercial 4.0 International (https://creativecommons.org/licenses/by-nc/4.0/), which permits unrestricted use, distribution, and reproduction in any medium, provided you give appropriate credit to the original author(s) and the source, provide a link to the Creative Commons license, and indicate if changes were made.

Web Metrics
Breakdown by View Type
Article Usage
Total Article Views: 64484
(from publication date up to now)
Breakdown by View Type
HTML Page Views: 54218
Abstract Page Views: 4385
PDF Downloads: 4780
Citation/Reference Downloads: 37
XML Downloads: 1064
Web Metrics
Days since publication: 5922
Overall contacts: 64484
Avg. contacts per week: 76.22
Article Citations
Article citations are based on data periodically collected from the Clarivate Web of Science web site
(last update: Jul 2026)
Total number of cites (since 2010): 43
Average cites per year: 2.53
Publication Metrics
by Dimensions ©
Articles citing this article
List of the papers citing this article based on CrossRef Cited-by.
Related Contents
iForest Similar Articles
Research Articles
Historical and contemporary forest ecosystem changes in the Beskid Mountains (southern Poland) between 1848 and 2014
vol. 10, pp. 939-947 (online: 19 December 2017)
Research Articles
Historical fire ecology and its effect on vegetation dynamics of the Lagunas de Montebello National Park, Chiapas, México
vol. 14, pp. 548-559 (online: 01 December 2021)
Short Communications
The Polish landscape changing due to forest policy and forest management
vol. 2, pp. 140-142 (online: 30 July 2009)
Research Articles
A multisource approach helps to detect a forest as a reference site in an intensively used rural landscape (Uckermark, NE Germany)
vol. 14, pp. 426-436 (online: 21 September 2021)
Short Communications
Estimation of canopy attributes of wild cacao trees using digital cover photography and machine learning algorithms
vol. 14, pp. 517-521 (online: 17 November 2021)
Research Articles
The estimation of canopy attributes from digital cover photography by two different image analysis methods
vol. 7, pp. 255-259 (online: 26 March 2014)
Research Articles
Communicating spatial planning decisions at the landscape and farm level with landscape visualization
vol. 7, pp. 434-442 (online: 19 May 2014)
Research Articles
Evaluation of urban forest landscape health: a case study of the Nanguo Peach Garden, China
vol. 13, pp. 175-184 (online: 02 May 2020)
Research Articles
Scale dependency of the effects of landscape structure and stand age on species richness and aboveground biomass of tropical dry forests
vol. 16, pp. 234-242 (online: 23 August 2023)
Review Papers
Large-scale effects of forest management in Mediterranean landscapes of Europe
vol. 6, pp. 342-346 (online: 29 August 2013)
iForest Database Search
Search By Author
Search By Keyword
Google Scholar Search
Citing Articles
Search By Author
Search By Keywords
PubMed Search
Search By Author
Search By Keyword


