Method for the analysis of the relationship between forest cover and streamflow in watersheds
iForest - Biogeosciences and Forestry, Volume 14, Issue 4, Pages 344-352 (2021)
doi: https://doi.org/10.3832/ifor3536-014
Published: Jul 21, 2021 - Copyright © 2021 SISEF
Research Articles
Abstract
The relationship between forest cover and streamflow of watersheds is complex and still controversial in the scientific literature. To investigate suchrelationship we propose an alternative method which requires the following information for each watershed: percentage of forest cover, annual rainfall, average specific streamflow (qave), and minimum mean specific streamflow in seven consecutive days (q7). As a case study, we analyzed a dataset composed by 25 watersheds located in the Espírito Santo State (ESS), Brazil. We conducted simple and multiple linear regression analyses as well as partial correlation analysis between the above parameters. To reduce the effect of heterogeneity of environmental factors, watersheds with similar characteristics in term of rainfall, drainage area, and both rainfall and drainage area were grouped by cluster analysis, and the above regression and correlation analysis was repeated on each group. Our results using the whole dataset showed that forest cover has a negative relationship with watershed streamflow. The analysis of homogeneous groups of watersheds showed that the average minimum streamflow during seven days (q7) was more sensitive to the presence of forest cover, showing a negative relationship, especially in watersheds with low annual rainfall, while in areas with high precipitation, the annual rainfall showed a strong influence on the hydrological responses of watersheds, masking the effect of forest cover. The proposed method may be easily extended to other areas, and allowsthe inclusion of other relevant environmental variables according to specific cases.
Keywords
Forests, Cluster Analysis, Water Regime, Land Use, Watershed Management
Introduction
Land-use intensity is a relevant factor of land cover change, which is leading many developing countries to experience the depletion of natural resources ([6]). The ecological and economic utilization of water resources has become one of the most challenging topics for the society ([15]). The increasing water scarcity around the world led to improve the strategies aimed to its mitigation ([44]), though ensuring water security is still a major global challenge. Water scarcity is prevalent in many regions of the world and it is expected to increase in the upcoming years due to population growth, climate change, and land cover changes ([20]).
The ecological and hydrological imbalances caused by land-use changes in watersheds are widely recognized in the scientific community ([20], [14], [33], [36]). However, the influence of forest cover on streamflow at watershed scale is still controversial, as the former has been reported to affect the latter both positively and negatively, depending on the study ([25], [4], [50], [22], [31], [39]). This is due to the complexity of their relationship, which involve many environmental variables, so that each watershed can show unique hydrological characteristics, according to local environmental conditions ([4]).
Considering the above-mentioned uncertainties, studies that investigate the effects of forests on hydrological streamflows are necessary. So far, these studies have been generally carried out using paired experimental watersheds or long-term time-trends. Paired studies focus on two watersheds that are close and similar in terms of environmental, physical, and climatic aspects. Most of the experiments (e.g., the implementation of forest management practices) are implemented in one of the watersheds, while the other is kept as control ([8]). This approach is generally adopted in watersheds smaller than 100 km2 ([50]). Conversely, time-trend studies are usually based on historical series data and include theories of evapotranspiration and energy balance, hydrologic modeling, or a combination of hydrographs and statistical analysis. These strategies are well-accepted for large watersheds, especially when environmental and hydrologic data are limited ([24], [50]).
A significant portion of the current knowledge on the hydrological response of streamflows to forest management comes from studies relyingon the above consolidated methods, which have been conducted worldwide ([25], [49], [4], [8], [32], [50], [6]). On the other hand, several criticisms regarding the use of these methods have been claimed in the literature. The experimental watersheds are criticized mainly for their high cost, lack of representativeness, and difficulty to transfer the results todifferent areas. Time-trend studies are also challenged because of the lack of a calibration period and a climate control in order to disentangle the effects of vegetation on the water balance from the effects of climate ([24], [32]).
Studies that correlate forest cover with streamflow have been conducted in monitored watersheds for several years, where hydrological data are obtained before and after the forest management ([8]), or through analysis of historical data sets. The main disadvantage of this approach is related to the need of monitoring forest cover, rainfall, and streamflow over several years, and to the damages caused by forest suppression. Therefore, new approaches are needed to investigate such relationships in order to provide a deeper knowledge in watershed science and support environmental stewardship.
In this study, we propose an alternative methodology based on simple statistics where neither forest suppression nor the manipulation of large volumes of historical data is required. Both rainfall and watershed size are included as influencing factors in the hydrological response. Several watersheds are used to improve regional representativeness and allow the simultaneous analysis of large areas in different regions. The low cost and easy applicability of this method can mainly benefit regions with a lack of resources to implement paired watershed experiments. Additionally, this approach is also beneficial to regions where the development of long-term continuous monitoring of hydrological and forestry variables is challenging.
To test the proposed methodology, we conducted our study in Southeastern Brazil, which is historically affected by strong regional differences in the volume of available water and has experienced worrying drought periods and water scarcity in recent years ([18]). According to the National Water Agency of Brazil ([2]), the drought affected 48 million people in Brazil from 2013 to 2016. In 2014, the Southeastern region, which is the most populated in the country, faced the highest drought of the 21st century, causing a water supply crisis. On the other hand, in 2018 the drought was less intense, causing an increment in the water reservoirs. However, the total rainfall after that year remained lower than expected ([16]).
The unprecedented drought in Brazil may be a direct consequence of inflow depletion from the Amazon watershed, which normally brings rainfall to Midwest and Southeastern Brazil ([28], [5]). Despite this, Brazil has the largest amount of fresh water on the planet ([40]). These facts bring up discussions about the management of water resources and the need of a deeper knowledge on the influence of environmental variables on fresh water supply.
In this study, we focused on the relationship between streamflow and forest cover using environmental and empirical hydrological data from governmental agencies. The main goal was to test a new method to efficiently determine the correlation between forest cover and streamflow in watersheds and its application to other regions. We finally propose the adopted methodologyas a viable alternative to long years of watershed monitoring data or suppression management.
Material and methods
Rationale
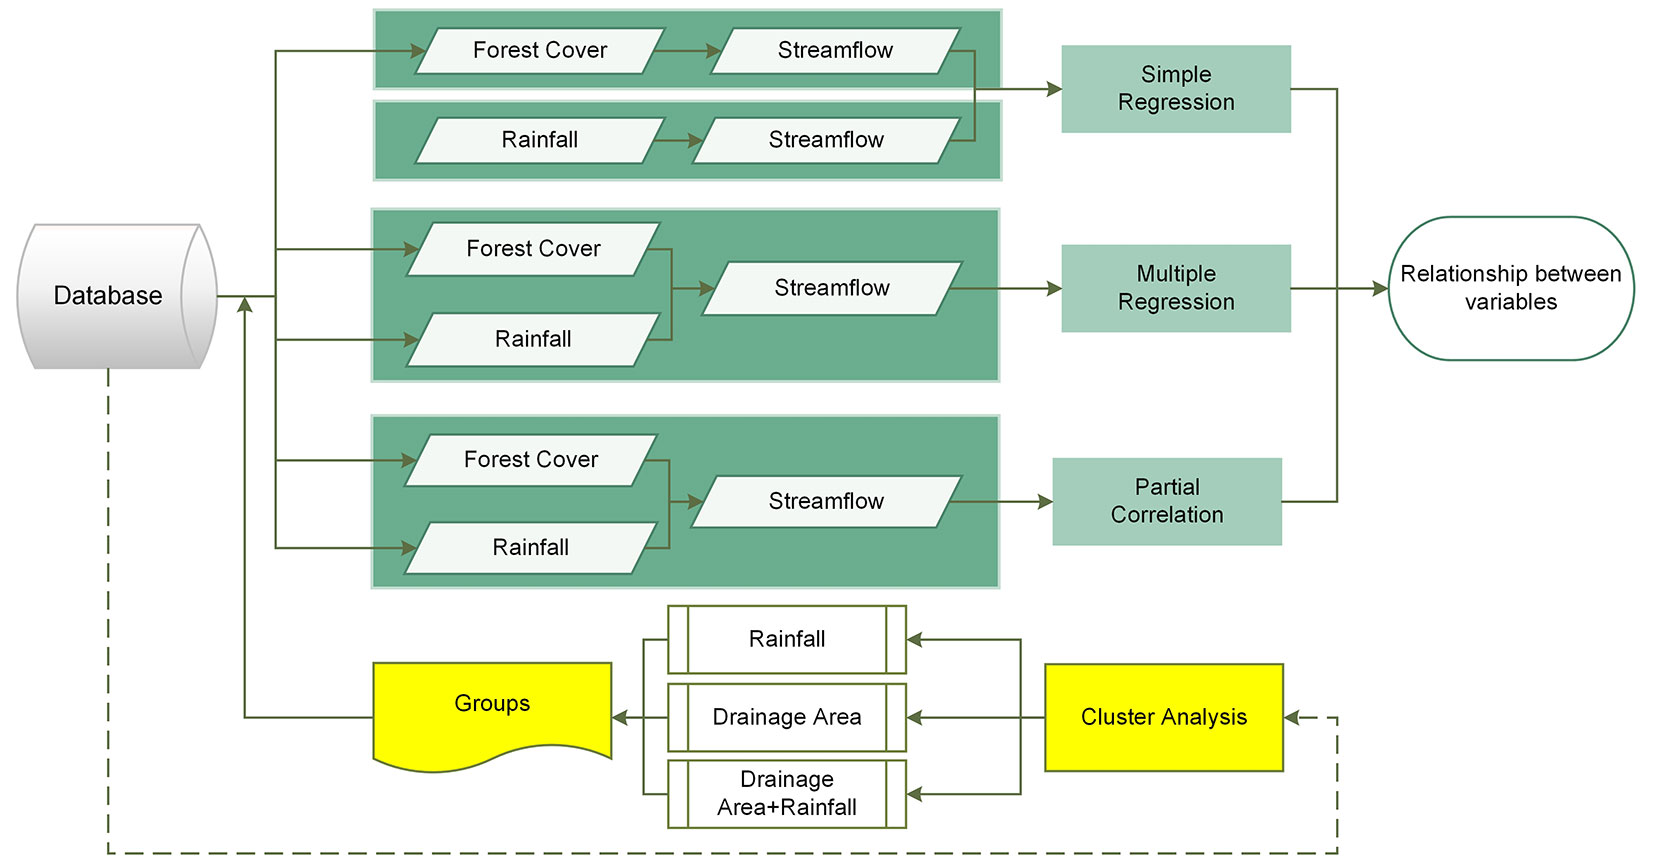
We used data recorded from several watersheds in one typical hydrological year. The short period of analysis is compensated by studying several watersheds at the same time under different environmental and land use conditions, which allows a better regional representation. The dataset included the following types of information: the percentage of forest cover, annual rainfall, average specific streamflow, and minimum average specific streamflow in seven consecutive days. Simple and multiple regression analysis as well as partial correlation were applied to disentangle the effect of forest cover and rainfall on watershed streamflow. To reduce the effect of heterogeneity of environmental factors, watersheds with similar characteristics in term of rainfall, drainage area, and both rainfall and drainage area were grouped by cluster analysis, and the above regression analysis was repeated on each group. A flowchart summarizing the proposed methodology is reported in Fig. 1.
Fig. 1 - Flowchart of the proposed method. Firstly, regression and partial correlation analysis were applied on the whole data set of 25 watersheds. Cluster analysis was then performed to identify groups of watersheds with similar environmental characteristics. Finally, regression and correlation analyses were repeated separately for each group of watersheds.
Data sources
We selected 25 watersheds located in the Espírito Santo State (ESS), Southeastern Brazil (Tab. 1). According to the Köppen climate classification, the study area presents the following four major climates: Am, Aw, Cwa, and Cwb ([1]). Additionally, the vegetation is part of the tropical Atlantic Rainforest.
Tab. 1 - Data from the watersheds under study in Espírito Santo State, Brazil. (qave): average specific annual streamflow (L s-1 km-2); (q7): minimum specific streamflow with seven days duration (L s-1 km-2).
| ID | Watershed name | Area (km²) |
Streamflow | Rainfall (mm) |
Forest cover (%) |
|
|---|---|---|---|---|---|---|
| qave | q7 | |||||
| 1 | Pedro Canário | 1665.9 | 3.1 | 0.3 | 690.8 | 4.7 |
| 2 | São Jorge da Barra Seca | 451.7 | 4.6 | 1.0 | 820.3 | 15.7 |
| 3 | Laranja da Terra | 1331.7 | 10.1 | 4.1 | 1023.2 | 23.4 |
| 4 | Baixo Guandú | 2143.2 | 4.7 | 1.1 | 908.0 | 25.8 |
| 5 | Córrego da Piaba | 879.4 | 3.7 | 0.2 | 818.8 | 28.5 |
| 6 | Ponte do Pancas | 919.3 | 3.6 | 0.2 | 814.3 | 21.7 |
| 7 | São Gabriel da Palha | 1029.4 | 8.2 | 1.2 | 848.8 | 15.7 |
| 8 | Valsugana Velha - Montante | 90.3 | 13.8 | 0.5 | 1010.1 | 58.0 |
| 9 | Santa Leopoldina | 1011.6 | 7.2 | 3.0 | 1042.2 | 48.5 |
| 10 | Córrego do Galo | 979.0 | 10.9 | 5.0 | 1218.8 | 40.2 |
| 11 | Fazenda Jucuruaba | 1688.6 | 11.5 | 5.3 | 1241.8 | 45.7 |
| 12 | Matilde | 207.3 | 23.1 | 9.4 | 1480.9 | 58.2 |
| 13 | Usina Fortaleza | 223.0 | 12.1 | 3.1 | 1282.6 | 24.0 |
| 14 | Iúna | 433.5 | 14.4 | 5.8 | 1257.8 | 11.0 |
| 15 | Terra Corrida - Montante | 594.0 | 13.4 | 5.3 | 1281.2 | 12.0 |
| 16 | Itaici | 1047.4 | 13.1 | 4.1 | 1303.4 | 17.1 |
| 17 | Ibitirama | 341.6 | 28.1 | 5.2 | 1354.2 | 30.1 |
| 18 | Rive | 2221.0 | 14.7 | 4.9 | 1355.0 | 18.5 |
| 19 | Pacotuba | 2759.6 | 13.6 | 3.7 | 1358.5 | 18.2 |
| 20 | Fazenda Lajinha | 436.2 | 12.4 | 2.6 | 1305.7 | 33.9 |
| 21 | Castelo | 976.1 | 14.0 | 2.3 | 1364.7 | 30.3 |
| 22 | Usina São Miguel | 1457.5 | 15.1 | 3.3 | 1403.1 | 31.9 |
| 23 | Coutinho | 4604.4 | 14.9 | 3.7 | 1377.8 | 23.1 |
| 24 | Usina Paineiras | 5169.3 | 14.2 | 3.9 | 1377.8 | 22.6 |
| 25 | Guaçuí | 411.9 | 25.0 | 8.2 | 1452.5 | 22.1 |
| - | Mean | 1322.9 | 12.4 | 3.6 | 1175.7 | 27.2 |
| - | Standard deviation | 1272.6 | 6.3 | 2.3 | 241.2 | 13.9 |
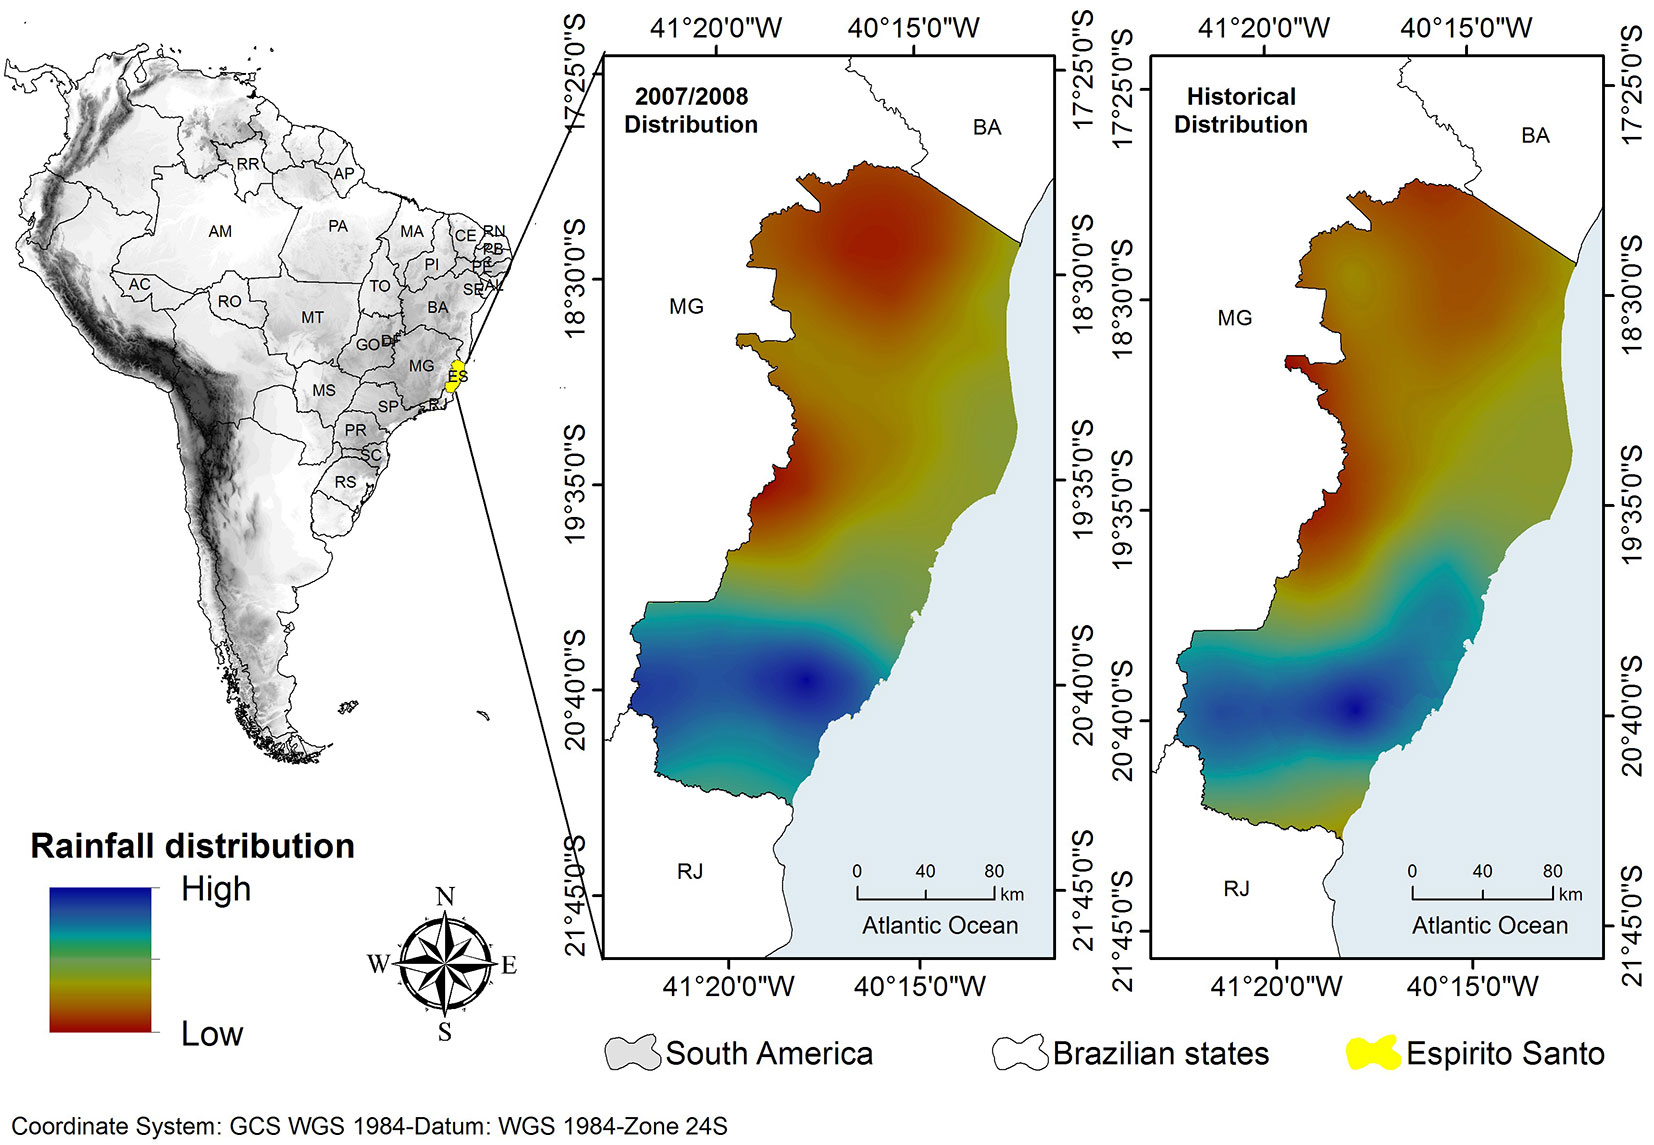
We focused on records from the streamflow and rainfall data platforms of the ESS, which were collected in the hydrological year 2007/2008 (beginning in October 2007 and ending in September 2008). This dataset was chosen since it was the most recent and complete survey of land use of the ESS (see below) and provides information from previous and subsequent years. The average annual rainfall for the selected period (1074 mm) was within the normal long-term range for ESS (1186 ± 210 mm year-1), indicating that the selected year is representative of local historical conditions. Additionally, we compared the geographical distribution and patterns of rainfall for the period 2007/2008 with the historical records to confirm its hydrological representativeness (Fig. 2).
Fig. 2 - Geographical pattern of the rainfall in the Espírito Santo State (ESS). (Left panel): rainfall distribution in the hydrological year 2007/2008; (right panel): historical mean rainfall distribution.
We delimited the watersheds by referring to the upstream drainage area of each streamflow station using a Hydrologically-Consistent Digital Elevation Model (HCDEM). The HCDEM was created from the Digital Elevation Model (DEM) of SRTM (Space Shuttle Radar Topographic Mission), which was obtained from the United States Geological Survey (USGS - ⇒ https://earthexplorer.usgs.gov/) with a 30-meter resolution. Firstly, we created a mosaic of images and filled DEM sinks. To improve terrain representation, specifically regarding hydrological consistency, we reconditioned the DEM and created the HCDEM using the AGREE algorithm ([23]), available in the Arc Hydro Tools® package of the software ArcGIS® ver. 10.3.1 (ESRI, Redwoods, CA, USA).
The watershed delimitation was obtained by successive applications of the following tools of the HCDEM in the Hydrology toolbox in ArcMap®: fill, flow direction, flow accumulation, stream definition, snap pour point, and watershed. We used the river station locations at the mouths of the main rivers as references for allocating the pour points in the snap pour point tool. Finally, the automatic delimitation of the watersheds under study was performed using the watershed tool.
Water streamflow
The streamflow data for the hydrological year 2007/2008 was obtained from streamflow stations of the ESS, which are freely available at the National Information System on Water Resources (Sistema Nacional de Informações Sobre Recursos Hídricos, SNIRH - ⇒ http://www.snirh.gov.br/hidroweb). For some of the stations pre-processed data were not available, and raw data was considered. In the pre-processing step, we filled the gaps using simple linear regression between streamflows and the station elevations. The stations with a gap rate above 3% were disregarded since they presented atypical values according to the tendency of the hydrographs. After pre-processing, 25 streamflow stations were selected for further analyses.
The average annual streamflow rate (Qave) and the average minimum streamflow rate for seven days (Q7) for the hydrological year 2007/2008 were obtained for each station. We also estimated the respective specific streamflows (qave and q7), which are calculated as the ratio between the streamflow (Q) and the drainage area (km²) of each watershed.
Rainfall
Daily rainfall data was obtained from the daily gridded meteorological variables in Brazil (⇒ https://utexas.app.box.com/v/Xavier-etal-IJOC-DATA - [47]), which consists of a grid dataset (0.25° × 0.25°) spatially interpolated from station rainfall data. Total annual rainfall for the hydrological year 2007/2008 was obtained for each grid point covering the ESS. To obtain the annual rainfall for each watershed with a spatial resolution of 30 m, we interpolated this variable over the entire state using the ordinary kriging (linear model) in ArcGIS v. 10.3.1 ([41]).
Forest cover
Forest cover data for the years 2007 and 2008 were obtained from the aerophotogrammetric land use survey carried out by the Instituto Estadual do Meio Ambiente e Recursos Hídricos (IEMA), which is freely available at the GEOBASES data portal (⇒ https://geobases.es.gov.br/links-para-mapes1215). Additionally, we used an orthophotomosaic with 1-m spatial resolution representing the most recent complete survey of the vegetation of the ESS. Among the 25 classes present in the original survey, we selected only the areas of interest, which included the classes “Native Forest” and “Native Forest in Initial Regeneration Stage”. To estimate the forest cover, the previously delimited watersheds were used as a mask and forest cover was calculated for each watershed. The classes of silvicultural crops composed of exotic species, such as eucalypts, rubber, and pine trees, were excluded from the analysis as their ecological systems differ substantially from native forests. However, according to the orthophotomosaic, the silvicultural crop areas were negligible during 2007 and 2008, and no streamflow stations were present in most of these sites, making it impossible to establish any relationship between forest cover and streamflow.
Statistical analyses
The relationships of the percentage of forest cover and the rainfall with the average specific annual streamflow (qave) and the minimum specific streamflow with seven days duration (q7) were estimated using simple and multiple linear regression. Also, a partial correlation between forest cover and streamflow was applied using the rainfall as a fixed effect. The analyses were performed using together all the 25 watersheds, and the significance of the results was assessed by the F-test with α = 0.10.
As watersheds naturally presented different sizes, the contrasting rainfall regimes may influence their hydrological behavior. Thus, the linear regression and the partial correlation were applied separately after grouping the watersheds by similarity. Three different approaches of watershed grouping were adopted according to: (a) homogeneous regions of rainfall; (b) drainage area; and (c) both rainfall and drainage area. We used the hierarchical cluster analysis along with Ward’s method ([45]) based on the average Euclidean distance as a measure of similarity between watersheds.
Results and discussion
Joint analysis of the watersheds
The results obtained from the data of all 25 watersheds are presented in Tab. 2 and Tab. 3. As expected, we found a significant relationship between rainfall and streamflow. According to the partial correlation coefficients, higher streamflow rates are associated with higher rainfall rates in the watersheds. This is in agreement with previous studies ([42], [31], [48]), and confirms that rainfall acts as the main input component of water in the hydrological cycle, boosting the other stages of the cycle and the flows of water bodies.
Tab. 2 - Simple linear regression between streamflow, forest cover, and rainfall for all 25 watersheds. (qave): average specific annual streamflow (L s-1km-2); (q7): minimum specific streamflow with seven days duration (L s-1 km-2); (R2): coefficient of determination.
| Variable | Stats | Rainfall | Forest cover |
|---|---|---|---|
| qave | R² | 0.68 | 0.06 |
| p-value | <0.001 | 0.228 | |
| q7 | R² | 0.61 | 0.04 |
| p-value | <0.001 | 0.346 |
Tab. 3 - Multiple linear regression and partial correlation between streamflow, forest cover, and rainfall for all 25 watersheds; (qave): average specific annual streamflow (L s-1 km-2); (q7): minimum specific streamflow with seven days duration (L s-1 km-2); (rp): coefficient of partial correlation; (R2): coefficient of determination.
| Variable | Stats | Rainfall | Forest cover |
|---|---|---|---|
| qave | R² | 0.69 | |
| p-value | <0.001 | ||
| rp | 0.82 | 0.14 | |
| p-value | <0.001 | 0.516 | |
| q7 | R² | 0.61 | |
| p-value | <0.001 | ||
| rp | 0.77 | 0.06 | |
| p-value | <0.001 | 0.8 | |
The relationship between streamflow and forest cover using the whole dataset of 25 watershed was not significant (Tab. 2, Tab. 3). However, Zabaleta et al. ([48]) report that in some cases the strong influence of rainfall on hydrological responses of watersheds may mask the relationship between streamflow and land cover in areas with rainfall gradients, such as those considered in this study. Indeed, the heterogeneity of the studied watersheds may have masked the relationship between streamflow and forest cover. Therefore, we investigated this relationship using more homogeneous watershed groups from the cluster analysis.
Watershed grouping
Cluster analysis based on rainfall similarity allowed to detect four groups of watersheds, considering the assumed cut point (Fig. 3). The group composed of Santa Leopoldina, Laranja da Terra, and Valsugana Velha watersheds was discarded, as it was formed by only three members and thus was deemed insufficient to perform the statistical analyses. The remaining three watershed groups (P1, P2, and P3.) were organized following a decreasing order of average rainfall (Fig. 3a). Group P1 included watersheds with the highest average rainfall (1391.6 ± 45.8 mm), group P2 had an intermediate average rainfall (1270.2 ± 32.2 mm), and group P3 had the lowest average rainfall (816.9 ± 71.0 mm).
Fig. 3 - Dendrograms obtained by cluster analysis of watersheds with similar environmental characteristics, according to: (a) rainfall; (b) drainage area; and (c) both drainage area and rainfall.
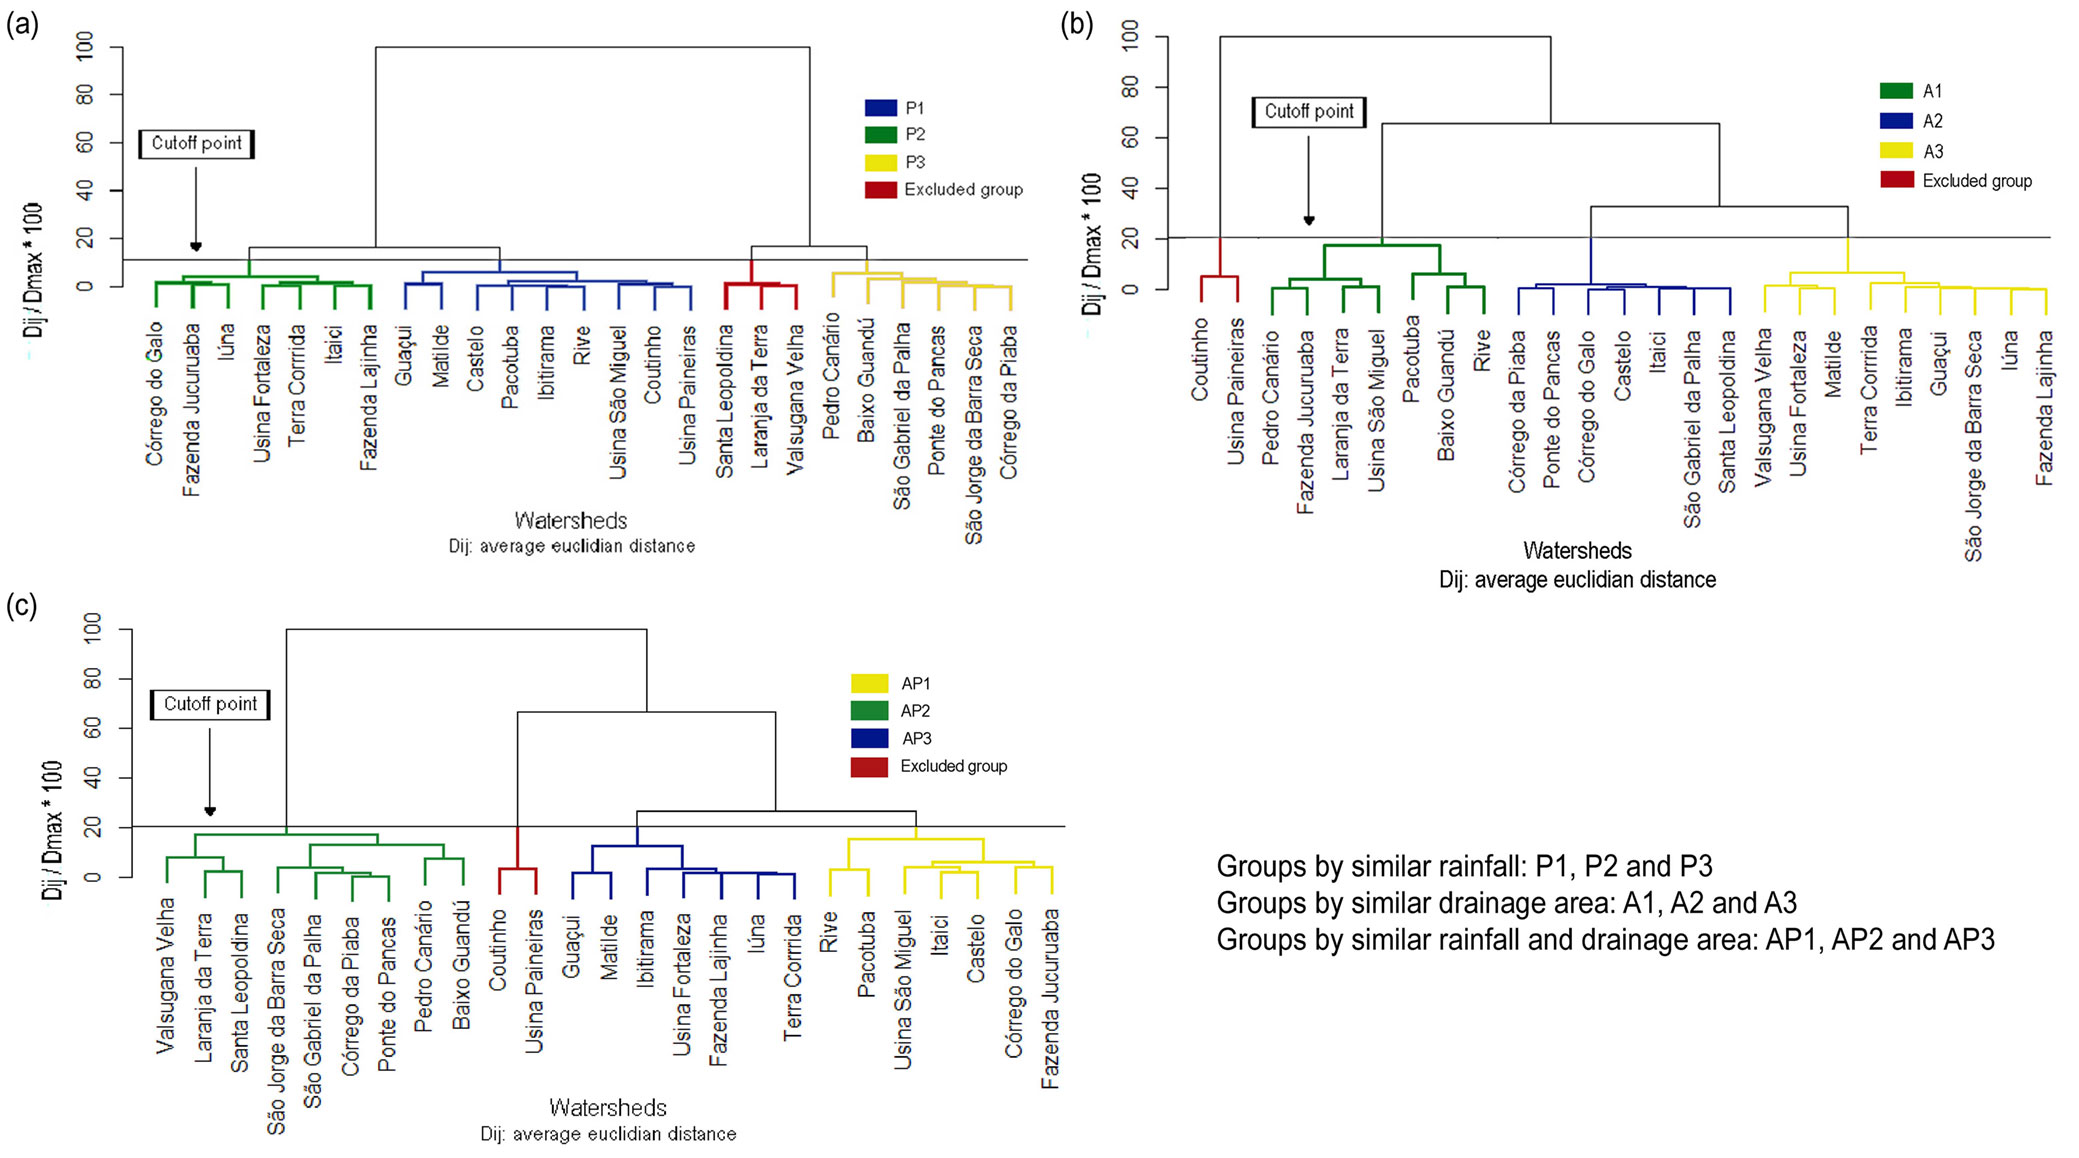
Cluster analysis of watersheds based on their drainage area resulted in four groups (Fig. 3b). The group formed by the Coutinho and Usina Paineiras watersheds (the largest of the data set) was discarded due to the insufficient number of watersheds. The remaining three groups (A1, A2, and A3) were organized according to their mean area (Fig. 3b): group A1 (average size of 1895.4 ± 503.2 km²); group A2 (average size of 977.5 ± 60.2 km²); and group A3 (average size of 354.4 ± 154.9 km²).
Finally, the cluster analysis carried out according to both drainage areas and rainfall allowed to detect four groups of watersheds. The group formed by the Coutinho and Usina Paineiras watersheds was discarded due to the insufficient number of watersheds. The remaining three groups (AP1, AP2, and AP3) were as follows (Fig. 3c): the group AP1 included the watersheds with the largest areas (1589.9 ± 687.8 km2) and medium/high rainfall rates (1320.8 ± 68.6 mm); the group AP2 included the medium-sized watersheds (1058.0 ± 610.3 km2) and lower rainfall rates (886.3 ± 118.6 mm); and the group AP3 included the smallest watersheds (378.2 ± 134.6 km2) with the highest average rainfall (1345.0 ± 88.7 mm).
Analysis by groups of homogeneous watersheds
Tab. 4 and Tab. 5 show the simple linear regression analysis, the multiple linear regression analysis, and the partial correlation between streamflow, forest cover, and rainfall for each cluster of watersheds formed as a function of rainfall, drainage area, and drainage area and rainfall simultaneously. As already observed for the joint analysis (see above), the annual rainfall predominantly affects the watershed streamflow (Tab. 4, Tab. 5). In general, there were no significant effects of rainfall for the cluster of watersheds according to similar rainfall rates (P1, P2, and P3 groups), due to the reduction of the data variance within the groups which lowered the statistical power of the applied test.
Tab. 4 - Simple linear regression between streamflow, forest cover, and rainfall for the watershed groups obtained by cluster analysis. (qave): average specific annual streamflow (L s-1 km-2); (q7): minimum specific streamflow with seven days duration (L s-1 km-2); (R2): coefficient of determination.
| Cluster Analysis |
Watershed groups |
Variables | Streamflow qave | Streamflow q7 | ||
|---|---|---|---|---|---|---|
| R² | p-value | R² | p-value | |||
| By rainfall | P1 | Rainfall | 0.21 | 0.218 | 0.68 | 0.006 |
| Forest | 0.16 | 0.285 | 0.30 | 0.126 | ||
| P2 | Rainfall | 0.22 | 0.285 | 0.41 | 0.120 | |
| Forest | 0.82 | 0.005 | 0.03 | 0.710 | ||
| P3 | Rainfall | 0.23 | 0.333 | 0.37 | 0.202 | |
| Forest | 0.00 | 0.981 | 0.00 | 0.971 | ||
| By drainage area | A1 | Rainfall | 0.95 | <0.001 | 0.62 | 0.037 |
| Forest | 0.17 | 0.365 | 0.36 | 0.155 | ||
| A2 | Rainfall | 0.88 | 0.002 | 0.64 | 0.032 | |
| Forest | 0.00 | 0.986 | 0.15 | 0.390 | ||
| A3 | Rainfall | 0.60 | 0.014 | 0.71 | 0.004 | |
| Forest | 0.09 | 0.437 | 0.00 | 0.962 | ||
| By rainfall and drainage area |
AP1 | Rainfall | 0.94 | <0.001 | 0.52 | 0.069 |
| Forest | 0.39 | 0.136 | 0.09 | 0.525 | ||
| AP2 | Rainfall | 0.57 | 0.018 | 0.50 | 0.033 | |
| Forest | 0.45 | 0.049 | 0.03 | 0.637 | ||
| AP3 | Rainfall | 0.57 | 0.048 | 0.65 | 0.028 | |
| Forest | 0.16 | 0.376 | 0.14 | 0.400 | ||
Tab. 5 - Multiple linear regression and partial correlation between streamflow, forest cover, and rainfall for the watershed groups obtained by cluster analysis. (qave): average specific annual streamflow (L s-1 km-2); (q7): minimum specific streamflow with seven days duration (L s-1 km-2); (R2): coefficient of determination; (rp): coefficient of partial correlation.
| Cluster Analysis |
Watershed groups |
Variables | Streamflow qave | Streamflow q7 | ||||||
|---|---|---|---|---|---|---|---|---|---|---|
| R² | p-value | rp | p-value | R² | p-value | rp | p-value | |||
| By rainfall | P1 | Rainfall | 0.22 | 0.469 | 0.27 | 0.512 | 0.68 | 0.032 | 0.74 | 0.036 |
| Forest | 0.14 | 0.740 | -0.03 | 0.949 | ||||||
| P2 | Rainfall | 0.82 | 0.032 | 0.10 | 0.858 | 0.72 | 5.047 | -0.84 | 0.036 | |
| Forest | -0.88 | 0.022 | -0.72 | 0.107 | ||||||
| P3 | Rainfall | 0.57 | 0.284 | 0.75 | 0.141 | 0.91 | 0.028 | 0.95 | 0.012 | |
| Forest | -0.66 | 0.224 | -0.92 | 0.025 | ||||||
| By drainage area | A1 | Rainfall | 0.96 | 0.002 | 0.97 | 0.001 | 0.68 | 0.105 | 0.70 | 0.119 |
| Forest | -0.36 | 0.489 | -0.87 | 0.434 | ||||||
| A2 | Rainfall | 0.93 | 0.006 | 0.96 | 0.002 | 0.69 | 0.099 | 0.79 | 0.060 | |
| Forest | -0.61 | 0.196 | - | 0.37 | 0.470 | |||||
| A3 | Rainfall | 0.64 | 0.046 | 0.78 | 0.023 | 0.72 | 0.023 | 0.85 | 0.008 | |
| Forest | 0.32 | 0.435 | -0.16 | 0.712 | ||||||
| By rainfall and drainage area |
AP1 | Rainfall | 0.95 | 0.003 | 0.96 | 0.003 | 0.54 | 0.213 | -0.70 | 0.118 |
| Forest | -0.30 | 0.562 | -0.21 | 0.677 | ||||||
| AP2 | Rainfall | 0.59 | 0.071 | 0.50 | 0.204 | 0.88 | 0.002 | 0.94 | 0.001 | |
| Forest | 0.17 | 0.680 | -0.87 | 0.005 | ||||||
| AP3 | Rainfall | 0.61 | 0.152 | 0.73 | 0.098 | 0.72 | 0.077 | 0.82 | 0.044 | |
| Forest | -0.29 | 0.577 | -0.45 | 0.371 | ||||||
A significant association between minimum streamflow and rainfall (p-value = 0.036) was found for group P2, which included the watersheds with intermediate precipitation, with a negative tendency (rp = -0.84). This means that an increase in rainfall imply a reduction in the streamflow, thus contrasting the physical processes of inflow and outflow of water in the watershed. However, the environmental heterogeneity of the region, which is composed of coastal to mountainous areas, may have a great influence on local evapotranspiration, infiltration, and water storage rates due to the presence of other environmental factors not analyzed in this work, such as geological or pedological aspects. Moreover, in some cases, environmental factors may not directly explain changes in the streamflow regime but may be an effect of anthropogenic influences ([38]). Therefore, the region that comprises the watersheds Córrego do Galo, Fazenda Jucuruaba, Iúna, Fortaleza, Terra Corrida, Itaici, and Fazenda Lajinha requires further research regarding, e.g., soil hydraulic properties to better understand the factors influencing water availability in those watercourses.
Regarding the influence of forest cover in the first group by rainfall (P1, P2, and P3), we found a significantrelationship with average and minimum streamflows (Tab. 4, Tab. 5). In both cases, the relationship showed a negative tendency (rp- Tab. 5), which means that lower streamflows occurred in watersheds with a higher forest cover and vice-versa. Furthermore, we observed that the minimum streamflows (q7) were strongly influenced by rainfall and forest cover (Tab. 5). This allows to hypothesize that during the drought periods, minimum streamflows in this region (Pedro Canário, Baixo Guandú, Barra de São Gabriel, Ponte do Pancas, São Jorge, and Córrego da Piaba watersheds) are more sensitive to low rainfall due to the presence of forests.
According to Tucci & Clarke ([43]), of the amount of water that reaches the ground, the undrained part tends to infiltrate. Under these conditions, infiltration into forest soils is usually high, producing lower surface runoff. Besides, the increase in foliage surface area is closely related to the increase in rainfall interception and evapotranspiration rate. As a result, evapotranspiration is responsible for returning large volumes of water to the atmosphere, depending on the type of forest cover, stage, or density, and influencing the loss of soil moisture by the withdrawal of water from the plant roots.
A widely discussed hypothesis in the scientific community about the relationship between forests and streamflows is the “infiltration-evapotranspiration trade-off”, postulated by Bruijnzeel ([10], [12]) and supported by other studies ([35], [26], [19]). This hypothesis suggests that, as the forest cover is reduced, the water lost as streamflow due to reduced infiltration may outweigh the gains in the baseflow as evapotranspiration is reduced, which results in a decrease of watershed flows. On the other hand, since the infiltration capacity is conserved, the gains from reduced evapotranspiration may be higher, resulting in increased flows with reduced forest cover ([10], [12]).
In this study, we observed higher streamflows in less forested areas and vice-versa. According to the land use survey that we used, approximately 49% of the Espírito Santo State land is composed of pastures, rocky outcrops, exposed soil, mining areas, and built-up areas. These land uses can reduce the infiltration capacity of soils compared to forest soils ([10], [12], [35], [48], [34]). In addition, we found that about 20% of the state territory is occupied by crops and forest crops, both of which use machinery in the production cycle and can cause soil compaction. Finally, according to State Civil Defense ([21]), the occurrence of hydrological disasters is usually common in the study area when the rainfall saturates the drainage capacity of soils and urban systems. This event occurs mainly because of the disordered urban occupation on slopes and river banks ([21]), which should be ideally covered by vegetation.
The reduction in water infiltration into soil restricts the replenishment of groundwater ([12]). The “infiltration-evapotranspiration trade-off” hypothesis could explain a possible reduction in streamflows on less forested areas, which contrasts with the increases detected in our study. Thus, the negative relationship between forest and streamflow in addition to the stronger association found in drought periods is more related to gains attributed to the reduction in the evapotranspiration of the Atlantic Rainforest rather than to the improvement of the soil infiltration capacity.
Increases in streamflows due to decreased forest cover can be associated with water losses through forest evapotranspiration ([49]). Annual evapotranspiration of areas with rare periods of water deficit in tropical forests, specifically in Brazil, can reach 70% of the incident rainfall ([11]). The various evapotranspiration rates of Brazilian forests ([17], [7], [30]) provide material to understand water outflows to the atmosphere in watersheds with forest cover, as well as their impact on the volume of water that leaves the corresponding watercourses.
The negative association between forest cover and streamflows is likely a consequence of water consumption by vegetation. This event is significant during drought or low rainfall periods, and affects the water availability of watersheds under these circumstances. Regarding the negative relationship between forest cover and water availability, similar results were obtained in other studies under different methodologies and different vegetation types worldwide ([25], [35], [9], [31]).
Regarding the difference between these results and the analysis of the 25 watersheds, besides the rainfall rate, we believe that this pattern is an effect of watersheds size, which may influence the hydrological response. Afterwards, the effect of the spatial scale on hydrological responses caused by changes in forest cover is still poorly understood and inconclusive. However, it is known that large and small watersheds can present different hydrological responses to the same factor analyzed ([50]). Thus, the drainage area was tested as a criterion for watershed clustering.
Regression analysis carried out for the groups A1, A2, and A3 showed that only rainfall significantly affected the streamflow, while the percentage of forest cover did not have a significant influence on streamflow (Tab. 4, Tab. 5). In this case, clustering of watersheds based on drainage area may have aggregated heterogeneous watershed in terms of rainfall amount and patterns, which could mask the effect of forest cover. Again, rainfall is a crucial factor for understanding streamflow dynamics. The large size of the watersheds (Tab. 1) can explain the strong influence of rainfall since there is less control of events and actions, with higher heterogeneity of environmental factors ([11]). As a result, as the watershed size increases, the effects of forest cover change in term of hydrological response is generally less pronounced ([50]).
Our results showed that the percentage of forest cover had a significant influence on streamflow when the watershed groups based on drainage area and rainfall (AP1, AP2, and AP3) are considered. Besides, we found a significant influence of forest cover on the average streamflow (qave) for the AP2 group (varied sizes and lower rainfall) using a simple linear regression (R2 = 0.45, p-value = 0.049 - Tab. 4). In the same group, the influence of forest cover on minimum streamflow (q7) was not significant (R2 = 0.03,p-value = 0.637), though it was significant by partial correlation (rp = -0.87, p-value = 0.005) using the rainfall as fixed effect.
The annual runoff is more sensitive to forest cover at different spatial scales in watersheds with limited rainfall, causing more significant hydrological responses ([50]). In addition, the annual runoff also has an influence on water losses and affects the annual streamflows. As a result, our study shows that the lower rainfall rate found in the group AP2 was a driving factor for the occurrence of the significant relationship between minimum streamflows (q7) and forest cover. When the annual rainfall is lower, the minimum streamflow during drought periods may be more sensitive to rainfall as well as to the water demand of forests, which is probably higher in warmer and drier periods.
The effect of forests on flow patterns in the dry season is one of the most contradictory aspects in forest hydrology, with conflicting evidence for different combinations of forests, rainfall, and soil conditions. During the drought season, the effect of the balance between infiltration capacity and evapotranspiration becomes even more prominent ([10]), which may explain the detection of a significant relationship between forest cover and minimum streamflow (q7) in this study.
We observed that all the significant partial correlation coefficients between streamflow and forest cover were negative, which means that smaller streamflows occurred in watersheds with a higher percentage of forest cover and vice-versa. We also observed the same tendency for most non-significant relationships. This is the opposite of the general belief that forests would increase the amount of water available in rivers. However, this is a controversial subject and our results may not be definitive about this topic.
Based on the dynamic of the balance between infiltration and evapotranspiration, we emphasize the importance of prioritizing good soil management practices among the land uses that already exist in watersheds. For example, reforestation of watersheds should be well planned considering the hydrological and soil conditions at each site. Indeed, the replacement of other land uses with forested areas may not always reflect substantial gains in streamflows ([19]). In some cases, soil surface conditions and the groundwater storage capacity can have a higher influence on water production during drought periods than deforestation or reforestation ([34]).
Although forestsdo not always increasethe annual water yield in watersheds, it can affect other important hydrological mechanisms. For example, forest loss can weaken the regulating mechanisms of tropical watersheds, altering river flow regimes and possibly leading to extreme events, such as floods and/or water shortage ([37]). Also, the quality of water resources and the environment in watersheds is positively affected by forest cover. Considering parameters such as soil structure, runoff control and flow variability over the seasons, sediment production, and water chemical properties ([3], [35], [29]), a larger forest cover may ensure a safer and more reliable water supply for local population ([26]).
Large-scale deforestation in tropical rainforests can influence the tropospheric moisture flows and atmospheric processes that regulate the transition between dry and rainy seasons. According to observations of reciprocal feedbacks on climate-forest for the Amazon, deforestation can delay the onset of rainfall at regional scale, as discussed by Chambers & Artaxo ([13]), Laurance & Williamson ([27]), and Wright et al. ([46]). Further analysis of the influences of vegetation evapotranspiration on the beginning of the rainy season in the Brazilian Atlantic Rainforest is necessary to generalize this process.
Conclusions
Water security for human society is a real need and a worldwide concern. On the other hand, population growth and the development of productive activities are closely related to land-use changes and the conversion of forest areas.
In this study, we analyzed the relationships between streamflow, rainfall and forest cover over the period 2007/2008 in the Espirito Santo State, southeastern Brazil, by grouping watersheds with similar physical and/or environmental characteristics. This approach can help local managers to better understand how forest management can reduce or increase hydrological availability.
The average minimum streamflow during seven days (q7) was more sensitive to the presence of forest cover, showing a negative relationship, especially in watersheds with low annual rainfall. Regarding the areas with high rainfall levels, the annual rainfall showed a strong influence on the hydrological responses of watersheds, regardless of the percentage of forest cover.
The methodology applied in this study is a viable and easy-to-apply alternative to (but not a substitute of) consolidated methods in hydrological science, such as experimental watersheds and long-term time-trends. Our approach can be usefully replicated in other regions, as long as the hydrological variables for the analyzed period fall within their normal historical range, since it does not require the experimental suppression of forest cover and allows the simultaneous study of several watersheds, which can be very useful for water management. Moreover, other environmental variables related to the hydrological dynamics of watersheds may be included in the analysis, aimed to throw light in greater detail on this complex association.
Acknowledgements
We thank the National Council for Scientific and Technological Development (CNPq) for the financial support of this study.
References
Online | Gscholar
CrossRef | Gscholar
CrossRef | Gscholar
CrossRef | Gscholar
Gscholar
Authors’ Info
Authors’ Affiliation
Dulcinéia De Carvalho 0000-0001-9447-4538
Department of Forest Science, Federal University of Lavras - UFLA, 1001 Doutor Sylvio Menicucci Ave. Lavras, Minas Gerais (Brazil)
Roberto Avelino Cecílio 0000-0003-2894-2481
Francielle Rodrigues De Oliveira 0000-0002-7135-432X
Federal University of Espírito Santo - UFES, 316 Governador Lindenbergue Ave. Jerônimo Monteiro, Espírito Santo (Brazil)
Corresponding author
Paper Info
Citation
Ferraz FT, Zanetti SS, Cecílio RA, De Carvalho D, De Oliveira FR (2021). Method for the analysis of the relationship between forest cover and streamflow in watersheds. iForest 14: 344-352. - doi: 10.3832/ifor3536-014
Academic Editor
Raffaele Lafortezza
Paper history
Received: May 28, 2020
Accepted: May 24, 2021
First online: Jul 21, 2021
Publication Date: Aug 31, 2021
Publication Time: 1.93 months
Copyright Information
© SISEF - The Italian Society of Silviculture and Forest Ecology 2021
Open Access
This article is distributed under the terms of the Creative Commons Attribution-Non Commercial 4.0 International (https://creativecommons.org/licenses/by-nc/4.0/), which permits unrestricted use, distribution, and reproduction in any medium, provided you give appropriate credit to the original author(s) and the source, provide a link to the Creative Commons license, and indicate if changes were made.

Web Metrics
Breakdown by View Type
Article Usage
Total Article Views: 36932
(from publication date up to now)
Breakdown by View Type
HTML Page Views: 30873
Abstract Page Views: 2866
PDF Downloads: 2567
Citation/Reference Downloads: 3
XML Downloads: 623
Web Metrics
Days since publication: 1757
Overall contacts: 36932
Avg. contacts per week: 147.14
Article Citations
Article citations are based on data periodically collected from the Clarivate Web of Science web site
(last update: Mar 2025)
Total number of cites (since 2021): 1
Average cites per year: 0.20
Publication Metrics
by Dimensions ©
Articles citing this article
List of the papers citing this article based on CrossRef Cited-by.
Related Contents
iForest Similar Articles
Technical Reports
Soil bio-engineering for watershed management and disaster mitigation in Ecuador: a short-term species suitability test
vol. 6, pp. 95-99 (online: 07 February 2013)
Research Articles
Does higher owner participation increase conflicts over common land? An analysis of communal forests in Galicia (Spain)
vol. 8, pp. 533-543 (online: 01 December 2014)
Research Articles
Role of forest cover, land use change and climate change on water resources in Marmara basin of Turkey
vol. 8, pp. 480-486 (online: 31 October 2014)
Research Articles
Diversity, distribution and vegetation assessment in the Jahlmanal watershed in cold desert of the Lahaul valley, north-western Himalaya, India
vol. 3, pp. 65-71 (online: 17 May 2010)
Short Communications
The Polish landscape changing due to forest policy and forest management
vol. 2, pp. 140-142 (online: 30 July 2009)
Research Articles
Hydrological simulation of a small forested catchment under different land use and forest management
vol. 13, pp. 301-308 (online: 10 July 2020)
Research Articles
Scale dependency of the effects of landscape structure and stand age on species richness and aboveground biomass of tropical dry forests
vol. 16, pp. 234-242 (online: 23 August 2023)
Technical Notes
The feasibility of implementing cross-border land-use management strategies: a report from three Upper Silesian Euroregions
vol. 7, pp. 396-402 (online: 19 May 2014)
Technical Reports
Deforestation, land conversion and illegal logging in Bangladesh: the case of the Sal (Shorea robusta) forests
vol. 5, pp. 171-178 (online: 25 June 2012)
Research Articles
Evaluation of urban forest landscape health: a case study of the Nanguo Peach Garden, China
vol. 13, pp. 175-184 (online: 02 May 2020)
iForest Database Search
Search By Author
Search By Keyword
Google Scholar Search
Citing Articles
Search By Author
Search By Keywords
PubMed Search
Search By Author
Search By Keyword


