Estimation of fuel loads and carbon stocks of forest floor in endemic Dalmatian black pine forests
iForest - Biogeosciences and Forestry, Volume 13, Issue 5, Pages 382-388 (2020)
doi: https://doi.org/10.3832/ifor3184-013
Published: Sep 01, 2020 - Copyright © 2020 SISEF
Research Articles
Abstract
Estimation of forest floor loading is important for many forest management applications, especially those related to fire management and carbon balance. We quantified the physical properties (depth, fuel load, bulk density) and carbon stocks of endemic Dalmatian black pine (Pinus nigra J.F. Arnold subsp. dalmatica [Vis.] Franco) forest floor layers. We also examined how these properties differ with stand age and layer. Forest floor depths ranged from 1.5 cm to 11.5 cm and forest floor fuel (FFF) loads ranged from 11.9 Mg ha-1 in the young stand to 197.3 Mg ha-1 in the old stand. Forest floor carbon (FFC) stocks ranged from 6.4 Mg C ha-1 in the young stand to 85.8 Mg C ha-1 in the old stand. We developed regression equations that can be used to convert the investigated forest floor depth into load in each layer individually and across all layers. These equations, together with the organic carbon (OC) concentration determined here for individual forest floor layers, simplify quantification of carbon stocks in the forest floor. Bulk density (BD) values reported here can also be used to convert depth measurements to loads for each layer and the entire forest floor. The results presented here are suitable for rapid estimation of FFF loads and FFC stocks based solely on forest floor depth, without the need to sample and analyze large amounts of forest floor fuels. Similarly, spatial distribution in FFF loads and carbon stocks can be assessed simply by measuring forest floor depths.
Keywords
Dalmatian Black Pine, Forest Floor, Fuel Load, Carbon Stock, Bulk Density
Introduction
The forest floor, also known as the O horizon of the soil profile, consists of organic matter in various states of decomposition that has accumulated on the surface of either mineral or organic soil. It links energy flow and nutrient cycling between living vegetation and soil in forest ecosystems. It supports a tremendous biodiversity of microflora and fauna that drive decomposition, humification and mineralisation ([31]). The forest floor helps determine the physical, chemical and microbiological properties of soil, and it helps reduce soil erosion, sequester forest carbon as well as promote ecosystem resilience and vegetation reproduction ([2], [5]).
The forest floor is generally divided into three layers depending on the degree of decomposition, which differ from one another by their chemical and physical properties ([34], [45], [3], [5]). The litter layer (L) or Oi is the uppermost layer and consists of unaltered, recently deposited organic matter such as leaves, needles, twigs, moss and lichens. The origin of the material is easily identifiable. Underlying this is the fermentation layer (F) or Oe, which consists of discoloured, fragmented, partially decomposed but still recognisable organic matter. The F layer has a higher bulk density (BD) and mineral content than the L layer. The deepest layer is humus (H) or Oa, which consists of dark, unrecognisable, well-decomposed organic matter. It has even greater BD and mineral content than the F layer ([20], [4]).
Characterising forest floor layers is important for many forest management applications, especially those related to fire management and carbon balance ([43], [36], [12], [33]). Forest floor fuel (FFF) loading (or mass) is one of the most important properties of the forest floor for prescribed fire planning, fire behavior prediction, fuel modelling and carbon stock calculations ([8], [11], [31], [28]). For example, loading measurements are critical for estimating fuel consumption in wildland fires and for predicting their ecosystem effects, including emissions of smoke and carbon as well as tree mortality ([35]). Information on FFF load is particularly important because the consumption of this layer of forest fuel varies widely and is the greatest source of uncertainty in estimating total carbon emissions during fires ([11]).
The different chemical and physical properties of forest floor layers mean that they have completely different combustion properties and are treated as a separate components in forest fire studies. The L layer, because of its low BD and direct contact with the atmosphere, shows considerable and rapid fluctuations in the moisture content; it dries rapidly, ignites easily and usually burns in the flaming combustion phase. The lower forest floor layers F and H, usually referred to collectively as “duff”, have higher BD, slower drying rates and high mineral content, which dampen fire spread ([43], [34], [28]). These layers therefore ignite less easily and burn mostly under smouldering combustion after the main fire front has passed. Nevertheless, if sufficiently dry, these layers can also be affected by the flaming combustion phase ([34], [46], [28]). Duff characteristics primarily influence fire effects (fuel consumption, smoke production, tree mortality, mineral soil exposure, etc.), while L layer characteristics significantly affect fire behaviour ([40]). Based on the purpose of the particular fire management application, a single layer or combination of layers is used.
FFF loading is measured most accurately through destructive sampling, but this is unsuitable for operational management because it is expensive and requires time-consuming field procedures as well as oven-drying in the laboratory. Alternatively, forest floor loading can be estimated from depth measurements and published BD values for a given forest type, or from regression equations that relate FFF load to depth. Regression equations have been developed for numerous North American species, mostly conifers ([17], [44], [14]), but not for European black pine (Pinus nigra J.F. Arnold), one of the most widespread conifer species that extends over more than 3.5 million hectares from western North Africa, through southern Europe to Asia Minor ([23]).
In forests of pine (Pinus) species, the depth and load of the litter (L) layer remain relatively constant over the entire age range, while the depth and load of F and H layers increase significantly with age, and therefore so do carbon stocks ([44], [49], [1]). In contrast, the average bulk densities of individual layers usually do not change significantly with stand age ([19], [1]).
This study aims to: (i) quantify physical properties (depth, fuel load, BD) and organic carbon (OC) concentrations of black pine forest floor layers and examine how these properties differ with stand age and the layers; (ii) develop regression equations that can be used to convert forest floor depth to load and carbon stock in each layer individually and across all layers; and (iii) evaluate which approach provides more accurate estimates of FFF loads and forest floor carbon (FFC) stocks.
Material and methods
Study site
We carried out these analyses in endemic Dalmatian black pine (Pinus nigra J.F. Arnold subsp. dalmatica [Vis.] Franco), which we refer to henceforth simply as black pine, which grows on the upper regions of the Biokovo mountain in Croatia, on the islands of Brač, Hvar and Korčula as well as on the Pelješac peninsula. This is one of the six main subspecies of black pine, of which the others are nigra, salzmannii, pallasiana, mauretanica and laricio ([23]). These forests grow above the Aleppo pine forests at altitudes of 450-750 m a.s.l. on islands and above 800 m a.s.l. on the coast.
A black pine forest on the south Adriatic island of Brač, Croatia was selected for sampling. Black pine forests extend over 1240 ha on Brač and cover most of the plateau on the island ([10]). The terrain is predominantly flat or gently sloping, with an average slope of 3.2°.
According to the Köppen classification, the climate is warm-summer Mediterranean (Csb), with a mean annual temperature of 12-13 °C and mean annual precipitation of 1200-1300 mm based on data for the period 1961-1990 ([48]). The forest floor was sampled in the middle of fire season in late July 2015 at three forest stands: (i) young - 40 years (43° 17′ 30.15″ N; 16° 35′ 26.6″ E; altitude 630 m a.s.l.); (ii) mature - 80 years (43° 17′ 29.1″ N; 16° 35′ 25.1″ E; altitude 630 m a.s.l.); and (iii) old uneven-aged - 100-150 years (43° 17′ 1.7″ N; 16° 36′ 48.2″ E, altitude 710 m a.s.l.). The stands were approximately 3 km apart and therefore influenced by the same climatic conditions. The dominant soil type in the area is Leptic Cambisol (Humic, Eutric), which alternates with Mollic Leptosol over carbonate parent material (limestone alternating with dolomite). Records indicate no silvicultural treatments or disturbances at the three stands since 1995.
Field sampling
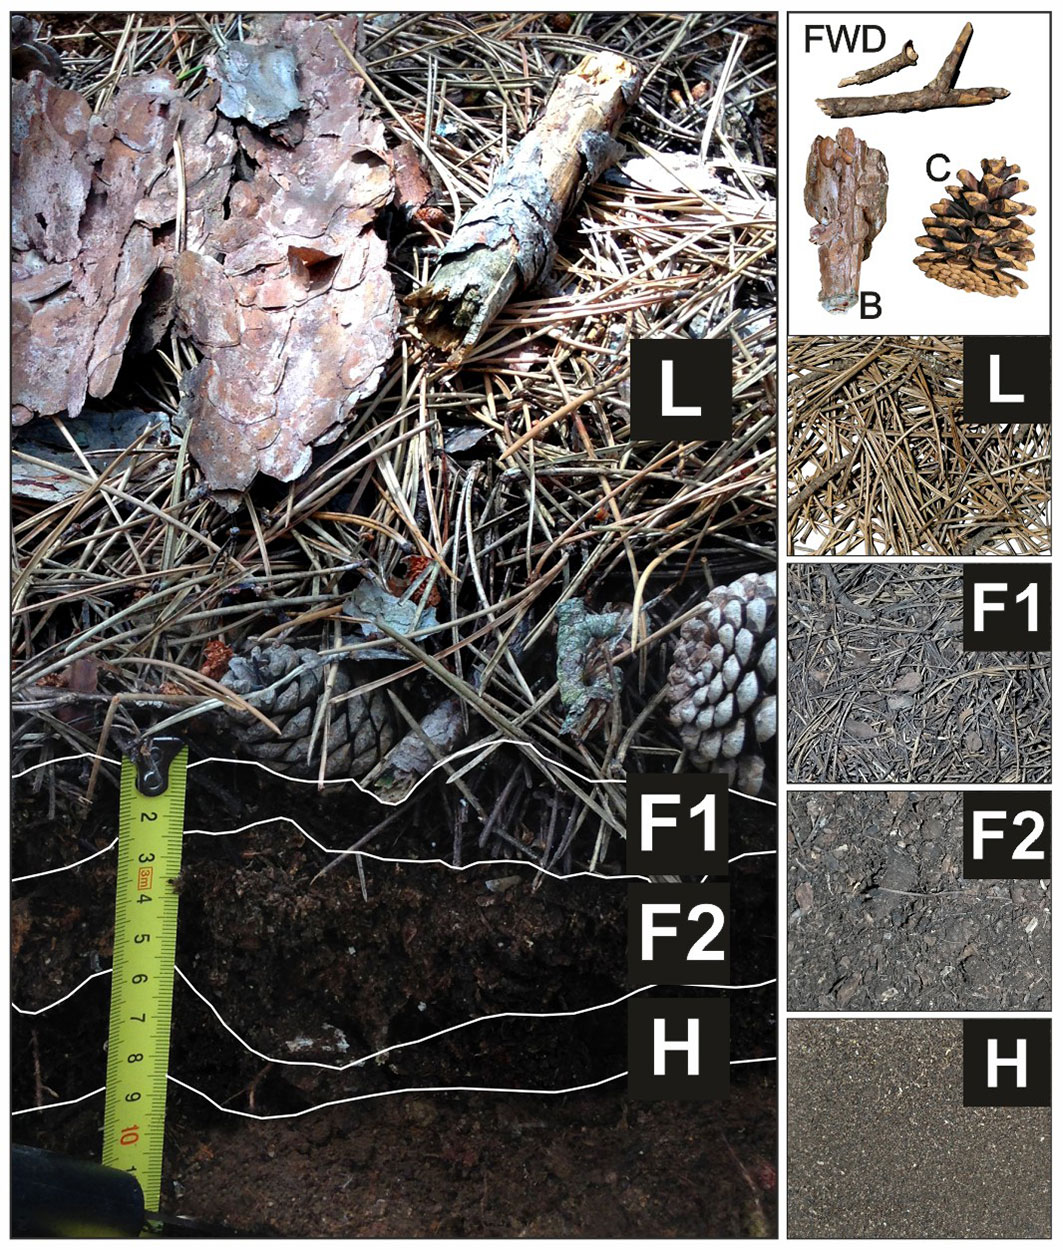
At each forest stand, 10 samples of forest floor (down to mineral soil) were collected on sites that were flat or gently sloping (up to 5°) using destructive sampling. In the old forest stand, the forest floor was sampled near the oldest trees in order to capture the entire range of forest floor properties. At all stands, a 30 × 30 cm frame was used to collect the various layers of forest floor below the tree crowns. Individual samples were located at least 10 m away from one another to reduce risk of spatial autocorrelation of forest floor characteristics ([30]). A total of 30 samples of each layer L, F1, F2 and H (Fig. 1) were collected as described in Schulp et al. ([39]). Fine woody debris (FWD, 0.6-2.5 cm in diameter), bark and cones on the surface of the L layer were collected and weighed separately. In each forest floor sample, the depth of an individual layer was taken to be the average at the midpoint on all four sides of the sampling frame. If certain layers showed depth heterogeneity, such as the F2 and H layers in Fig. 1, three depths were measured on all four sides and averaged to give the final depth.
Fig. 1 - Photographs showing forest floor layers in old black pine forest: (L): litter; (F1): upper fermentation layer; (F2): lower fermentation layer; (H): humus layer. The smaller image at the upper right shows examples of (FWD): fine woody debris; (B): bark; (C): cones.
Separate sampling using 15 × 15 cm frames was performed to determine FFC stock. At each forest stand, 5 samples were taken of each of the layers L, F1, F2 and H.
Laboratory analyses
Samples were oven-dried in the laboratory for 48 h at 100 °C and weighed to the nearest 0.01 g. Forest floor layer depths were combined with the frame dimensions to calculate sample volumes for each layer separately (L, F1, F2 and H). The oven-dried mass of each forest floor layer sample was divided by the sample volume to calculate BD. Mean BD were calculated for each forest floor layer. FFF load was calculated for each sample as the sum of layer loads and was expressed as a dry mass per unit area (Mg ha-1). Mean FFF load was calculated by layer and across all layers at each forest stand. Mean FWD, bark and cone loads were also determined at each forest stand.
All samples for organic carbon (OC) concentration determination were dried at 40 °C, ground using a cutting mill (Retsch SM 100®, Haan, Germany) and sieved through a 2-mm sieve. The mass of the prepared samples ranged from about 20 g for the L layer up to 200 g for F2 and H layers or 500 g for FWD, bark and cones. OC concentration was determined for each forest floor layer and for FWD, bark and cones according to the ISO-10694 ([24]) procedure using a Flash 2000® NC Soil elemental analyser (Thermo Fisher Scientific, Milan, Italy). FFC stocks were calculated by multiplying OC concentration with FFF loads for each forest floor layer, which were then combined into a total FFC stock expressed as a mass of carbon per unit area (Mg C ha-1).
Data analyses
Differences in depths, BD, FFF loads and FFC stocks between the same forest floor layers in different forest stands were assessed using one-way ANOVA. Alternatively, if Levene’s test for homogeneity of variances was statistically significant, then the non-parametric Kruskal-Wallis H test was used. For all statistical tests, a level of 5% was considered as significant.
Regression analysis was used to explore relationships between forest floor depth and associated loads and carbon stocks, for all layers at each forest stand, as well as separately for the layers L and F+H (as duff). The quality of the resulting regression equations (p < 0.001) was assessed using the, mean bias error (MBE), mean absolute error (MAE), root mean square error (RMSE) and coefficient of determination (R²). Statistical analysis was performed using Microsoft Excel® and Statistica® v. 8.0 (StatSoft, Tulsa, OK, USA).
Results
Forest floor depth and bulk density
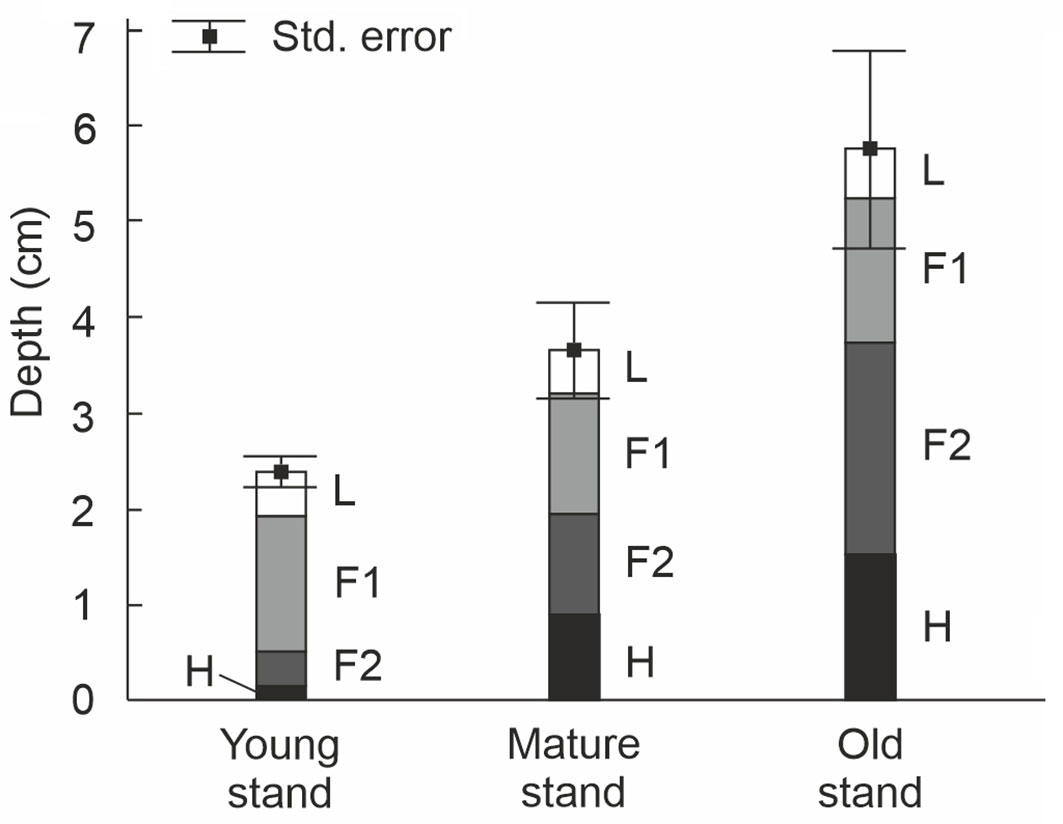
Forest floor depths at the black pine forest stands in this study ranged from 1.5 to 11.5 cm. Average overall forest floor depth increased with stand age: it measured 2.5 ± 0.5 cm (mean ± standard deviation, SD) at the young stand, 3.8 ± 1.5 cm at the mature stand, and 5.9 ± 2.9 cm at the old stand (Fig. 2). The depths of the L and F1 layers did not vary substantially with age, whereas the depths of the F2 and H layers increased with age. F2 depth across the three stands was 0.4 ± 0.3 cm, 1.1 ± 0.4 cm and 2.2 ± 1.4 cm; the value at the old stand was significantly greater than at the other two stands (H[2] = 14.392; p<0.001; N=30). H depth was 0.2 ± 0.2 cm, 0.9 ± 0.6 cm and 1.5 ± 1.4 cm; the latter two values were significantly greater than at the young stand (H[2] = 14.933; p<0.001; N=30 - Fig. 2).
Fig. 2 - Average depths (cm) of the black pine forest floor layers L, F1, F2 and H in young, mature and old stands (N = 10 for each layer). Error bars represent the standard error of the mean values along the entire sampled depth.
BD of the forest floor increased with depth: the L layer was less compacted than the F1 and F2 layers, and the H layer was the densest (Tab. 1). BD in the F1 layer was significantly higher in the old stand than in the young stand (H[2] = 8.286; p = 0.016; N= 30). Average BD for the entire forest floor was 132.2 ± 81.3 kg m-3.
Tab. 1 - Bulk density values per forest floor layers L, F1, F2 and H. Different letters indicate significant differences among forest stands for the F1 layer, based on the Kruskal-Wallis test. (SD): standard deviation; (CV): coefficient of variation.
| Forest stand | N | Layer | Mean (kg m-3) |
Median (kg m-3) |
Min (kg m-3) |
Max (kg m-3) |
SD (kg m-3) |
CV (%) |
|---|---|---|---|---|---|---|---|---|
| All stands | 30 | L | 29.6 | 26.4 | 14.8 | 50.8 | 10.1 | 34 |
| 30 | F1 | 111.0 | 107.8 | 61.1 | 198.1 | 33.0 | 30 | |
| Young stand | 10 | F1 | 93.9 a | 91.9 | 61.1 | 159.8 | 29.5 | 31 |
| Mature stand | 10 | 103.2 ab | 102.8 | 83.9 | 125.3 | 13.9 | 13 | |
| Old stand | 10 | 136.0 b | 123.1 | 83.2 | 198.1 | 36.9 | 27 | |
| All stands | 25 | F2 | 160.5 | 159.4 | 72.9 | 245.4 | 43.9 | 27 |
| 28 | H | 227.6 | 223.8 | 137.6 | 359.3 | 47.3 | 21 |
FFF loads
FFF loads in our study increased with stand age (Tab. 2). FFF load in the F1 layer was significantly higher in the old stand than in the other two stands (F=7.334; p<0.003), as was as the F2 layer (H[2] = 15.429; p<0.001; N=30). FFF load in the H layer was significantly higher in mature and old stands than in the young stand (H[2] = 14.777; p<0.001; N=30). The F2 and H layers showed greater variation in loads than the L and F1 layers in all stands. Depth, FFF load and FFC stock in the H layer correlated with the corresponding parameters in the F2 layer, with respective correlation coefficients (r) of 0.76, 0.68, 0.68 (all p < 0.01).
Tab. 2 - FFF loads, OC concentrations and FFC stocks by layers L, F1, F2, H and in total (all layer loads per sample) for young, mature and old black pine forest stands (N = 10 for each layer). (SD): standard deviation; (CV): coefficient of variation.
| Forest stand |
Layer | FFF load | OC (g kg-1) |
Mean FFC stock (Mg C ha-1) |
|||||
|---|---|---|---|---|---|---|---|---|---|
| Mean (Mg ha-1) |
Median (Mg ha-1) |
Min (Mg ha-1) |
Max (Mg ha-1) |
SD (Mg ha-1) |
CV (%) |
||||
| Young | L | 2.057 | 1.899 | 1.130 | 3.492 | 0.66 | 32 | 538 | 1.107 |
| F1 | 13.283 | 12.264 | 9.172 | 20.778 | 3.87 | 29 | 537 | 7.133 | |
| F2 | 6.031 | 6.306 | 0 | 16.962 | 4.68 | 78 | 459 | 2.768 | |
| H | 3.991 | 2.332 | 0 | 14.931 | 4.48 | 112 | 397 | 1.585 | |
| Total | 25.362 | 23.539 | 11.859 | 47.085 | 10.31 | 41 | - | 12.593 | |
| Mature | L | 1.291 | 1.257 | 0.738 | 2.628 | 0.54 | 42 | 538 | 0.695 |
| F1 | 13.152 | 12.562 | 7.804 | 19.394 | 3.55 | 27 | 537 | 7.063 | |
| F2 | 9.857 | 8.690 | 0 | 28.024 | 10.02 | 102 | 459 | 4.524 | |
| H | 19.620 | 18.553 | 0 | 35.220 | 12.19 | 62 | 397 | 7.789 | |
| Total | 43.920 | 42.226 | 14.292 | 77.244 | 22.91 | 52 | - | 20.071 | |
| Old | L | 1.249 | 1.196 | 0.648 | 1.930 | 0.41 | 33 | 538 | 0.672 |
| F1 | 20.424 | 20.191 | 10.290 | 30.170 | 6.57 | 32 | 537 | 10.968 | |
| F2 | 41.318 | 27.516 | 15.939 | 92.450 | 27.18 | 66 | 459 | 18.965 | |
| H | 32.909 | 18.976 | 13.383 | 104.749 | 28.67 | 87 | 397 | 13.065 | |
| Total | 95.900 | 81.838 | 46.248 | 197.347 | 51.65 | 54 | - | 43.670 | |
Loads of FWD, bark and cones also increased with stand age and generally showed higher coefficients of variation than forest floor layers (Tab. 3).
Tab. 3 - Fine woody debris (0.6-2.5 cm in diameter), bark and cone loads, and their OC concentrations and C stocks in young, mature and old black pine forest stands (N = 10). (FWD): Fine woody debris; (B): bark and (C): cone.
| Stand Age | Sample | Mean (Mg ha-1) |
Median (Mg ha-1) |
Min (Mg ha-1) |
Max (Mg ha-1) |
SD (Mg ha-1) |
CV(%) | OC (g kg-1) |
Mean C stock (Mg C ha-1) |
|---|---|---|---|---|---|---|---|---|---|
| Young | FWD | 1.238 | 0.630 | 0 | 4.402 | 1.50 | 121 | 534 | 0.661 |
| B | 0.084 | 0.000 | 0 | 0.297 | 0.14 | 161 | 530 | 0.045 | |
| C | 0.720 | 0.882 | 0 | 1.716 | 0.68 | 94 | 539 | 0.388 | |
| Total | 2.043 | 1.165 | 0.733 | 5.156 | 1.67 | 82 | - | 1.094 | |
| Mature | FWD | 1.938 | 0.399 | 0 | 9.130 | 3.41 | 176 | 534 | 1.035 |
| B | 0.255 | 0.119 | 0 | 0.818 | 0.30 | 119 | 530 | 0.135 | |
| C | 5.492 | 4.367 | 0 | 13.777 | 5.04 | 92 | 539 | 2.960 | |
| Total | 7.685 | 4.367 | 0.738 | 22.392 | 8.13 | 106 | - | 4.130 | |
| Old | FWD | 3.424 | 3.571 | 0.626 | 6.602 | 2.27 | 66 | 534 | 1.828 |
| B | 0.764 | 0.451 | 0 | 3.064 | 0.91 | 119 | 530 | 0.405 | |
| C | 12.114 | 11.661 | 4.473 | 22.566 | 5.74 | 47 | 539 | 6.529 | |
| Total | 16.302 | 17.274 | 8.028 | 23.702 | 5.66 | 35 | - | 8.763 |
Organic carbon concentrations and carbon stocks
To estimate FFC stocks more accurately, OC concentrations were determined separately for each forest floor layer and separately for FWD, bark and cones. Average OC concentrations (mean ± SD) were significantly higher in the L layer (538 ± 6 g kg-1) and F1 layer (537 ± 7 g kg-1) than in the F2 layer (459 ± 40 g kg-1) and H layer (397 ± 44 g kg-1) (H[3] = 47.034; p < 0.001; N=60 - Tab. 2). OC concentrations in FWD (534 ± 7 g kg-1), bark (530 ± 13.5 g kg-1) and cones (539 ± 8 g kg-1) were similar to those in the L and F1 layers (Tab. 3). OC concentrations were used to calculate carbon stocks for each layer separately. FFC stock ranged from 6.4 Mg ha-1 in the young stand to 85.8 Mg C ha-1 in the old stand. Since carbon stocks depend on loads, they showed the same relationship with age as FFF loads did. The old stand showed significantly higher carbon stocks than the other two stands in the F1 layer (H[2] = 8.454; p = 0.015; N=30) and F2 layer (H[2] = 15.429; p < 0.001; N=30). The mature and old stands showed significantly higher carbon stock than the young stand in the H layer (H[2] = 14.777; p<0.001; N=30). Average OC concentration for the entire forest floor was 483 ± 67 g kg-1.
Estimating FFF loads and FFC stocks
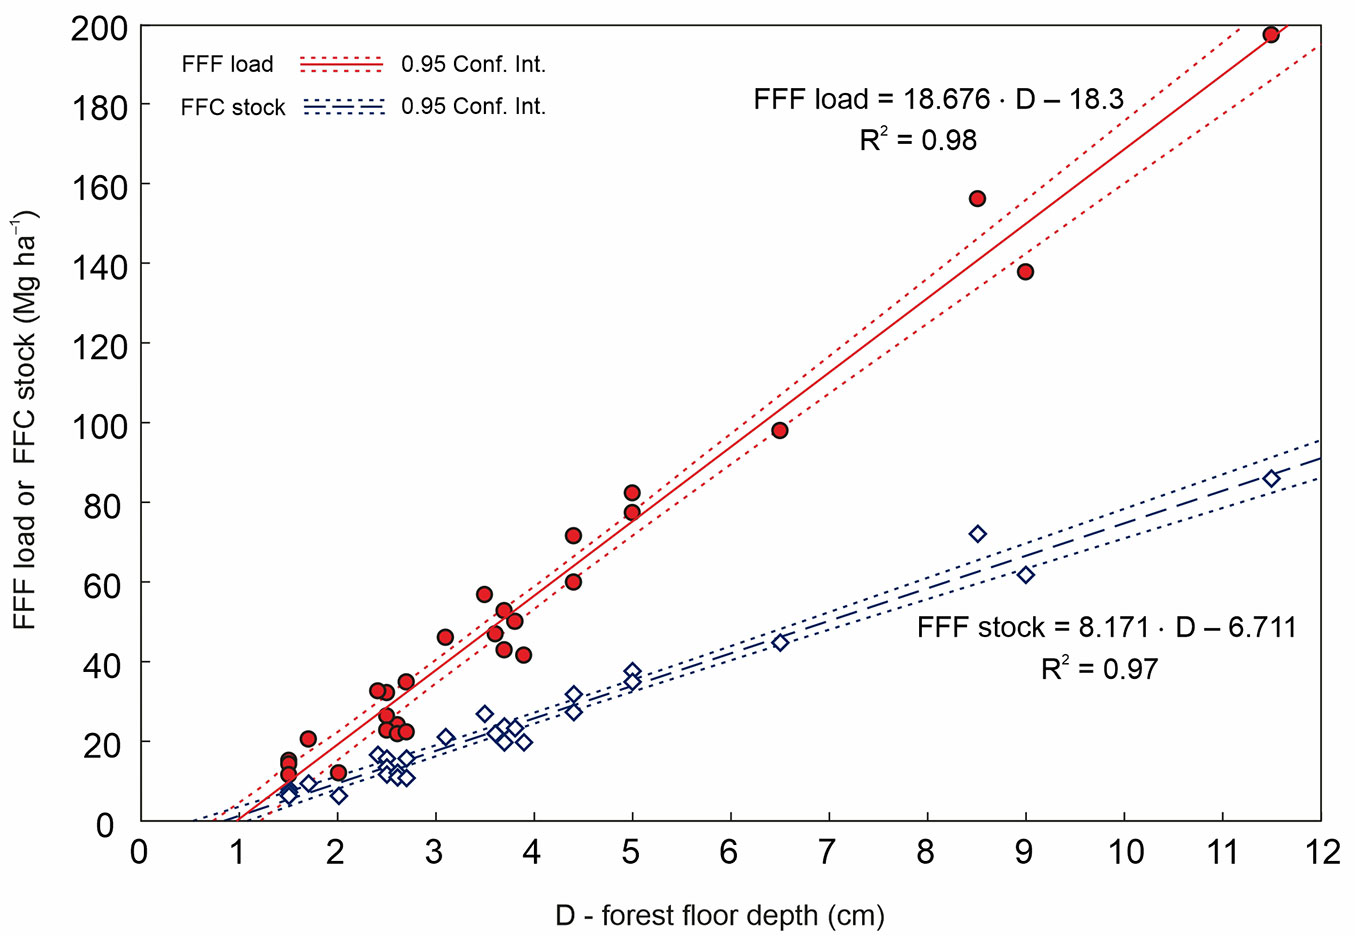
Simple linear regression of FFF loads and FFC stocks was performed for the L layer (regression equations no. 1 and 2 - Tab. 4) or for the F (F1+F2) and H layers together (regression equations no. 3 and 4 - Tab. 4), or for the entire forest floor (regression equations no. 5 and 6 - Tab. 4, Fig. 3). When the forest floor was deeper than 1.5 cm, regression-based estimates of FFF loads and FFC stocks for the entire forest floor were similar to the sum of separate estimates for the L layer and F+H layers. When the floor was shallower than 1.5 cm, regressions did not generate reasonable estimates for F+H layers or for the entire forest floor. The y-intercept in our regression models was negative, leading to underestimates of FFF loads and FFC stocks.
Tab. 4 - Regression equations for estimating FFF loads and FFC stocks as a function of forest floor depth (ranging from 1.5 cm to 11.5 cm). (LF load): litter fuel load (Mg ha-1); (LC stock): litter carbon stock (Mg ha-1); (FHF load): fuel load in F and H layers (Mg ha-1); (FHC stock): carbon stock in F and H layers (Mg ha-1); (FFF load): forest floor fuel load (Mg ha-1); (FFC stock): forest floor carbon stock (Mg ha-1); (D): forest floor depth (cm); (MBE): mean bias error; (MAE): mean absolute error; (RMSE): root mean square error; (R2): coefficient of determination; (SEx): standard error of the regression coefficient; (SEi): standard error of the intercept.
| No | Regression equations | Statistical parameters | ||||||
|---|---|---|---|---|---|---|---|---|
| SEx | SEi | p | MBE | MAE | RMSE | R2 | ||
| 1 | LF load = 2.986 · D | 0.195 | - | < 0.001 | - 0.024 | 0.409 | 0.527 | 0.38 |
| 2 | LC stock = 1.597 · D | 0.108 | - | < 0.001 | - 0.014 | 0.238 | 0.297 | 0.38 |
| 3 | FHF load = 19.145 · D - 11.774 | 0.531 | 2.124 | < 0.001 | - 0.001 | 5.171 | 6.287 | 0.98 |
| 4 | FHC stock = 8.378 · D - 3.985 | 0.270 | 1.099 | < 0.001 | - 0.001 | 2.542 | 3.185 | 0.97 |
| 5 | FFF load = 18.676 · D - 18.3 | 0.585 | 2.650 | < 0.001 | 0.001 | 5.640 | 6.795 | 0.98 |
| 6 | FFC stock = 8.171 · D - 6.711 | 0.276 | 1.251 | < 0.001 | 0.161 | 2.827 | 3.420 | 0.97 |
Fig. 3 - Regression equations for estimating FFF loads and FFC stocks as a function of forest floor depth at depths of 1.5-11.5 cm. The thin dashed lines around the thicker lines indicate the 95% confidence interval (Conf. Int.).
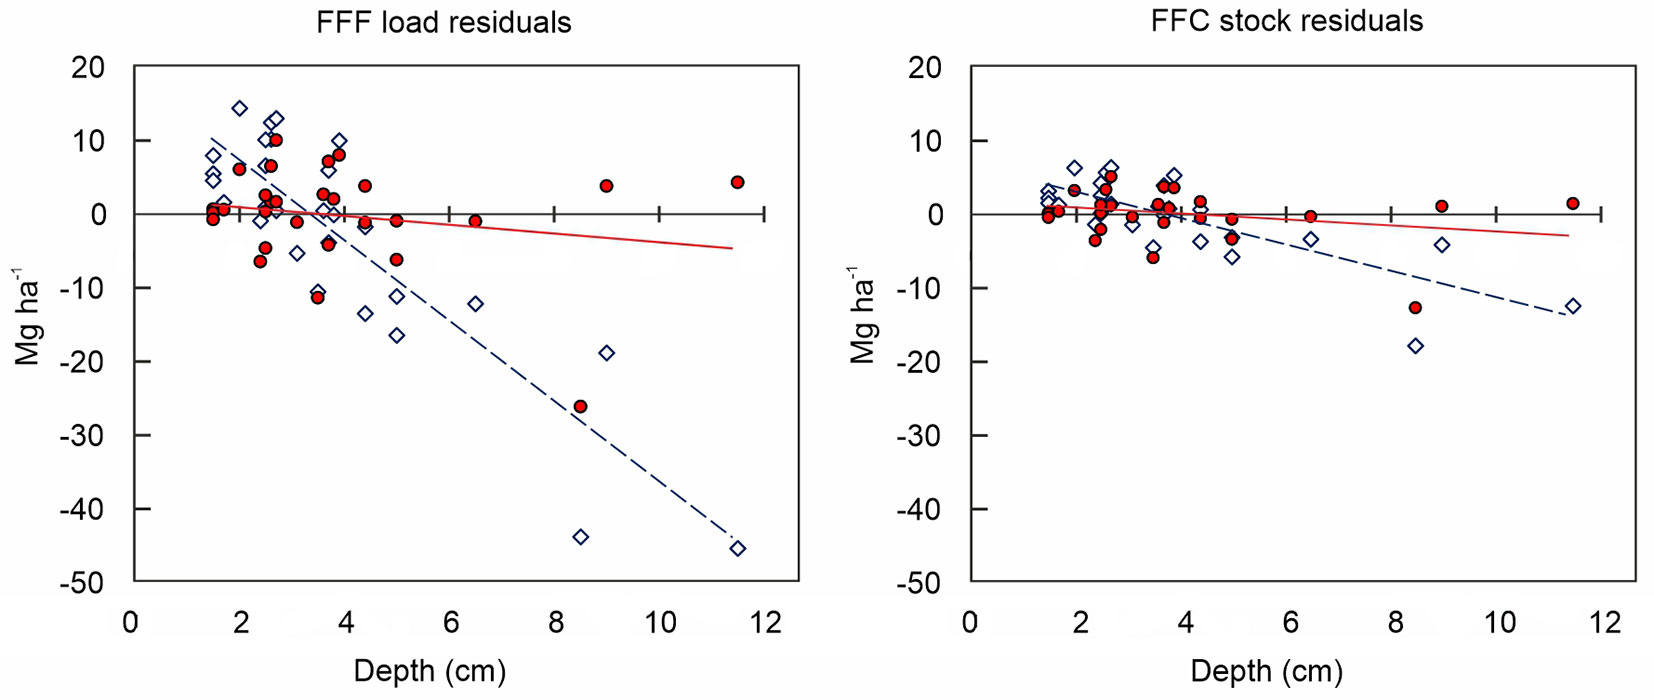
Tab. S1 (Supplementary material) provides FFF loads and FFC stocks calculated using BD and OC concentrations per forest floor layer (equations no. 1 and 2 - Tab. S1), or calculated using mean BD (132.2 kg m-3) and OC concentration (483 g kg-1) for the entire forest floor (equations no. 3 and 4 - Tab. S1). According to statistical parameters (Tab. S1 in Supplementary material) estimates of FFF load and FFC stock based on BD and OC concentrations per forest floor layer were more accurate than those based on regression equations, and far more accurate than those based on BD and OC concentration for the entire forest floor (Fig. 4).
Fig. 4 - Residual values for FFF loads and FFC stocks estimated either using BD and OC concentrations per forest floor layer (red circles), or using mean BD and mean OC concentration for the entire forest floor (blue diamonds).
Discussion
Our study suggests that Dalmatian black pine forests contain substantial FFF loads and FFC stocks (Tab. 2). Compared to the young stand in our study, FFF load was 1.7 times higher in the mature stand and 3.8 times higher in the old stand, while FFC stock was 1.6 and 3.5 times higher, respectively. The age-dependent increases in FFF load and FFC stock were not identical because decomposing materials accumulate in the F2 and H layers, which have significantly lower OC concentration, in turn affecting the total FFC stock. Stand age did not significantly affect FFF load or FFC stock in the litter layer (excluding FWD, bark or cones). The F1 and F2 layers showed significantly higher loads at the old forest stand than at the young and mature stands, reflecting larger amounts of woody fuel particles, bark and especially cones in the old stand. These heavier particles substantially increase BD. Indeed, the load of FWD, bark and cones in the old stand was 16.3 Mg ha-1 (74% of which was due to cones), which is much higher than in young and mature stands (Tab. 3). Increasing cone abundance on the forest floor can facilitate ignition of intermixed forest floor fuels, leading to taller flame heights and longer flaming duration ([29]). The survival of large, mature black pine trees is essential for successful post-fire regeneration as they serve as seed sources ([9]). During periods of hot and dry weather, accumulated large amounts of forest floor (as reflected in our old stands - Tab. 2) significantly increase the potential for high severity wildfires and exacerbate their effects on forest ecosystems. Fuel reduction treatments such as thinning, raking, and controlled burning should be considered at these stands in order to reduce fire hazard by reducing fuel loading. The high value of these trees in endemic black pine forests is reflected in their status as a priority habitat under the EU Habitats Directive ([47]).
Since we were unable to find closely related studies, we can make only general comparisons with studies of other European black pine. In doing so, we emphasize that inter-study comparisons of FFF loads and FFC stocks are not straightforward due to the many sources of variability, including sampling and analytical methods ([39], [26], [30]). FFF loads at the young black pine stand in our study are comparable to those reported at low site quality stands in Greece ([25]), while the FFF loads at the mature stand in our study are comparable to those reported in Greece ([37]) and Portugal ([16]). Considering similar FFF loads and OC concentration in forest floor layers, FFC stocks at our young stand are comparable to those of black pine plantations in Spain ([18]), while FFC stocks at our mature stand are comparable to those in Portugal ([16]).
We were unable to find published FFF loads for old black pine forests that we could compare with our results, though we can compare our measurements to those that we obtained, using the same methods, in Aleppo pine stands ([1]). Black pine forests occur above Aleppo pine forests in coastal areas. Although the two types of pines showed similar average FFF loads and FFC stocks within the same age classes, BD was significantly higher for black pine and therefore so was FFF load at a given depth. In fact, black pine showed higher OC concentration in the L layer (by 0.8%), F layer (by 9%) and H layer (by 5%).
The coefficients of variation for FFF load in this study ranged from 27 to 112%, simi- lar to variation observed in other studies ([39], [11], [31], [26], [32], [38]).
The results in Tab. S1 and Fig. 4 support the idea that separating forest floor layers improves estimation of FFF loads and FFC stocks, reflecting inter-layer differences in BD and OC concentration ([6], [41], [39], [8]). Our observation of increasing BD with forest floor depth has also been reported by studies examining litter and duff separately ([44]), each forest floor layer separately ([3], [14]), or forest floor strata ([42]). Forest floor densities that we measured here for black pine are quite similar to those reported for coniferous species for each of the individual layers (L = 17.9 kg m-3; F1 = 118.3 kg m-3; F2 = 203.4 kg m-3; H = 232.5 kg-3 - [39]).
Our layer-based analysis showed that average OC concentrations were significantly higher in L and F1 layers than in F2 and H layers. Using layer-specific estimates is likely to be much more accurate than using the default factor of 0.37 for dry forest floor mass to C conversion ([21], [22]), as proposed by Smith & Heath ([41]) and confirmed by De Vos et al. ([13]). Using this IPCC factor in our case of black pine would reduce FFC stock by 25% in our young stand and by 19% in mature and old stands.
Our study provides the first regression equations and BD values (together with OC concentrations) needed for FFF load and FFC stock estimation in Dalmatian black pine.
Simple linear regression is commonly used to convert forest floor depth to FFF load ([17], [27], [15]) and C stock ([7]). Indeed, it proved to be the best choice in the present study, giving better BIAS, MAE, and RMSE than quadratic polynomial, cubic polynomial, or power regression equations (not shown). In the end, we selected a simple linear equation with no intercept (y=0) for the L layer (equations no. 1-2 - Tab. 4), whereas we chose a simple linear equation with calculated intercept for the F+H layers (equations no. 3-4 - Tab. 4) and for the entire forest floor (equations no. 5-6 - Tab. 4). Regression equations are straightforward for estimating total FFF load and FFC stocks and already include the relationship between the depths of individual layers and related loads, as well as the OC concentrations and carbon stocks.
The regression equations derived here can be used for forest floor depths ranging from 1.5 cm to 11.5 cm. Further work should obtain data for forest floors shallower than 1.5 cm. When the forest floor is shallower than 1.5 cm, we suggest using BD and OC concentrations per forest floor layer to calculate FFF load and FFC stock (equations 1 and 2, respectively - Tab. S1 in Supplementary material). This approach is likely to give more accurate results and can be applied to all forest floor depths. However, this approach is time-consuming because it requires establishing the depth of each forest floor layer, which in turn requires specialized training in forest floor morphology. We advise against estimating FFF loads and FFC stocks using mean BD and OC concentration for the entire forest floor because this approach leads to underestimation that worsens with increasing depth (Fig. 4).
The results presented here are suitable for forest floor fuel mapping and quantification of FFF loads and FFC stocks based on depth. Fuel depth is measured easily, avoiding the need for time-consuming collection, weighing and laboratory analysis of large amounts of forest floor fuels. Spatial distribution of FFF loads and FFC stocks can be assessed simply by measuring forest floor depths. Most fire behaviour and effects models require separate litter and duff inputs so those models can be used with the proposed equations by researchers and fire managers.
Further work should explore the applicability of our models to other sub-Mediterranean black pine forests, since even stands of the same species in adjacent forests can differ in forest floor loads and BD as a result of variation in climate, soil, biomass production, and rates of litter deposition and decomposition ([17], [39], [26], [30]).
Conclusions
Analysis of FFF loads is important for many forest management applications, especially those related to fire management and carbon balance. Our work suggests that sampling individual layers of the forest floor and determining their OC concentrations leads to more accurate calculations of BD and therefore of FFF loads and FC stocks.
Here we developed regression equations that relate forest floor load in black pine stands to their depth, as well as equations that use BD and depth per layer to quickly estimate FFF load. These equations, together with the OC concentrations determined here for individual forest floor layers, simplify estimations of FFC stocks.
The best estimates of FFF loads and FFC stocks were obtained by using depth, BD and OC concentrations per layer. The regression equations developed here provide similar estimates as equations that rely on BD and can be used for forest floor depths ranging from 1.5 cm to 11.5 cm.
Our results suggest that older, undisturbed stands of black pine have particularly large FFF loads and FFC stocks. Our approach may be applicable to similar sub-Mediterranean black pine forests, although its generalisability should be verified through site-specific testing.
Acknowledgments
Funding for this study was provided by the Scientific Research Program of Croatian Forests Ltd. (2011-2015) in the form of a scholarship to NB.
References
Gscholar
Gscholar
CrossRef | Gscholar
Gscholar
Gscholar
Gscholar
Gscholar
Gscholar
Online | Gscholar
Authors’ Info
Authors’ Affiliation
Darko Bakšić
University of Zagreb, Faculty of Forestry, Svetošimunska cesta 23, 10002 Zagreb (Croatia)
Corresponding author
Paper Info
Citation
Bakšić N, Bakšić D (2020). Estimation of fuel loads and carbon stocks of forest floor in endemic Dalmatian black pine forests. iForest 13: 382-388. - doi: 10.3832/ifor3184-013
Academic Editor
Rossella Guerrieri
Paper history
Received: Jul 04, 2019
Accepted: Jun 27, 2020
First online: Sep 01, 2020
Publication Date: Oct 31, 2020
Publication Time: 2.20 months
Copyright Information
© SISEF - The Italian Society of Silviculture and Forest Ecology 2020
Open Access
This article is distributed under the terms of the Creative Commons Attribution-Non Commercial 4.0 International (https://creativecommons.org/licenses/by-nc/4.0/), which permits unrestricted use, distribution, and reproduction in any medium, provided you give appropriate credit to the original author(s) and the source, provide a link to the Creative Commons license, and indicate if changes were made.

Web Metrics
Breakdown by View Type
Article Usage
Total Article Views: 39674
(from publication date up to now)
Breakdown by View Type
HTML Page Views: 33155
Abstract Page Views: 2829
PDF Downloads: 2860
Citation/Reference Downloads: 6
XML Downloads: 824
Web Metrics
Days since publication: 2127
Overall contacts: 39674
Avg. contacts per week: 130.57
Article Citations
Article citations are based on data periodically collected from the Clarivate Web of Science web site
(last update: Mar 2025)
Total number of cites (since 2020): 2
Average cites per year: 0.33
Publication Metrics
by Dimensions ©
Articles citing this article
List of the papers citing this article based on CrossRef Cited-by.
Related Contents
iForest Similar Articles
Research Articles
Fuel characterization and crown fuel load prediction in non-treated Calabrian pine (Pinus brutia Ten.) plantation areas
vol. 15, pp. 458-464 (online: 03 November 2022)
Research Articles
Effects of tree species, stand age and land-use change on soil carbon and nitrogen stock rates in northwestern Turkey
vol. 9, pp. 165-170 (online: 18 June 2015)
Research Articles
Carbon storage and soil property changes following afforestation in mountain ecosystems of the Western Rhodopes, Bulgaria
vol. 9, pp. 626-634 (online: 06 May 2016)
Research Articles
Effects of black locust and black pine on extremely degraded sites 60 years after afforestation - a case study of the Grdelica Gorge (southeastern Serbia)
vol. 9, pp. 235-243 (online: 22 August 2015)
Research Articles
Fuel consumption comparison of two forwarders in lowland forests of pedunculate oak
vol. 12, pp. 125-131 (online: 11 February 2019)
Research Articles
Soil stoichiometry modulates effects of shrub encroachment on soil carbon concentration and stock in a subalpine grassland
vol. 13, pp. 65-72 (online: 07 February 2020)
Short Communications
Variation in soil carbon stock and nutrient content in sand dunes after afforestation by Prosopis juliflora in the Khuzestan province (Iran)
vol. 10, pp. 585-589 (online: 08 May 2017)
Research Articles
Effects on soil characteristics by different management regimes with root sucker generated hybrid aspen (Populus tremula L. × P. tremuloides Michx.) on abandoned agricultural land
vol. 11, pp. 619-627 (online: 04 October 2018)
Research Articles
Allometric equations to assess biomass, carbon and nitrogen content of black pine and red pine trees in southern Korea
vol. 10, pp. 483-490 (online: 12 April 2017)
Research Articles
Thinning effects on soil and microbial respiration in a coppice-originated Carpinus betulus L. stand in Turkey
vol. 9, pp. 783-790 (online: 29 May 2016)
iForest Database Search
Search By Author
Search By Keyword
Google Scholar Search
Citing Articles
Search By Author
Search By Keywords
PubMed Search
Search By Author
Search By Keyword


