Long-term effects of thinning and mixing on stand spatial structure: a case study of Chinese fir plantations
iForest - Biogeosciences and Forestry, Volume 14, Issue 2, Pages 113-121 (2021)
doi: https://doi.org/10.3832/ifor3489-014
Published: Mar 08, 2021 - Copyright © 2021 SISEF
Research Articles
Abstract
The regular planting and periodic harvesting of a single tree species are features of plantations, which are associated with a reduction of biodiversity. Such plantations are strongly encouraged to be converted into mixed forests. However, the spatial structure dynamics of plantations during the conversion process are poorly understood. In subtropical regions, thinned forest of Chinese fir (Cunninghamia lanceolata [Lamb.] Hook.) and mixed forest of Chinese fir and Michelia macclurei Dandy are considered two ideal modes of plantation management. In this study, we analyzed the spatial structure dynamics of two forest stands and their six main tree populations over a rotation of 27 years, using spatial point analyses. We found that Chinese fir and M. macclurei had a regular distribution pattern (scale, r = 0-1 m) in the early stages of planting (1993), and Chinese fir maintained this pattern after experiencing self-thinning and selective cutting. In addition, non-planted tree species (i.e., natural regeneration of late-seral species, NRLSS) displayed significantly intraspecific clumping, which resulted in the distribution patterns of the forest stands changing from regular to aggregated (r = 0-5.5, 1-20 m), and the species distribution of mixed forest changed from random to clumped (r = 0-20 m). Moreover, during the management period (1993-2018), individuals were significantly differentiated in terms of size, and some small trees in the thinned forest were aggregated together. For the NRLSS, the diameter at breast height was randomly distributed (r = 0-20 m). Furthermore, Chinese fir and M. macclurei were separated at r = 0-1 m in the planting stage, but any pair of the six main populations in the thinned forest and mixed forest were randomly correlated over a rotation. Finally, the nearest neighbor distance of the stands became shorter after conversion, while the values for Chinese fir increased. After 25 years, the mixed plantation and the thinned plantation had a complex spatial structure. They develop towards natural forests and could be used as a template for future plantation management.
Keywords
Chinese Fir, Distribution Pattern, Mixed Forest, Plantation, Spatial Correlation, Thinning
Introduction
With the global decrease in natural forest resources, plantations play an increasingly important role in easing the conflict between wood supply and demand, increasing incomes from forestry, and protecting the natural environment ([42], [32], [26]). The traditional model of plantation management is intensive, i.e., a monoculture with regular rows. This has widely been adopted to provide the maximum growing space for any tree, with the planting regime designed as far as possible to avoid competition in the early growth stage. The management process mainly focuses on nonspatial structure indicators that are closely related to wood harvest (e.g., stand density, diameter at breast height [DBH], tree height, basal area or stand stock - [23]). This management model might be appropriate for a short-term rotation forest, but it has been widely criticized for neglecting biodiversity, and conversion into mixed forest has been proposed to address this ([7], [48], [26], [44]). At the same time, a growing number of studies, including those conducted in natural/semi-natural forest plantations, have indicated that the spatial structure of forest stands (e.g., spatial correlation, tree location, species mixture, size differentiation, and other indicators related to the distance between trees) is equally important for tree growth and community stability ([6], [35], [23], [13]). More attention should be given to the spatial structure of plantations, particularly in the cultivation process.
Thinning and mixing are often used in forest management to transform the spatial structure of monoculture plantations ([51], [44], [52], [10]). Thinning directly reduces stand density, improves environmental conditions, promotes litter decomposition and growth of residuals, and increases stand volume and understory regeneration ([39], [23], [16], [48]). Mixing takes advantage of the complementation/differences in species demands for habitat (e.g., light dependence - [36], [26]), nutrient consumption ([50]), and growth rhythms ([8], [4], [40]). Both thinning and mixing can have a profound impact on forest dynamics, and are conducive to the formation of forest structure and species diversity ([15], [7], [42], [48], [10]). Most previous studies have explored the characteristics of plant species diversity, growth ([41], [30]), carbon storage ([52]), photosynthesis ([24]), soil nutrient cycles, microbial diversity ([8], [40], [45], [51]), and small animals such as insects and birds ([7], [42]) in the period immediately after plantations were thinned or mixed. Only a few studies have considered the spatial structure of plantations at stand level ([6], [35], [54]). Detecting the influence of thinning and mixing on the spatial structure of plantations on a long-term scale could achieve a more suitable management method.
Chinese fir (Cunninghamia lanceolata [Lamb.] Hook, Taxodiaceae) is one of the most widely planted coniferous species in subtropical regions (102°-122° E, 21° 41′-33° 41′ N), accounting for 24% of China’s plantation area and 6.1% of the global plantation area ([8], [26]). However, with the increase in planting area and generations of continuous planting of Chinese fir in the collective forest regions of South China, the accumulation of toxic substances in soil, the decrease in the speed of nutrient biochemical cycles, the reduction of the microbial community and its activity, and the aggravation of pests and diseases, there has been a decline in forest productivity in many areas ([4], [40]). Some plantations have become typical old-aged and small-sized stands, which seriously threaten the sustainability of Chinese fir plantations. It is believed that establishing mixed forests of Chinese fir and broad-leaved species is an ideal way to solve this problem ([3], [26]). Many studies have considered a move away from unreasonable modes of planting (e.g., monocultures and continuous planting) and harvesting (e.g., clear cutting), and have used test methods such as closing access to a mountain for afforestation ([3]), extending the rotation time ([21], [20]), thinning (a popular management method in some locations - [49], [39], [41], [52]), and mixing Chinese fir and other indigenous species, e.g., M. macclurei, Mytilaria laosensis Lec., Manglietia yuyuanensis Law, Schima superba Gardn. & Champ., Liquidambar formosana Hance, Fokienia hodginsii (Dunn) Henry et Thomas, and Phyllostachys heterocycla (Carr.) Mitford cv. Pubescens Mazel ex H.de leh ([8], [53], [26], [52]). Chinese fir and M. macclurei mixed forests are a high productivity forest model ([8], [4]). However, we know little about the spatial structure of the mixed forest and Chinese fir thinned forest, particularly their dynamics over a rotation (e.g., 20 years).
In our experience, postponing the year of harvesting will likely promote the occurrence of other tree species (hereafter, natural regeneration of late-seral species, NRLSS). This may reduce the distances between nearest neighbors (hypothesis 1). Thinning will likely also change the distribution pattern of the planted trees. Therefore, we assumed that the degree of regularity of the distribution pattern in the thinned forest and mixed forest will decrease over a rotation (hypothesis 2). NRLSS in the stands might then be affected by the superior species from the upstory ([7], [16]), i.e., a nonrandom correlation (hypothesis 3) should be found between NRLSS and the planted species (Chinese fir and M. macclurei). We used data collected from the planting area of Chinese fir to test these hypotheses.
Materials and methods
Overview of sub-compartment management
Our study site was located in Binqiao Township, Longzhou County, Pingxiang City, southwest China. It was part of the Experimental Center of Tropical Forestry of the Chinese Academy of Forestry and was close to the boundary with Lanson, north Vietnam. This region has a typical subtropical climate, with abundant rainfall and heat resources. Its average annual temperature is 19.5-21.5 °C and average annual rainfall is around 1200-1500 mm. The terrain is dominated by hills, with the highest peak in the region being 1046 m a.s.l. in the Daqing Mountains, where the relative elevation difference is 916 m ([3], [41]). The soil at the study site is a weakly acidic mountain red soil, with a thickness of more than 80 cm. Plantation management and scientific research have been conducted in this area for nearly half a century, and Chinese fir and Masson pine (Pinus massoniana Lamb.) are the main afforestation species. The management unit of a Chinese fir plantation in this area is based on the sub-compartment system (also called a forest stand or alpha level), i.e., all practices taken in a sub-compartment are exactly the same. Many plantations have been established and harvested for 2-3 generations. Scientific research has mainly concentrated on mixed forest management, monoculture plantation thinning, close-to-nature forest management, and soil nutrient cycling ([27], [41], [12], [28]).
Plot establishment
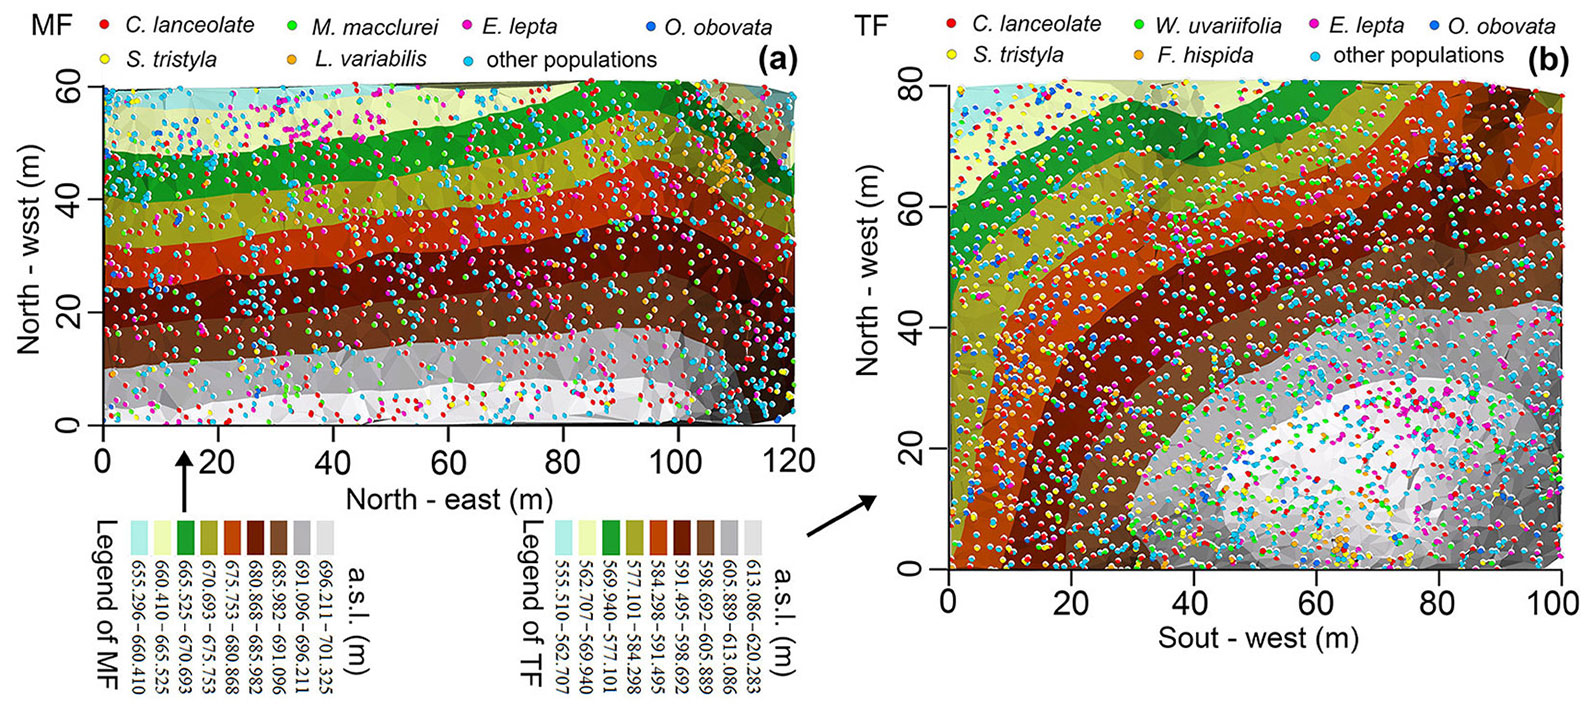
According to previous studies ([8], [4]), a Chinese fir and M. macclurei mixed forest was cultivated in the 4th sub-compartment of the 3rd compartment on a mountainside location (106° 42′ 16″ E, 22° 18′ 09″ N) in the spring of 1991. Similar-sized Chinese fir and M. macclurei seedlings (height ≈ 50 cm) were randomly mixed in a 6:1 ratio and then planted. The planting row spacing was kept as consistent as possible. The primary density was about 2000 plants ha-1, with an 87% survival rate after 2 years (1993). During the same period, a monoculture of Chinese fir was cultivated in the 3rd sub-compartment of the 6th compartment (106° 42′ 48″ E, 22° 17′ 44″ N). It was about 900 m from the mixed forest, with the same planting pattern and preservation rate. A thinning was applied in 2008, reducing tree density by 26%, with a total of 631 trees (DBH ≥ 9 cm) removed, after which there was no human-made disturbance. Two rectangular fixed plots, with areas of 100 × 80 m and 120 × 60 m, in the above sub-compartments were established in 2018-2019 (Fig. 1). First, a total station (model NTS-372R10, South Surveying & Mapping Company, Guangzhou, China) was used to confirm the outline border and locations (x, y, z) of living trees (DBH ≥ 1 cm, height of tree ≥ 1.3 m), coarse dead wood (DBH ≥ 1 cm, length/height ≥ 1.3 m), and stumps. Then species were identified and living trees were tagged.
Fig. 1 - The terrain of Chinese fir plantations and tree location patterns in the sub-compartments. The mixed forest (MF) was located on a large, gentle slope, while the thinned forest (TF) was located on the top of a hill. The colored points represent the six main tree species and the background colors indicate height above sea level (a.s.l.), which gradually decreased as the color changed from white to light blue.
A total of 1909 and 3084 living trees, and 558 and 857 dead trees, belonging to 79 and 58 species, were investigated in the mixed forest and thinned forest, respectively. Among them, Chinese fir, M. macclurei, Evodia lepta (Spreng.) Merr., Saurauia tristyla DC., Ficushispida Linn., Wendlandia uvariifolia Hance, Litsea variabilis Hemsl., and Oreocnide obovata (C. H. Wright), and Merr. var. mucronata C. J. Chen were the main species. The coverage of the understory herb in both plots (thinned forest, mixed forest) was greater than 95%. They were mainly made up of Woodwardia japonica (L. f) Sm., Dryopteris atrata (Kunze) Ching, Angiopteris fokiensis Hieron., Costus speciosus (Koen.) Smit, Musa balbisiana Tutch., and Amischotolype hispida (Less. & Rich.) Hon. (Tab. S1 in Supplementary material).
Data analyses
After conversion into a mixed forest, the structure of Chinese fir stands will become more complex. The pair correlation function (PCF) can combine the individual distribution of trees and the distance between them to reveal the ecological process behind the distribution pattern ([11], [33], [9], [18], [47], [29]). The spatial scale of this study was limited to the stand level, which implies that the role of habitat heterogeneity in ecological processes might be very limited. Therefore, complete spatial randomness (CSR) was directly taken as the null model of the univariate distribution of the PCF, g(r) ([29]), to analyze the distribution patterns of the thinned forest and mixed forest stands, their six main populations, and the cutting wood. At the same time, random labeling was taken as the null model of g11(r) -g22(r) to detect any changes in the distribution pattern before and after management ([47]). The independence of components was adopted as the null model of the bivariate distribution of PCF, g12(r) ([2]), to analyze the spatial correlation between Chinese fir and M. macclurei in the mixed forest at the early planting stage, and the spatial correlation between any two populations (N ≥ 40) in the mixed forest and thinned forest over a rotation (2018). The mark correlation function was used to analyze the spatial distribution of tree species in the mixed forest at the initial stage of planting and species in the mixed forest and thinned forest in 2018 ([33], [2], [47]). The mark variogram function was used to analyze the spatial distribution of DBH in the thinned forest and mixed forest stands and their six main populations over a rotation (2018 - [6], [34]). In the process of point pattern analyses, the Monte Carlo (MC) method was used to simulate the observed values at r = 0-20 m 199 times and preliminarily confirm the random interval, then a goodness of fit was applied to test and correct the result of the simulation, to eliminate and type I errors ([47]). In addition, Dk(r) was used to analyze the cumulative distribution of the nearest neighbor distance (NND) of the thinned forest and mixed forest and their six main populations (k = 1, 2, 4, 6, 8, 10, and 12 - [29]). Data analyses were conducted using the “spatstat” package ([2]) of the R software environment ([37]).
Results
Distribution patterns and tree marks at the stand level
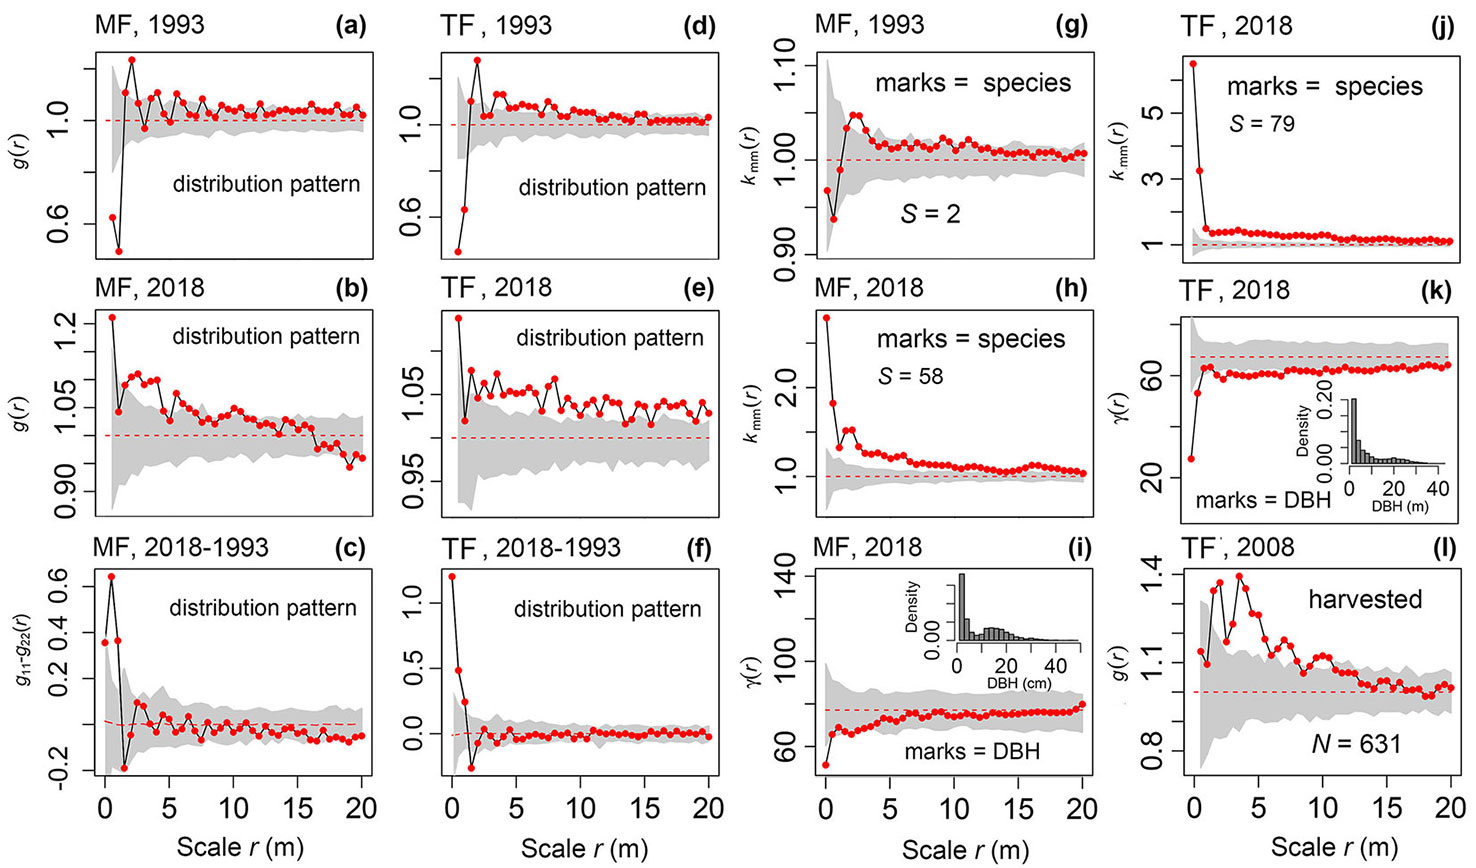
At the beginning of planting (1993), the thinned forest and mixed forest had a very similar distribution pattern, i.e., a significant regular distribution at a small scale (r = 0-1 m), a slightly aggregated distribution at r = 1-6 m, and a random distribution at other scales (Fig. 2a, Fig. 2d). In 2018, the mixed forest was clustered at small scales (r = 0-5.5 m) and randomly distributed at large scales (r = 6-20 m - Fig. 2b), but the thinned forest was clustered at almost all scales (Fig. 2e). During the management period (1991-2018), the changes in the distribution pattern were mainly concentrated at r = 0-1.0 m, ranging from an intensive regular distribution to an aggregated distribution (Fig. 2c, Fig. 2f). The species richness of the mixed forest increased from 2 to 58, and its spatial distribution changed from random (Fig. 2g) to a strong aggregation (Fig. 2h). The species richness of the thinned forest increased from 1 to 79, indicating a high concentration of species (Fig. 2j). The DBH of the mixed forest were distributed almost randomly (Fig. 2i), while small trees in the thinned forest presented an aggregated pattern (r = 0-7 m - Fig. 2k). The majority of trees cut from the thinned forest had a clumped distribution (Fig. 2l).
Fig. 2 - The spatial pattern of tree marks in the Chinese fir mixed forest (MF) and thinned forest (TF) at the stand level (g-k) and distribution pattern of the whole stands based on the complete spatial randomness (CSR) null model (a, b, d, e, i). The difference in the distribution patterns of the MF and TF during the management period based on the random labeling null model and the distribution pattern of the harvested woods based on the CSR null model. S and N are species richness and the number of individuals, respectively. The gray color represents the 95% Monte Carlo simulation area and the dashed red line is the expected value, while the black solid line with red dots is the observed value.
Distribution patterns of the main tree populations
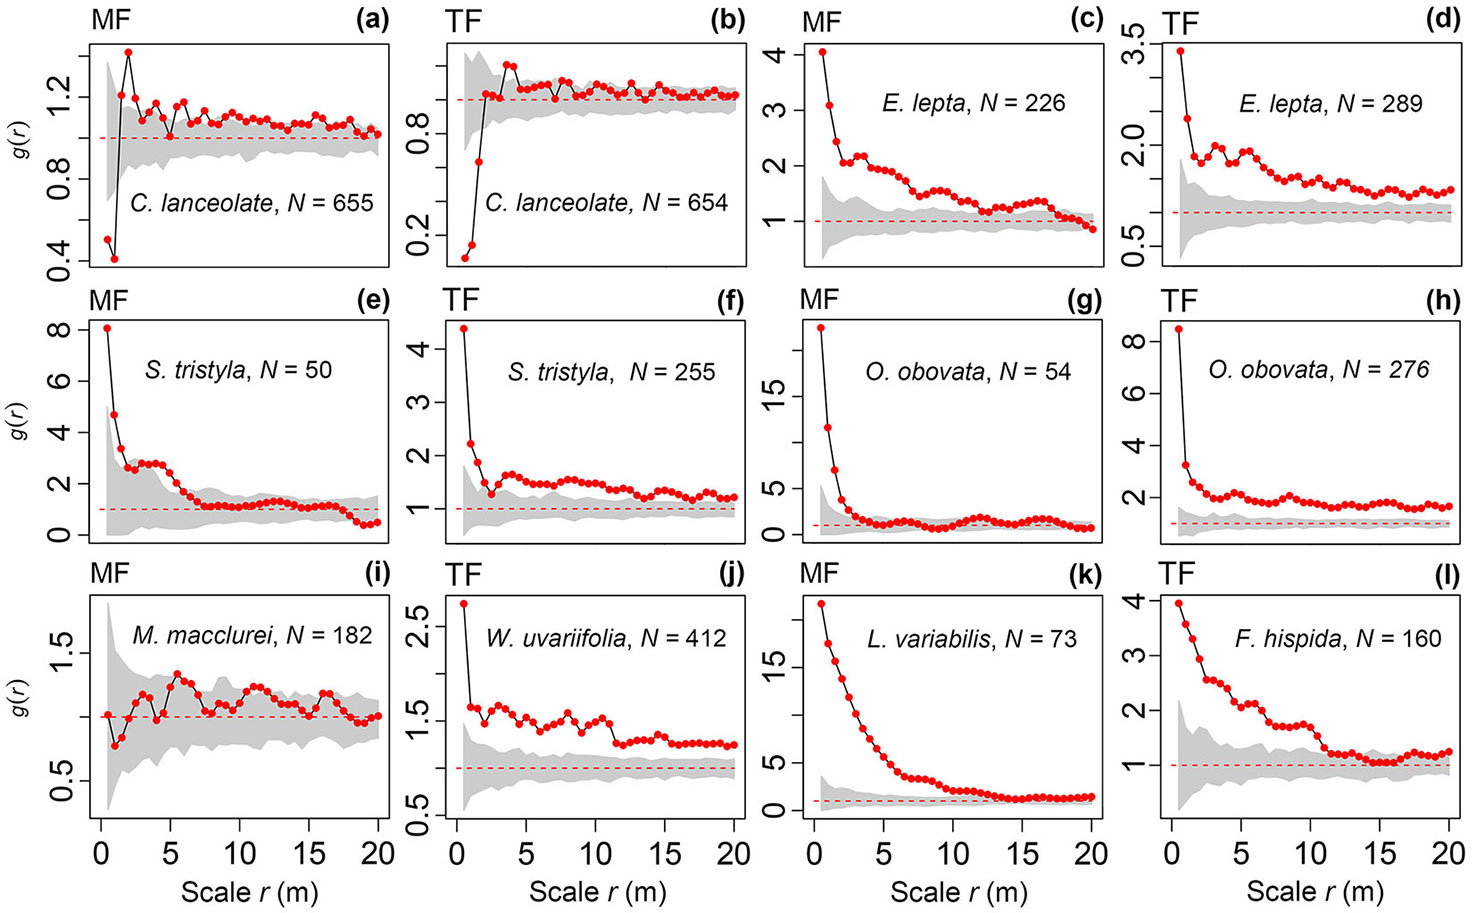
During the management period (1991-2018), although some of the Chinese fir in the thinned forest and mixed forest suffered self-thinning and cutting (54.8% and 44.4%, respectively), the stands planted largely retained the distribution pattern at planting (Fig. 3a, Fig. 3b). However, M. macclurei in the mixed forest had a random distribution at most scales (r = 0-20 m - Fig. 3i), which was slightly different from the distribution at planting (see Fig. S1c in Supplementary material). In both the thinned forest and mixed forest, E. lepta, O. obovata, and S. tristyla belonged to the NRLSS, with a large number of individuals. Each species differed in abundance in both stands, but displayed a similar aggregation pattern (Fig. 3c to Fig. 3h). In addition, W. uvariifolia and F. hispida in the thinned forest and L. variabilis in the mixed forest also displayed a strong aggregation (Fig. 3j to Fig. 3l).
Fig. 3 - Distribution patterns of the main populations in the Chinese fir thinned forest (TF) and mixed forest (MF) over a rotation based on the complete spatial randomness (CSR) null model. The gray color represents the 95% Monte Carlo simulation area and the black solid line marked with red dots is the observed value, while the red dashed line is the expect value of 1. N is the number of individuals.
DBH of the six main populations
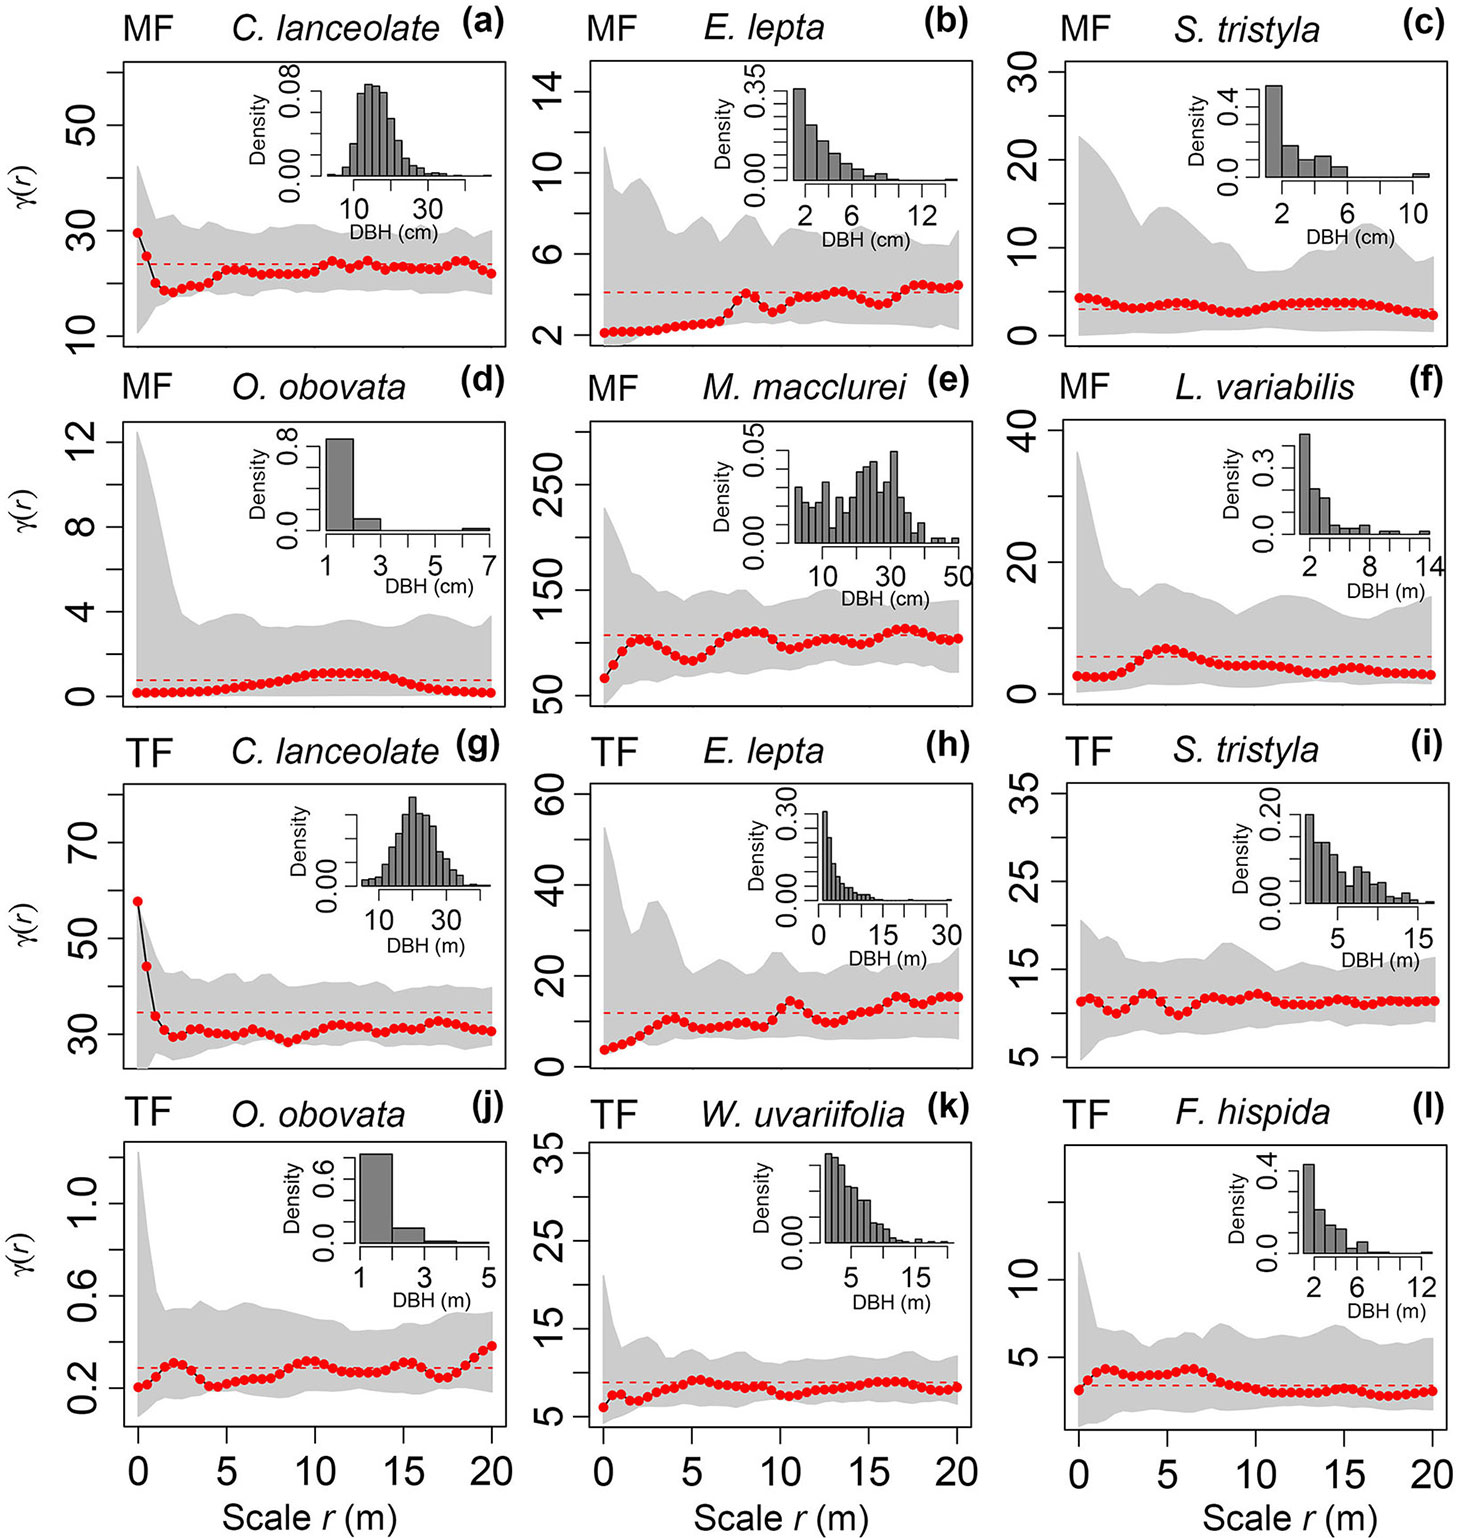
DBH of the six populations in the mixed forest and thinned forest was calculated. Although these tree species were different in terms of their diameter classes, their DBH was very similar. The majority of them had a random distribution pattern (Fig. 4a to Fig. 4l). Only some populations were close to the lower edge of the MC simulation interval at some scales, for example, E. lepta in the mixed forest at r = 2-6 m (Fig. 4b), O. obovata in the mixed forest at r = 0-5.5 m (Fig. 4d), and E. lepta in the thinned forest at r = 0-2 m (Fig. 4h).
Fig. 4 - Spatial distribution of the tree mark DBH values of the six main populations in a Chinese fir mixed forest (MF, a-f) and thinned forest (TF) over a management rotation (g-l).
Spatial correlations of the thinned forest and mixed forest
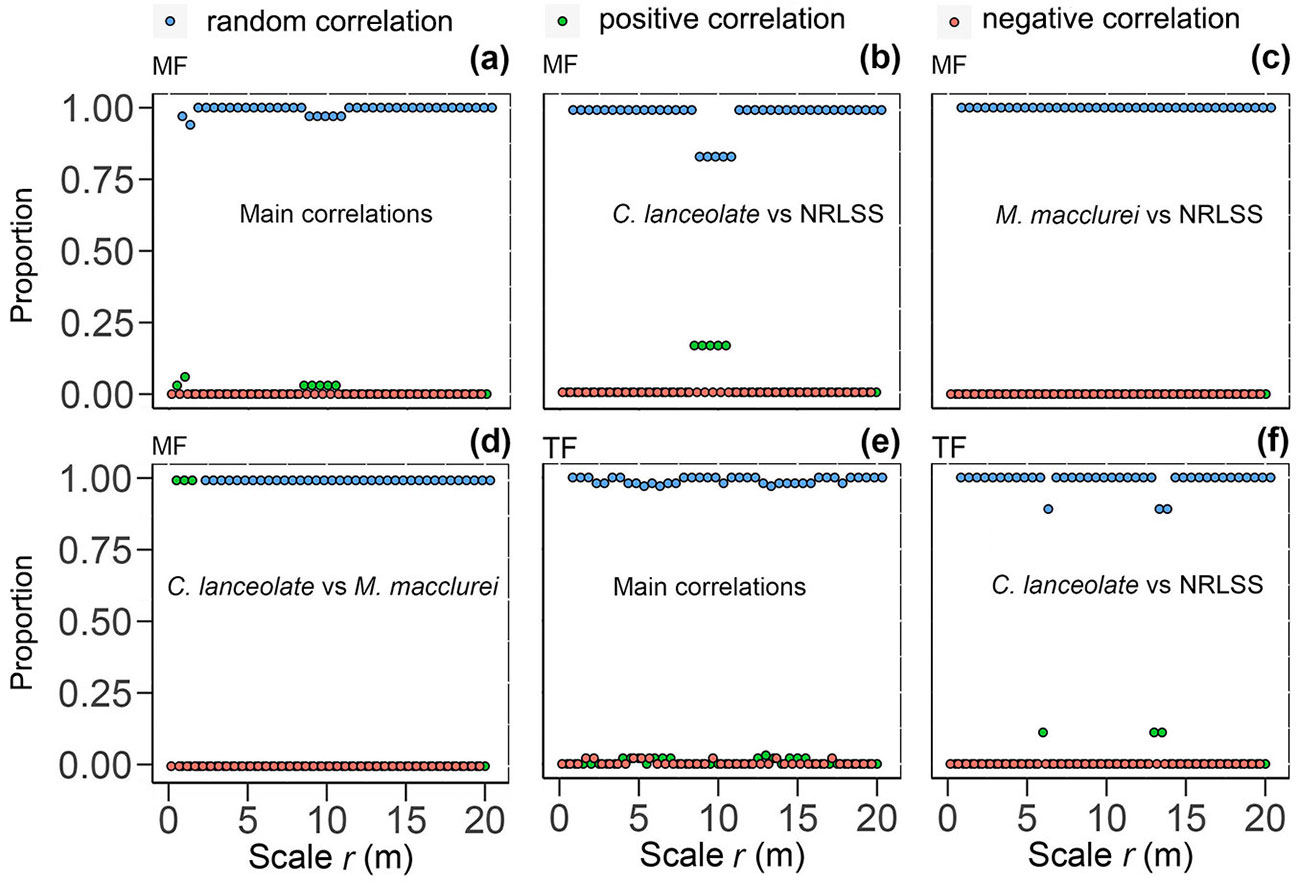
The interspecific spatial correlations of 36 pairs of the main populations (N ≥ 40) in the mixed forest were calculated and their probability distribution was determined. It was found that the interspecific correlations were random overall, with only a few (3-6%) positive correlations at r = 0.5, 1, and 8.5-10.5 m (Fig. 5a). Chinese fir was also randomly correlated with the NRLSS (7 pairs), displaying a slight positive correlation at r = 8.5-10.5 m (Fig. 5b). However, M. macclurei was randomly correlated with all of the NRLSS (7 pairs) at each scale (r = 0-20 m - Fig. 5c). Chinese fir and M. macclurei were also clumped to each other at r = 0.0-1.5 m, and maintained a random correlation at the other scales (r = 1.5-20 m - Fig. 5d). In the thinned forest, more than 97% of the correlations among 66 pairs of any species were positive, but only a slight clumping occurred at some scales (Fig. 5e). Except for r = 6 and 13-13.5 m, Chinese fir and the NRLSS (11 pairs) had a random correlation (Fig. 5f).
Fig. 5 - Spatial correlations among the main populations in the Chinese fir mixed forest (MF) and thinned forest (TF) over a rotation. The blue dots represent a random or no correlation, the green dots represent a positive correlation, and the red dots represent a negative correlation. (NRLSS): natural regeneration of late-seral species.
Distribution of the NND
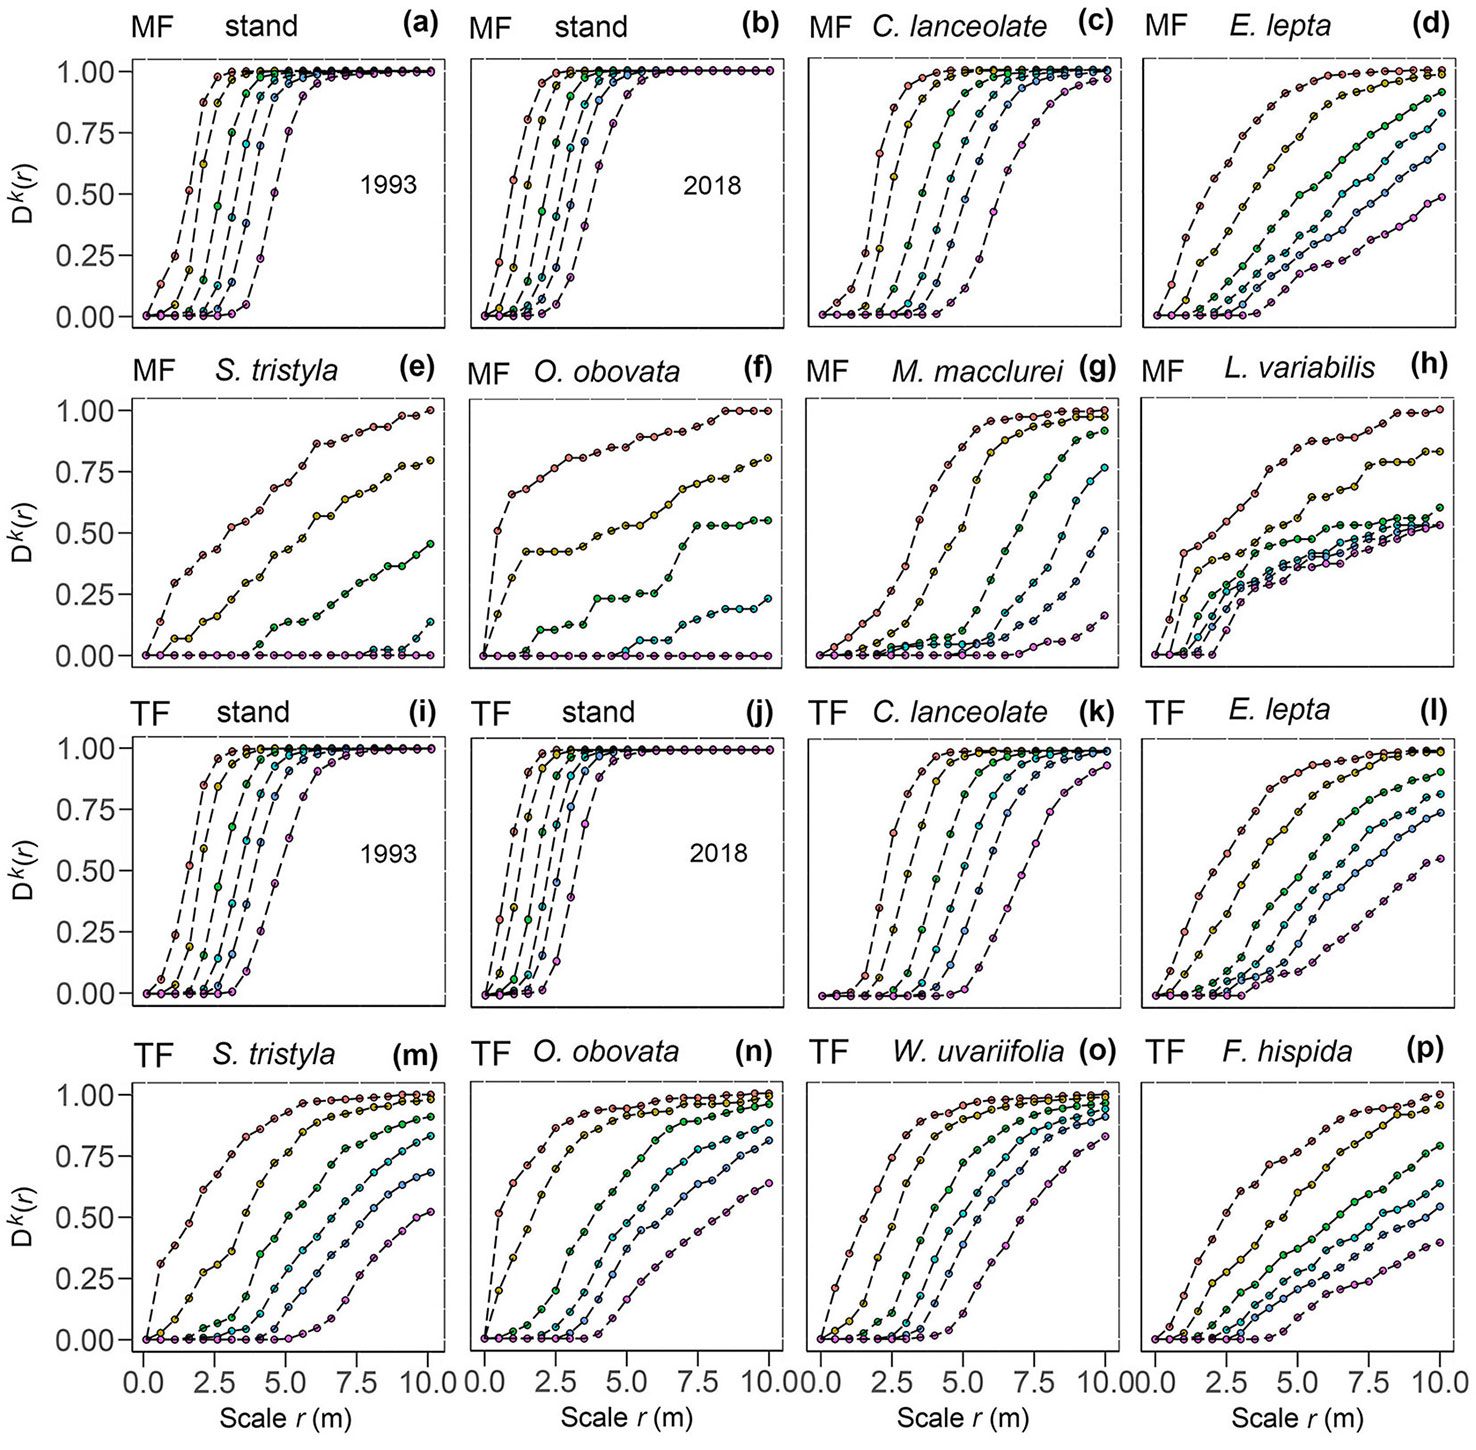
The cumulative distribution of the NND (k = 1, 2, 4, 6, 8, and 12) of the mixed forest and thinned forest stands at the planting stage (1993) and over a rotation (2018) was calculated. After a rotation (2018), the distances between nearest neighbors became shorter and the probability of occurring at the kth distance increased (Fig. 6a vs. Fig. 6b, Fig. 6i vs. Fig. 6j). The probability of Chinese fir occurring in the mixed forest was slightly higher than that in thinned forest over the same distance (Fig. 6c vs. Fig. 6k). Evodia lepta in the mixed stand and thinned stand had a similar NND distribution (Fig. 6d vs. Fig. 6l). Both S. tristyla and O. obovate were relatively dispersed in the mixed forest, but were concentrated in the thinned forest (Fig. 6e vs. Fig. 6m; Fig. 6f vs. Fig. 6n). There were 12 W. uvariifolia, F. hispida, and L. variabilis trees distributed at a small distance from each other (r = 0-4.5 and 0-2 m), and their probability of occurring at the kth distance increased with the increase in scale (Fig. 6o, Fig. 6p, Fig. 6h). The NND values for M. macclurei indicated that the trees were relatively dispersed (Fig. 6g) and their distribution did not significantly differ from that at the planting stage (1993 - Fig. S2 in Supplementary material).
Fig. 6 - The nearest neighbor distances (NND) of the six main populations and Chinese fir thinned forest (TF) and mixed forest (MF) stands before (1993) and after (2018) management (k = 1, 2, 4, 6, 8, and 12).
Discussion
Influence of thinning and mixing on the distribution pattern of plantations
Traditional stand description methods can no longer meet the needs of multiage forest management ([14], [22], [23], [51]). There is increasing evidence that the spatial pattern of tree locations and sizes should be considered alongside the traditional assessments of stand descriptions to provide guidance for multi-objective forest management, particularly when plantations are being converted into more natural stands to meet a desired management objective ([38], [33], [6]). Regular planting has been widely used in monoculture forest ([17], [15], [36]). At the initial stage of planting, the thinned forest and mixed forest had a regular distribution of trees at small scales (Fig. 2a, Fig. 2d), disclosing plantation characteristics rather than the interaction between trees. After thinning for 10 years, the NND of Chinese fir increased (Fig. 6i vs. Fig. 6k), but the distribution pattern was almost unchanged (Fig. 2d vs. Fig. 3b), indicating that the distribution pattern of Chinese fir changed slightly due to medium and low intensity thinning. The changes in the distribution pattern of Chinese fir in the mixed forest were also small (Fig. 3a vs. Fig. S1b in Supplementary material), further suggesting that the Chinese fir population and its regular pattern will last for a long time. Some studies have suggested that stripe thinning has an important effect on the spatial locations of planted trees, and its intensity is closely related to the degree that a plot trends toward a random distribution pattern ([6]). However, it has been shown that thinning intensity based on structured forest management has little effect on the plantation distribution of Larix principis-rupprechtii Mayr. ([51]). Therefore, we believe that the distribution patterns of the remaining trees are closely related to the thinning modes and intensity of harvesting. Furthermore, when considering the timescale, the distribution patterns of the remaining trees are also related to their self-thinning and regeneration. For example, the distribution pattern of M. macclurei changed from slightly regular to completely random, mainly due to tree death and natural regeneration (Fig. 4e). Chinese fir cannot achieve regeneration in the understory ([21], [26]), and therefore no small trees were present (Fig. 4a).
With the prolongation of succession time, the occurrence of the NRLSS reduced the NND of the stands (Fig. 6a vs. Fig. 6b, Fig. 6i vs. Fig. 6j). They not only displayed a strong aggregation pattern (Fig. 3c-h, Fig. 3j, Fig. 3l), but also resulted in an aggregated distribution in the thinned forest and mixed forest (Fig. 2e, Fig. 2b), and greatly increased the degree of interspecific isolation (Fig. 2g vs. Fig. 2h, Fig. 2j). This is consistent with our hypotheses 1 and 2, but the formation mechanism of the aggregation patterns in the thinned forest, and mixed forest stands may be different. It has been proposed that thinning provides suitable habitats for the growth of vegetation in forest gaps or the understory in the short-term ([39], [33], [41], [48], [52]), and this small scale heterogeneity is critical to seedling survival and growth ([32]). By contrast, the spatial distribution of branches, leaves, and roots of Chinese fir mixed forest is different from that of pure forest ([40]), which slowly changes the environment and affects the development process of the NRLSS ([36], [43]). This may explain why the thinned forest contained more species than the mixed forest ([5], [43]) and they differed in abundance, point distribution, and size differentiation (Fig. S3, Fig. S4, Fig. S5, Tab. S1 - Supplementary material). The differences may be characterized by randomness ([16]). The thinned forest and mixed forest formed three layers of trees, shrubs, and grass in the vertical direction (Fig. S5a, S5b), which was consistent with the characteristics of an overmature plantation (31 years) in the central production area of Chinese fir in Fujian Province, China ([21]), and these forests had a high species diversity.
Influence of thinning and mixing on plantation tree size
Tree sizes reflect the process of stand development and the degree of external disturbance, and are often used to evaluate or support forest management ([19], [23], [13]). Many studies have suggested that thinning simultaneously promotes both preservation and undergrowth ([35], [41], [30], [51], [52]), but the relationship between the two is not clear. In this study, Chinese fir and NRLSS in the thinned forest were present in different layers (Fig. S5c, Fig. S5d in Supplementary material), and the saplings were clustered (Fig. 2k). In a Pinus sylvestris L. artificial forest, Crecente-Campo et al. ([6]) found that self-thinning and growth did not change the spatial distribution of tree sizes in the short term (4 years), but intensive thinning resulted in tree sizes in the stands becoming negatively correlated. This would explain the differences in tree size distribution in the thinned forest and mixed forest (Fig. 2i, Fig. 2k), indicating that thinning expands the growth rate of trees in the upper and lower layers. However, this phenomenon may be temporary. In an old-growth Chinese fir plantation (56 years), the tree growth declined after thinning and some hardwood trees entered the main forest layer, forming a highly mixed forest ([21]). Other studies have also suggested that the degree of tree size autocorrelation in virgin forests is very low ([17]).
The tree sizes of the six main species in the thinned forest and mixed forest were randomly distributed (Fig. 4a to Fig. 4l). This may be because the main competition within stands was also stratified, which was apparent from the diameter classes. The normal diameter of Chinese fir in the thinned forest implies intensively intraspecific competition (Fig. 4g). The partially right skewed distribution of the diameter classes of Chinese fir in the mixed forest suggests interspecific competition caused by M. macclurei (Fig. 4a). With the exception of small trees, the diameter classes of M. macclurei in the mixed forest also indicated intraspecific competition. The random correlation between planted trees and NRLSS further indicated that competition was occurring (Fig. 5a, Fig. 5e). The strong intraspecific aggregation may be an important reason for the random distribution of tree sizes in the lower layer, i.e., there was density dependence ([11], [47]). Some studies have also suggested that the distribution of small trees in artificial forests is a result of competition ([33]). Comparing a series of 30- to 57-year-old pine/oak secondary forests, Li et al. ([25]) found that a stable DBH differentiation formed early (before 30 years), and concluded that the distribution pattern was related to but not strongly affected by DBH differentiation. Potvin & Dutilleul ([35]) also found this tendency in artificial forests. Individuals of the same species were generally smaller in the mixed forest than in the thinned forest (Tab. S1 in Supplementary material), reflecting the impact of the model of forest management on tree sizes ([46], [52]).
Influence of thinning and mixing on the spatial correlations of plantation trees
In natural forests, spatial correlations are commonly used to explore species coexistence mechanisms ([9], [47], [31]). By contrast, the spatial correlation between Chinese fir and M. macclurei in the mixed forest at the beginning of planting (1993) was a feature of human actions (Fig. S1d). The planting patterns strongly limited the development of relationships among trees. Even over a full rotation period (27 years), species planted were only clumped to each other at a small scale, and the original correlation was preserved at most scales (Fig. 5d). This transformation may be the result of Chinese fir self-thinning and the seeds of M. macclurei falling and emerging successfully (Fig. 4e), which is in line with the changes in the distribution pattern and number of M. macclurei individuals present during the management period (1993-2018 - Fig. S1c vs. Fig. 3i). When the planted M. macclurei reached physiological maturity its shade-tolerant seedlings were able to regenerate and grow in the understory ([8]). At the same time, the relationships between the planted species (Chinese fir, M. macclurei) and NRLSS were very weak (Fig. 5a-f), indicating that the upper reserved populations had little influence on NRLSS, which is inconsistent with our hypothesis 3. The random correlation may be related to the distribution pattern preserved by the planted populations (Fig. 3a, Fig. 3b). The continuous regular distribution resulted in there being many similar niches in each stage of stand development from young to middle-aged and then to mature forest, which is conducive to the aggregation of conspecifics (Fig. 3c-h, Fig. 3j-l; Fig. 6d-h, Fig. 6l-p) and to the random correlation of heterospecies entering the stands (Fig. 5a, Fig. 5e), suggesting that intraspecific competition is the main force driving stand succession. Most previous studies have also found that intraspecific correlations are more intense than interspecific correlations ([9], [1]). In two previous studies ([21], [10]), after thinning, hardwood trees in a Chinese fir and longleaf pine (Pinus palustris) flourished in stages, indirectly supporting our viewpoint.
Conclusions
The conversion of plantations into mixed forests has become very popular, but there have been few successes. Chinese fir has a long history of cultivation in China. Many stands have been clear-felled and have undergone several crop rotations, resulting in a significant decrease in biodiversity, stability, sustainability, and ecosystem services. The conversion of even-aged pure forest to multi-aged mixed forest may have many ecological and economic benefits, and also completely change the structure, composition, and function of the stand. Although some conversion measures have been adopted, only short-term stand dynamics have been evaluated. On the basis of previous experiments, we explored the influence of thinning and mixing on the spatial distribution, interspecific correlation, mark characteristics, and NND of Chinese fir plantations. The mechanisms by which thinning and mixing operate on plantation conversion may be different, but our case shows that they significantly promoted species richness and spatial heterogeneity at the stand level, suggesting that the transformation of Chinese fir to mixed forest was successful and may serve as a model for future plantation management. Thinning might be more suitable for the management of Chinese fir plantations than mixed forest. The thinned forest provided more timber than the mixed forest, suggesting that thinning may be a popular local harvesting method. The rotation timescale after local thinning needs to be extended and the NRLSS also need protection in the thinning process. The effects of thinning and mixing on the growth of plantations and the improvement of the natural environment need to be further monitored and evaluated.
List of abbreviations
The following abbreviations have been used throughout this paper:
- MF: mixed forest
- TF: thinned forest
- NRLSS: natural regeneration of late-seral species
- DBH: diameter at breast height
- PCF: pair correlation function
- CSR: complete spatial randomness
- NND: nearest neighbor distance
- MC: Monte Carlo
Acknowledgements
This paper was financially supported by Guangxi special fund project for innovation-driven development (AA 17204087-8). PhD student Xianyu Yao, master students Deyi Zhu, Ji’an He, Haipeng Yang and undergraduates Xian Li, Yongzhen Huang joined data collection. Lihua Lu from the Experimental Center of Tropical Forestry, Chinese Academy of Forestry participated in test design and plot establishment.
References
Gscholar
Online | Gscholar
CrossRef | Gscholar
CrossRef | Gscholar
CrossRef | Gscholar
Gscholar
Gscholar
Gscholar
Authors’ Info
Authors’ Affiliation
Junmo Xu
Hongxiang Wang
Guo Sun
Sufang Yu
Liangning Liao
Shaoming Ye 0000-0003-3052-0616
College of Forestry, Guangxi Key Laboratory of Forest Ecology and Conservation, Guangxi University, Daxue East Road 100, Xixiangtang district, Nanning, Guangxi, 530004 (China PR)
Department of Renewable Resources, University of Alberta, T6G 2R3 (Canada)
Experimental Center of Tropical Forestry, Chinese Academy of Forestry, Pingxiang 532600, Guangxi (China PR)
Corresponding author
Paper Info
Citation
Li Y, Xu J, Wang H, Nong Y, Sun G, Yu S, Liao L, Ye S (2021). Long-term effects of thinning and mixing on stand spatial structure: a case study of Chinese fir plantations. iForest 14: 113-121. - doi: 10.3832/ifor3489-014
Academic Editor
Giorgio Vacchiano
Paper history
Received: Apr 29, 2020
Accepted: Jan 06, 2021
First online: Mar 08, 2021
Publication Date: Apr 30, 2021
Publication Time: 2.03 months
Copyright Information
© SISEF - The Italian Society of Silviculture and Forest Ecology 2021
Open Access
This article is distributed under the terms of the Creative Commons Attribution-Non Commercial 4.0 International (https://creativecommons.org/licenses/by-nc/4.0/), which permits unrestricted use, distribution, and reproduction in any medium, provided you give appropriate credit to the original author(s) and the source, provide a link to the Creative Commons license, and indicate if changes were made.
Web Metrics
Breakdown by View Type
Article Usage
Total Article Views: 51608
(from publication date up to now)
Breakdown by View Type
HTML Page Views: 44781
Abstract Page Views: 3149
PDF Downloads: 3031
Citation/Reference Downloads: 9
XML Downloads: 638
Web Metrics
Days since publication: 1766
Overall contacts: 51608
Avg. contacts per week: 204.56
Article Citations
Article citations are based on data periodically collected from the Clarivate Web of Science web site
(last update: Mar 2025)
Total number of cites (since 2021): 15
Average cites per year: 3.00
Publication Metrics
by Dimensions ©
Articles citing this article
List of the papers citing this article based on CrossRef Cited-by.
Related Contents
iForest Similar Articles
Research Articles
Deriving tree growth models from stand models based on the self-thinning rule of Chinese fir plantations
vol. 15, pp. 1-7 (online: 13 January 2022)
Research Articles
Tree-oriented silviculture: a new approach for coppice stands
vol. 9, pp. 791-800 (online: 04 August 2016)
Research Articles
Damage assessment to subtropical forests following the 2008 Chinese ice storm
vol. 10, pp. 406-415 (online: 24 March 2017)
Research Articles
Interactions between thinning and bear damage complicate restoration in coast redwood forests
vol. 13, pp. 1-8 (online: 08 January 2020)
Research Articles
The conversion into high forest of Turkey oak coppice stands: methods, silviculture and perspectives
vol. 13, pp. 309-317 (online: 10 July 2020)
Research Articles
Modeling of time consumption for selective and situational precommercial thinning in mountain beech forest stands
vol. 14, pp. 137-143 (online: 16 March 2021)
Research Articles
Impact of thinning on carbon storage of dead organic matter across larch and oak stands in South Korea
vol. 9, pp. 593-598 (online: 01 March 2016)
Research Articles
Spatial structure of the vertical layers in a subtropical secondary forest 57 years after clear-cutting
vol. 12, pp. 442-450 (online: 16 September 2019)
Research Articles
Spatial distribution pattern of Mezilaurus itauba (Meins.) Taub. Ex mez. in a seasonal forest area of the southern Amazon, Brazil
vol. 9, pp. 497-502 (online: 25 January 2016)
Research Articles
Oak often needs to be promoted in mixed beech-oak stands - the structural processes behind competition and silvicultural management in mixed stands of European beech and sessile oak
vol. 13, pp. 80-88 (online: 01 March 2020)
iForest Database Search
Search By Author
Search By Keyword
Google Scholar Search
Citing Articles
Search By Author
Search By Keywords
PubMed Search
Search By Author
Search By Keyword

