Large-scale spatial distribution of deer browsing damage to young tree plantations
iForest - Biogeosciences and Forestry, Volume 14, Issue 1, Pages 34-40 (2021)
doi: https://doi.org/10.3832/ifor3387-013
Published: Jan 14, 2021 - Copyright © 2021 SISEF
Research Articles
Abstract
The economic loss caused by herbivore browsing in forest plantations is a concerning problem in many areas around the world. Information on the spatial distribution of browsing damage is important for forest owners when selecting locations for new plantations, because planting trees in areas of high browsing pressure increases economic losses. Although it is difficult to survey browsing damage across large areas, sporadic sampling data on browsing damage are often collected by foresters, governments, and researchers. Thus, in this study, we applied a generalized additive model (GAM) for analysis of sporadic data to reveal large-scale spatial variation in deer (Cervus nippon) browsing damage. A map of browsing pressure produced by a GAM that used years after planting (plantation age) and location as independent factors showed a few areas of high browsing pressure. In addition, browsing damage increased with increasing plantation age, and plantation stands aged 2+ years showed more browsing damage. Areas with high browsing damage estimated based on plantation stands aged 2+ years generally coincided with areas of high deer abundance, with some exceptions. Thus, this model reflects large-scale browsing damage relatively well and will help forest owners to avoid locating new plantations in areas of high browsing pressure.
Keywords
Cervus nippon, Deer Browsing Damage, Forest Management, Generalized Additive Model, Plantation
Introduction
Damage to forest plantations due to herbivore browsing causes economic losses ([8], [30]) and is a problem in many areas ([14], [9], [5]). In particular, tree seedlings in clearcuts face high browsing pressure by terrestrial animals ([38]), and, when browsing pressure is high, forest plantations can fail to reach maturity ([37], [3], [4], [40]). This means that planting trees in areas with a potential high risk of browsing damage might increase economic losses. Thus, it is important to determine the spatial distribution of browsing pressure to identify the most suitable areas for tree planting taking into account that damages show a spatially heterogeneous distribution ([2], [6]). Nonetheless, as it is often difficult to survey the damages across large areas, the large-scale spatial distribution (e.g., at the landscape level) of the damages remains poorly understood. However, it has often been surveyed in sporadic sampling sites by foresters, governments, and researchers. We hypothesized that the large-scale spatial distribution of the damage, as estimated by using these sporadic sampling data, could help in siting new plantations in areas where damages would be minimized.
Large-scale spatial distributions are often estimated from sporadic data in studies on marine animals. For example, Yano et al. ([44]) estimated the spatial distribution of the North Pacific spiny dogfish (Squalus suckleyi) across the North Pacific region from catch records. Also, Suzuki et al. ([34]) and Furuichi et al. ([13]) estimated the location of spawning grounds of small pelagic fishes in the East China Sea and the Sea of Japan from fixed-point observation data. Yamamoto et al. ([43]) clarified the density distribution pattern of streaked shearwaters (Calonectris leucomelas) in the Pacific Ocean based on observations collected by vessel surveys and individual tracking. In these studies, distributions were estimated in a single plane by smoothing sporadic data using a habitat-based additive model ([12]) and producing a distribution map ([15]).
In Japan, the sika deer (Cervus nippon) population increased rapidly in recent decades ([23]) and deer damage to forests is a serious problem ([36]). On Kyushu Island in southwestern Japan, deer browsing of forest plantations rapidly increased after 1990, and recent years’ economic losses in forest plantations reached the equivalent of approximately US$6 million per year ([42]). To understand local economic losses, data on browsing damage have been collected sporadically from many areas of Kyushu Island. We produced a map of browsing damage distribution based on this dataset by using a generalized additive model (GAM), with the aim of identifying areas of low browsing damage on Kyushu Island.
In addition, deer density is considered to be an essential factor in determining browsing pressure, because removal of deer decreases browsing damage in small-scale (few square kilometers) experimental sites ([11]). However, it remains unclear whether deer density affects browsing pressure at a larger scale. On Kyushu Island, deer density at the prefectural scale has been surveyed sporadically for wildlife management by prefectural governments where sika deer are abundant. We produced a map of deer distribution from available density data by using GAM and performed a preliminary analysis of the relationship between browsing pressure and deer density at the large scale.
Material and methods
Study area
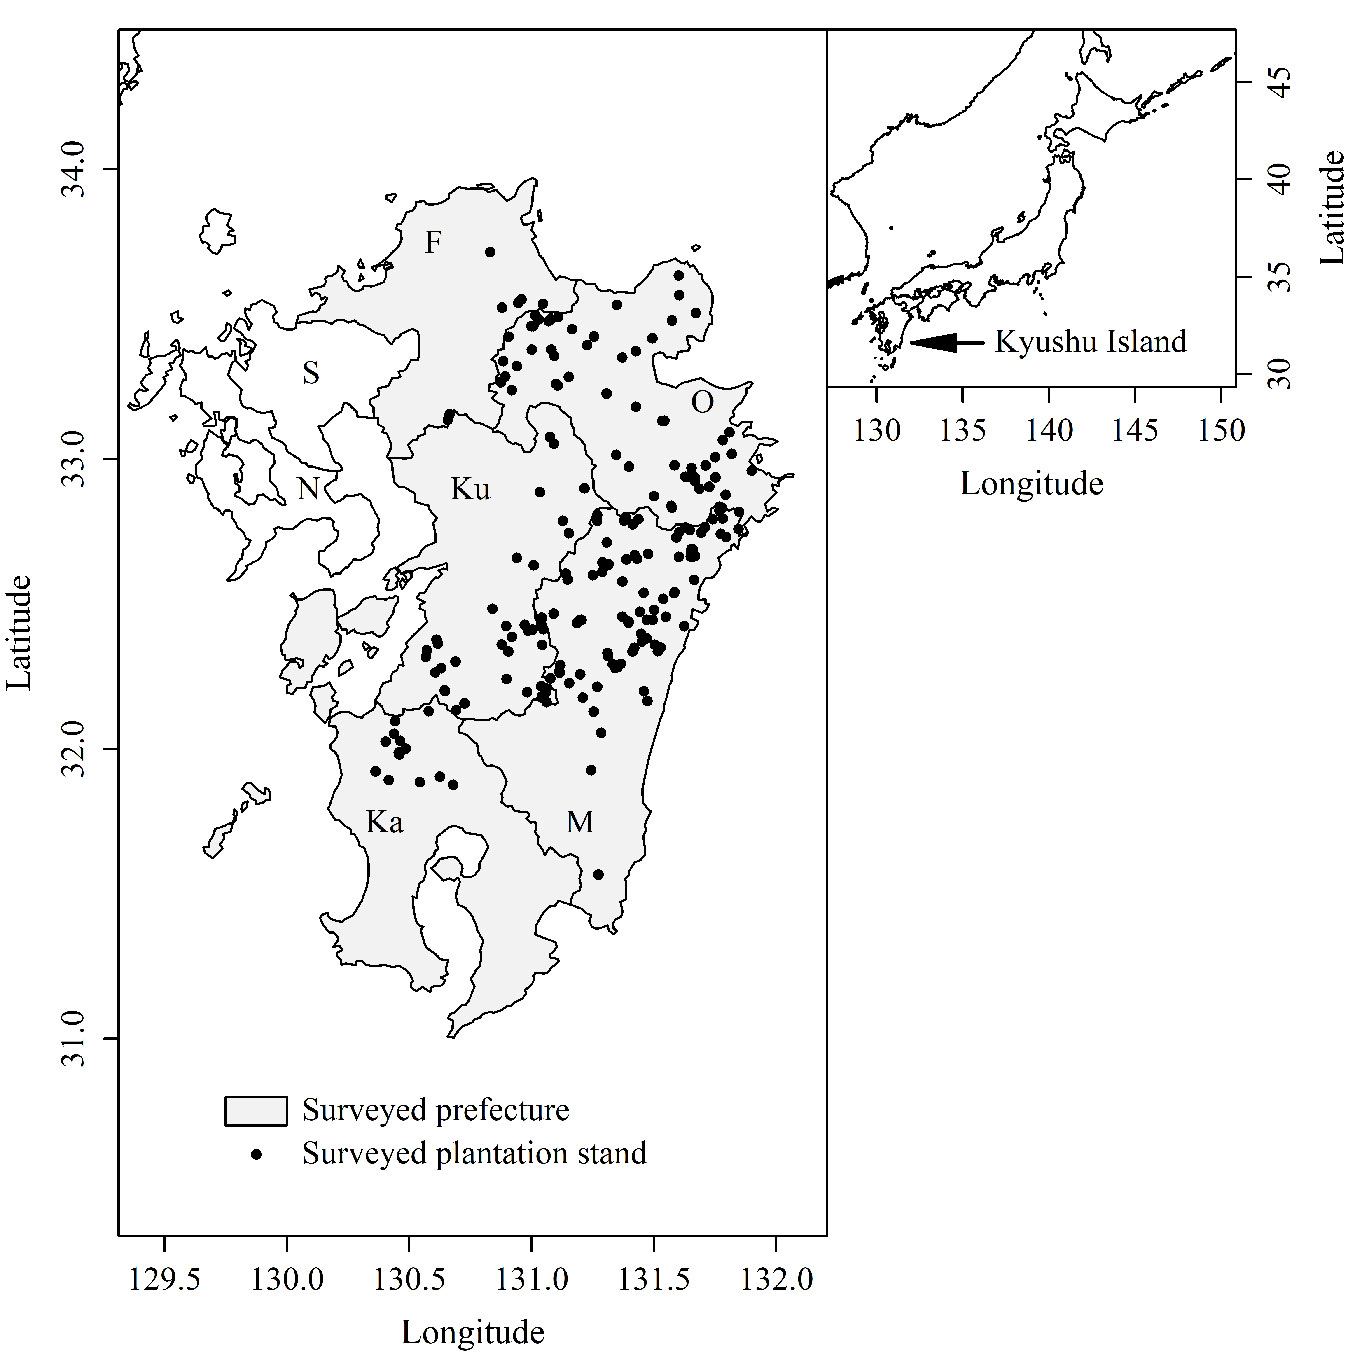
Kyushu Island (Fig. 1) is the third largest (approximately 36,750 km2) of the four main islands of Japan. Forest vegetation on Kyushu Island is divided into two zones: the evergreen broad-leaf forest zone at low altitude and the deciduous broad-leaf forest zone at high altitude. The border between the two vegetation zones is at approximately 800-1000 m a.s.l. Fifty-six percent of forests on Kyushu Island are plantations comprised of Japanese cedar (Cryptomeria japonica D.Don) and Japanese cypress (Chamaecyparis obtusa Endl.). In recent years, harvest of these plantations has increased, and Japanese cedar cuttings and/or Japanese cypress seedlings have been planted in clearcuts.
Fig. 1 - Locations of surveyed plantations on Kyushu Island. (F): Fukuoka; (O): Oita; (Ku): Kumamoto; (M): Miyazaki; (Ka): Kagoshima; (S): Saga; (N): Nagasaki.
On Kyushu Island, deer browsing is a major factor that inhibits regeneration of plantations. On Hokkaido Island, with its cooler temperatures, not only deer but also Sasa senanensis (Fr. & Sav.) Rehd. (dwarf bamboo) prevent the establishment of young trees ([40]). In contrast, on the warmer Kyushu Island its distribution was limited ([39]), though Sasamorpha borealis (Hack.) Nakai (evergreen bamboo) can also prevent tree seedling establishment. However, heavy browsing of the bamboo caused its decline ([31]) and currently it is not a major factor inhibiting tree growth in plantations.
Sika deer inhabit six of the seven prefectures on Kyushu Island (Fukuoka, Kumamoto, Oita, Miyazaki, Kagoshima, and Nagasaki, but not Saga). Nagasaki Prefecture was excluded from the analysis in this study because its sika deer population is totally isolated from the other populations on Kyushu.
Browsing damage
In 2018, browsing damage was surveyed in 338 recently planted forest stands (Tab. 1) in the five focal prefectures on Kyushu Island by the Forest Management Center (Fig. 1). The plantation stands were composed of Japanese cedar and/or Japanese cypress, and the size of the plantation stands was 4.9 ± 4.1 ha (mean ± standard deviation). In each plantation, the area damaged (ha) by sika deer and damage levels were recorded. The damage levels, averaged among the trees within each selected site, were ranked into four main categories (<25%, ≥25% to <50%, ≥50% to <75%, and ≥75%). As years after planting (plantation age) varied from 1 to 5 years, the damage is cumulated from planting to the survey day.
Tab. 1 - Summary of surveyed plantations. (SD): standard deviation.
| Parameter | Year planted | ||||
|---|---|---|---|---|---|
| 2017 | 2016 | 2015 | 2014 | 2013 | |
| Plantation age (years) | 1 | 2 | 3 | 4 | 5 |
| No. of plantations | 47 | 78 | 78 | 64 | 71 |
| No. of damaged plantations | 3 | 13 | 20 | 15 | 25 |
| Mean size of plantation (ha) | 4.12 | 4.04 | 4.49 | 6.07 | 5.52 |
| SD of plantation size | 2.67 | 3.76 | 3.06 | 5.95 | 4.08 |
| Mean size of damaged area (ha) | 0.24 | 0.61 | 0.8 | 1.51 | 1.49 |
| SD of damaged area | 1.27 | 1.72 | 1.83 | 4.8 | 3.01 |
To clarify the distribution of browsing damage, we constructed a GAM with a binomial distribution with a logit-link function. The proportion of damaged area to plantation size, produced by using the cbind function in R ver. 3.5.2 ([29]), was used as the dependent variable. Spatial effect, the tensor product of latitude and longitude, was used as an independent variable. In addition, we used a smoothed term for plantation age and the interaction between location and plantation age as independent variables, because we considered that browsing damage accumulates over time. We used the following GAM formula (eqn. 1):
where y is the proportion of damaged area produced by cbind (damage area, planted area - damage area), s is the smoothed term, age is the plantation age, te is the tensor product, lat is the latitude, lon is the longitude, ti is the interaction including tensor production, and a is intercept. We evaluated the significance of the independent variables using a χ2 goodness-of-fit test. In addition, to produce the browsing distribution map, we extrapolated browsing pressure 100 km2 around each surveyed plantation stand based on the results of the GAM. The extrapolation area was limited to forested areas only. The accuracy of the model was evaluated using a four-fold cross-validation ([28]) and a Spearman’s correlation test.
In addition, we clarified the relationship between the proportion of damaged area and the damage level, by using a generalized linear model (GLM) with a binomial distribution. We used the following GLM formula (eqn. 2):
where y is the proportion of damaged area produced by cbind (damage area, planted area - damage area), a is the intercept, and DL are the damage levels. All calculations were run in R ver. 3.5.2 ([29]).
Deer density
Tab. 2 - Summary of fecal pellet count surveys.
| Prefecture | Survey years | Number of survey plots |
Number of surveys |
|---|---|---|---|
| Fukuoka | 1995-2018 | 105 | 878 |
| Kumamoto | 2002, 2003, 2006, 2009, 2010, 2014 | 247 | 627 |
| Miyazaki | 2015, 2017 | 128 | 375 |
To estimate deer density, we used the fecal pellet count method ([21], [25]). Pellet surveys were performed in Fukuoka, Kumamoto, and Miyazaki prefectures by each prefecture’s forestry experimental station. Pellets were counted a total of 1880 times at 480 sites from 1995 to 2018 (Tab. 2). Based on the pellet counts and average temperature in the survey month, deer density per square kilometer was estimated by using the FUNRYU software ([21]) in Microsoft Excel® (Microsoft Inc., Redmond, WA, USA). By using this method, however, deer densities in a few sites were estimated to be > 700 deer km-2. In Japan, even in areas with the highest deer density, such as Kinkazan ([20]) and Nakanoshima Islands ([22]), deer density ranged from approximately 30 to 60 deer km-2. Such outliers can increase dispersion. Thus, to avoid large dispersion due to a few outliers, we transformed the deer density (D) to a density index by using the following formula (eqn. 3):
where y is the density index. The deer density data contained many zeros. In these cases, addition of a small value such as 10% of the mean or 1 is traditionally used ([17]). Because mean deer density in this study was 20.5, we considered that adding 1 in the transformation was acceptable.
To estimate deer density distribution, we constructed a GAM; because approximately 17% of the survey area showed no deer, we resolved the zero-data problem with a Tweedie distribution ([7], [33]). The density index was treated as a dependent variable. Location, the tensor product of latitude and longitude, was used as the independent variable. Also, because deer density fluctuates year by year, we included the survey year and the interaction between location and year in the model. We used the following GAM formula (eqn. 4):
where y is the density index, s is the smoothed term, year is the surveyed year, te is the tensor product, ti is the interaction including tensor production, and a is the intercept. We evaluated the significance of the independent variables using an F test. The accuracy of the model was evaluated using a four-fold cross validation ([28]) and a Spearman’s correlation test. In addition, to produce the deer density distribution map, we extrapolated the density index 100 km2 around each surveyed plot based on the results of the GAM. The extrapolation area was limited to forested areas only.
Results
Browsing damage
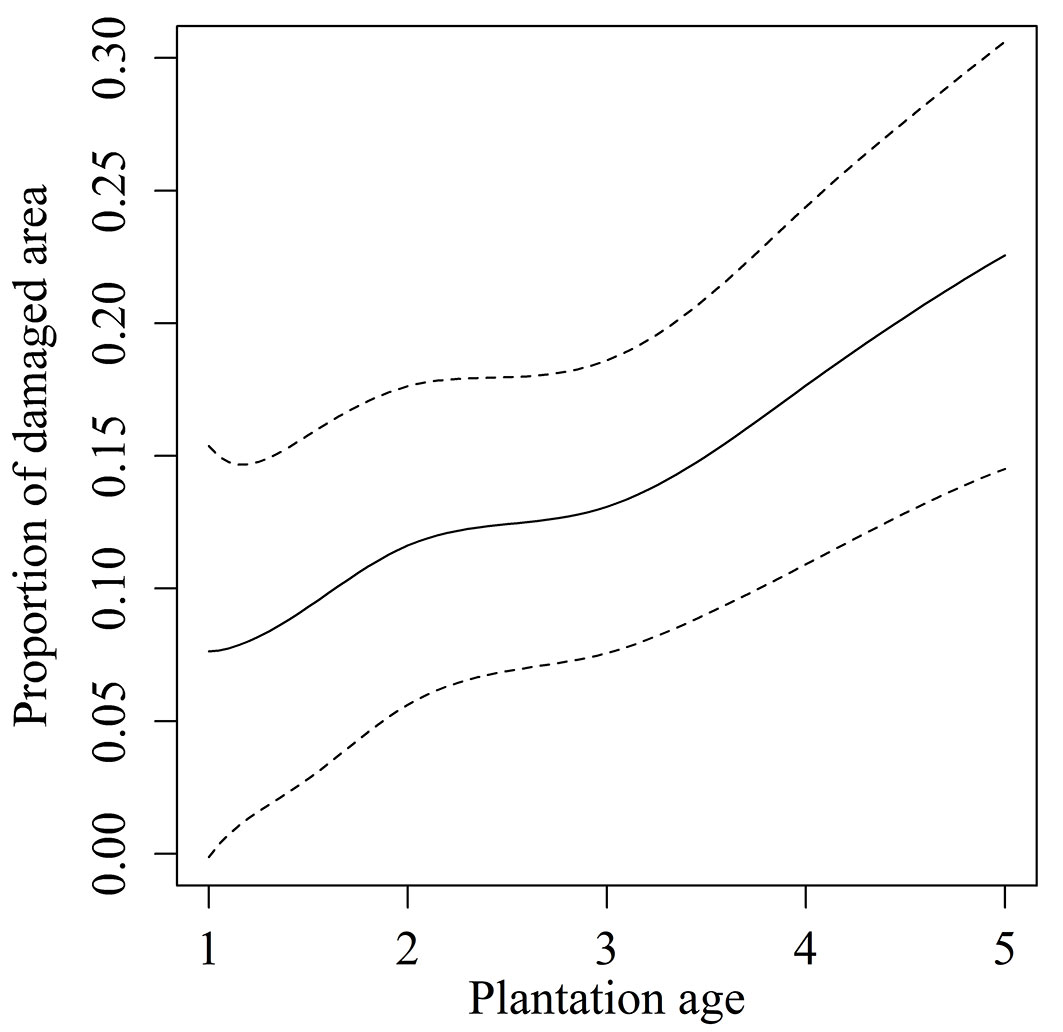
Deer browsing was recorded at 76 of the 338 plantation stands, and deer browsing damage by plantation age is shown in Tab. 1. The results of the GAM for browsing damage (r2 = 0.555, deviance explained = 60.5%) demonstrated significant effects of plantation age and location as well as interactions between these variables on browsing damage (Tab. 3). Plantation age was shown to have a positive effect on browsing damage, with the damaged area increasing with age, and the relationship was relatively linear (Fig. 2).
Tab. 3 - Summary of the generalized additive model used to examine browsing damage to plantations. (age): plantation age; (lat): latitude; (lon): longitude.
| Independent variables | edf | χ 2 | P value |
|---|---|---|---|
| s(age) | 3.35 | 48.38 | <0.001 |
| te(lat, lon) | 8.69 | 40.59 | <0.001 |
| ti(lat, lon, by = age) | 33.97 | 191.38 | <0.001 |
Fig. 2 - Effect of plantation age on browsing damage. The continuous line is the best-fit curve generated by the generalized additive model; dashed lines show 80% confidence intervals.
We compared actual damage areas with damage areas estimated using by four-fold cross validation of the GAM. Spearman’s correlation test showed a significant positive correlation (ρ = 0.479, P < 0.001). Thus, the estimation accuracy of the model was relatively high.
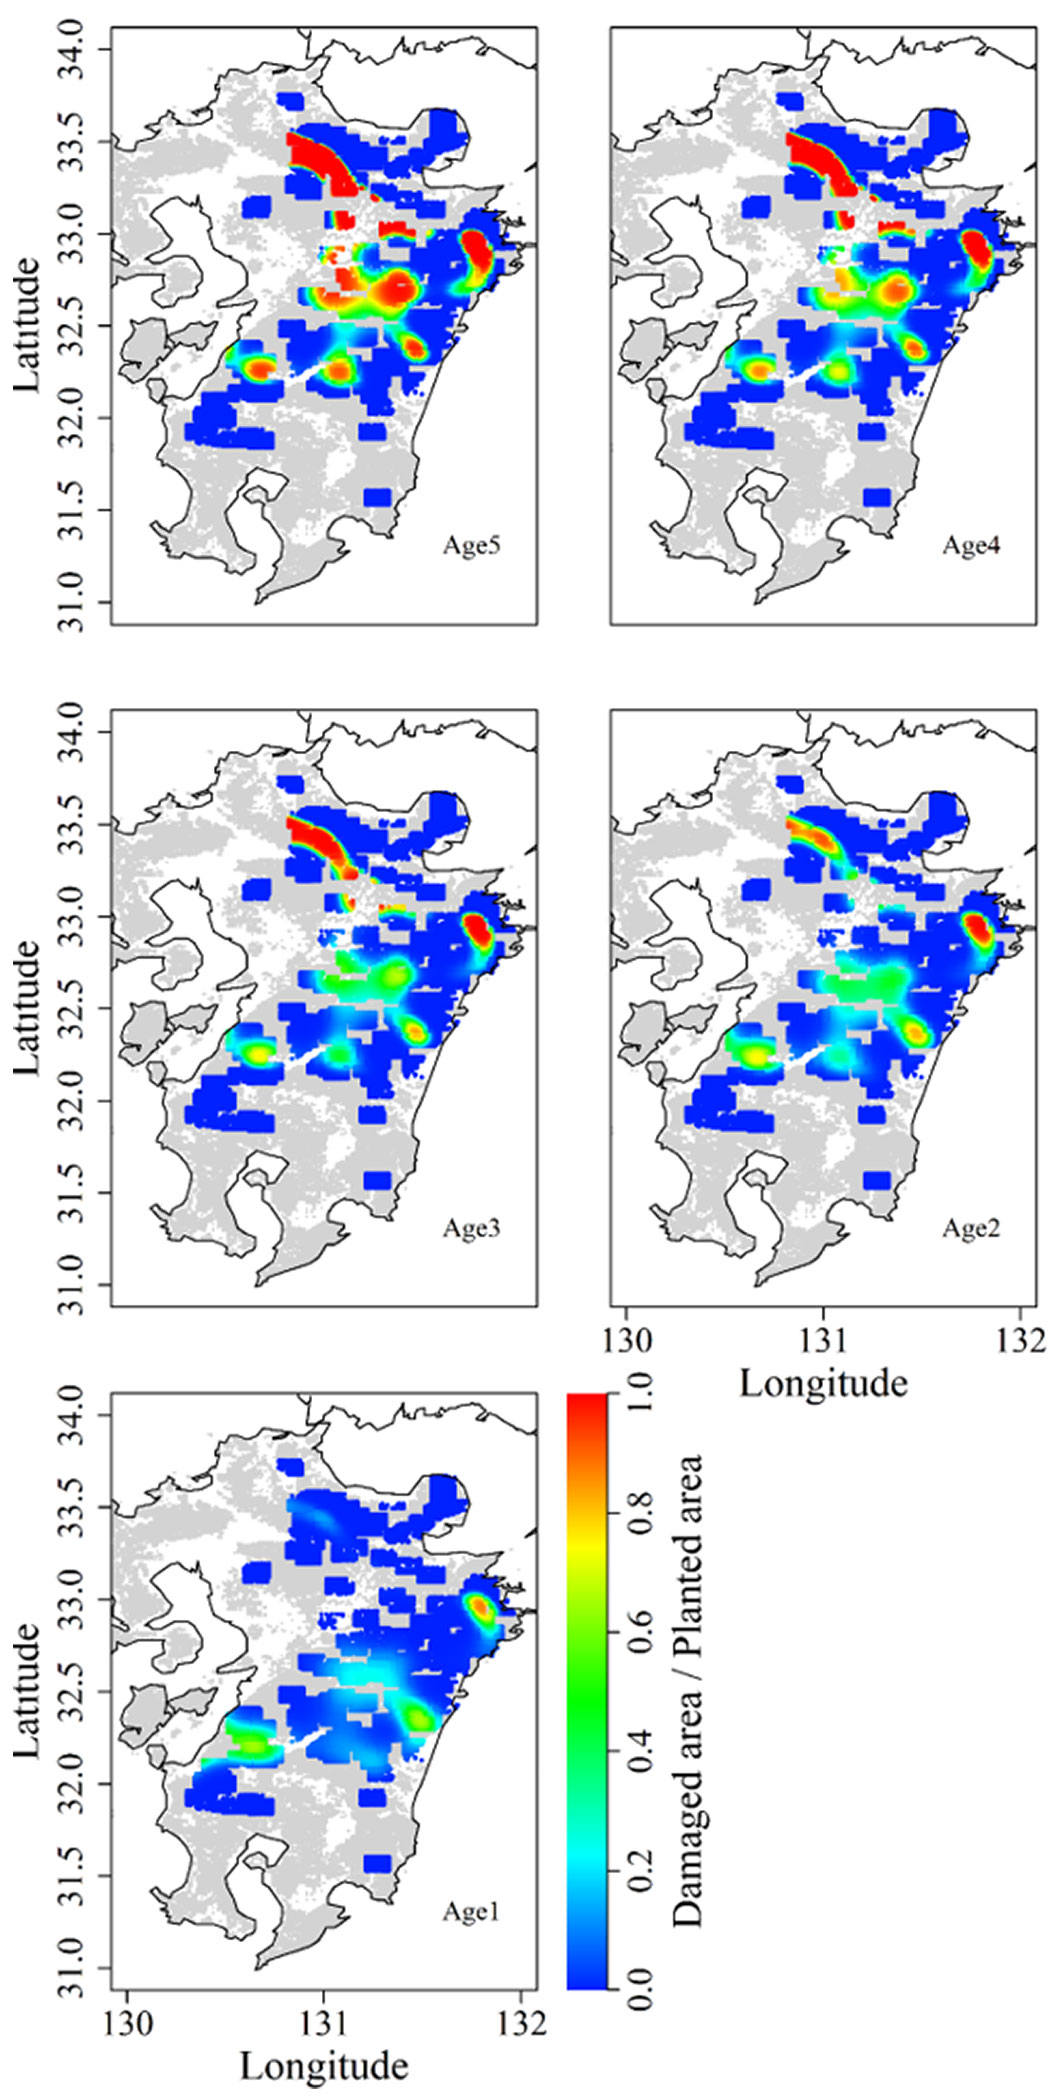
We produced damage distribution maps (Fig. 3) based on the model. A few core areas showed high browsing damage, and those locations differed in plantation age, as the effect of the interaction showed. In the northern part of the study area (>33.0° N), one core area containing plantation stands aged 2+ years showed serious damage. In contrast, plantation stands with an age of 1 year showed slight damage. In the central (>32.5 to ≤33.0° N) and southern (≤32.5° N) parts of the survey area, even 1-year-old plantation stands faced relatively high damage, and plantation stands with trees aged 3 or 4 years suffered extensive damage.
Fig. 3 - Distribution map of areas of browsing damage on Kyushu Island, Japan. Browsing damage measured at each plantation was extrapolated to the surrounding 100 km2. Grey and colored areas indicate forest; white areas are not forested. Age in each panel indicates the plantation age.
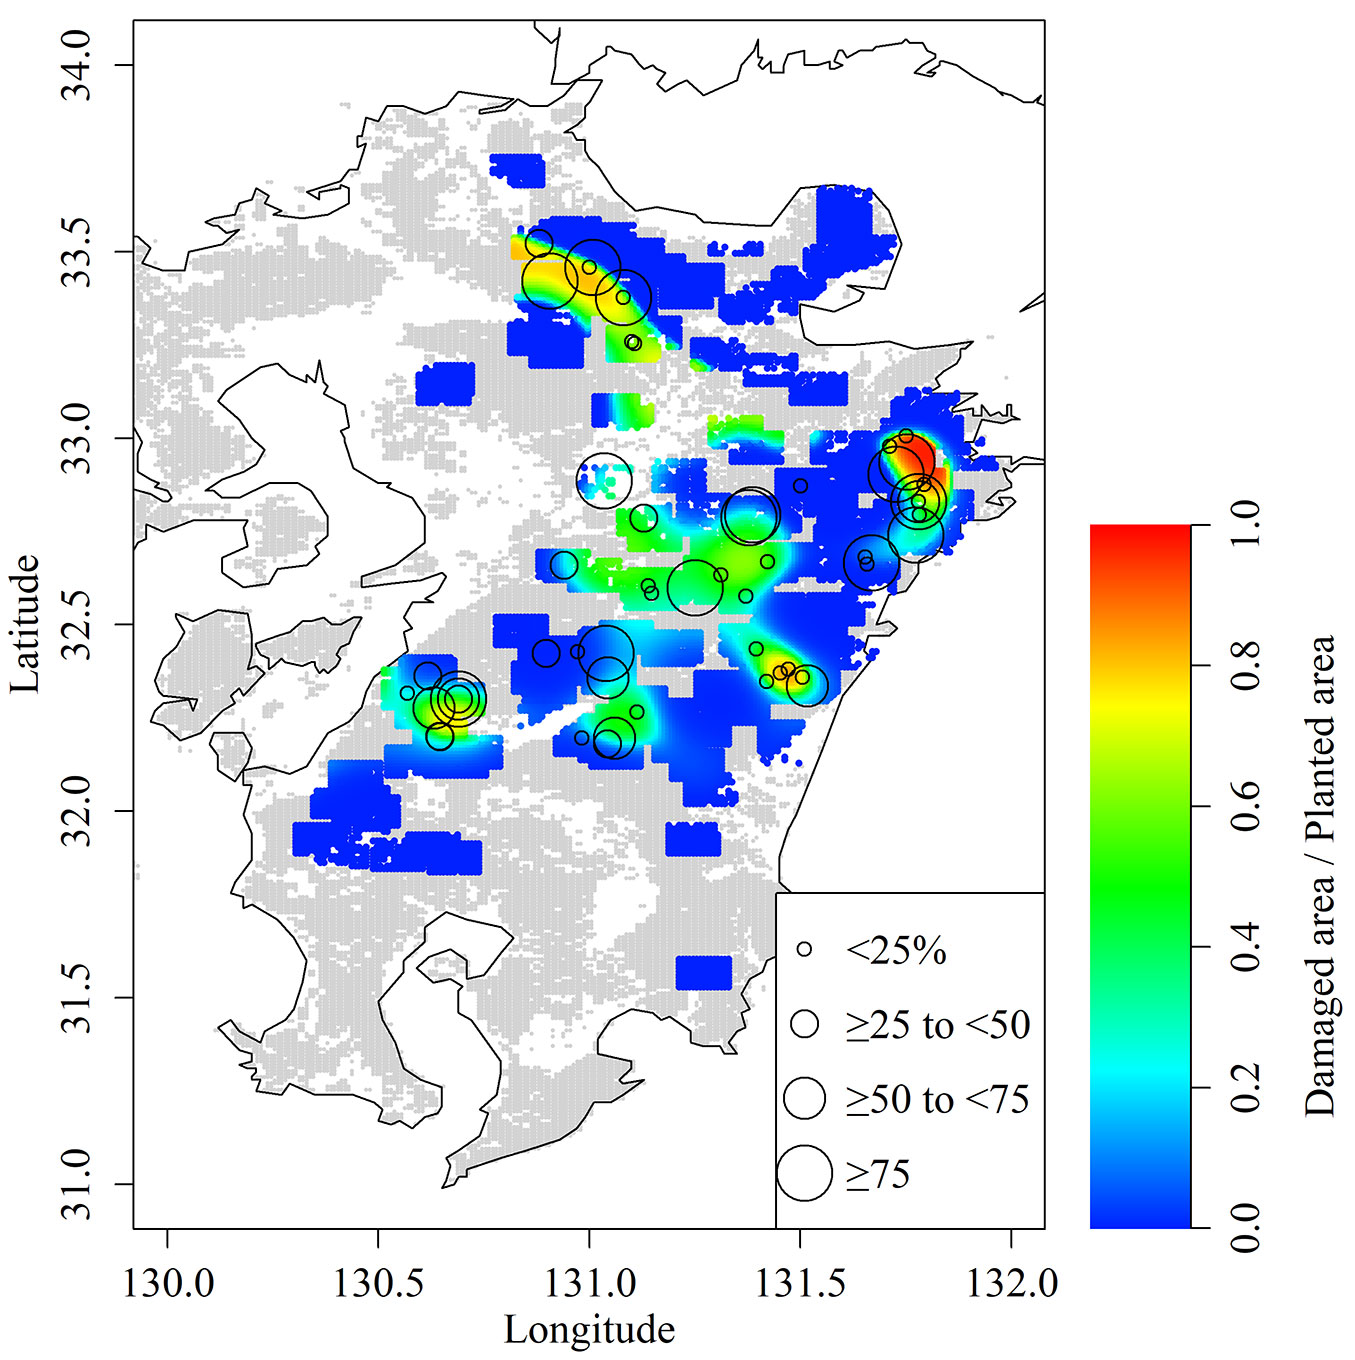
The GLM showed a strong positive correlation between the proportion of damaged area and the damage level (n = 76, χ2 = 88.59, p < 0.001). We layered damage level plots on the map showing mean proportion of damage area across all plantation ages produced by the GAM (Fig. 4). Plantations with higher damage levels tended to be concentrated around the extensive damaged areas. In contrast, some plantations with a low damage level were located in areas with a high proportion of damaged area.
Fig. 4 - Comparison of proportion of damaged area (contour) estimated by generalize additive model and damage levels in each site (circle).
Relationship between browsing damage and deer density
Results of the GAM for sika deer density index (r2 = 0.363, deviance explained = 30.3%) showed that survey year and location as well as the interaction between the two variables affected deer density (Tab. 4). We compared actual deer index with deer index estimated by using four-fold cross validation of the GAM. Spearman’s correlation test showed a significant positive correlation (ρ = 0.548, P < 0.001). Thus, the estimation accuracy of this model was relatively high. Although density index tended to increase gradually on Kyushu Island (Fig. 5), the increase rates differed among locations (Fig. 6). In the northern area, deer density gradually increased year by year, and density index exceeded 3.5. The central to southern areas had a few core areas of high deer density. During the study period, the high-density area around 32.5° N expanded and the density increased. In the other core areas, deer density did not change markedly, but the size of the core area expanded slightly.
Tab. 4 - Summary of the generalized additive model of density of sika deer. (year): survey year; (lat): latitude; (lon): longitude.
| Independent variables | edf | F | P value |
|---|---|---|---|
| s(year) | 4.32 | 3.32 | 0.001 |
| te(lat, lon) | 2.00 | 18.17 | <0.001 |
| ti(lat, lon, by = year) | 58.77 | 10.22 | <0.001 |
Fig. 5 - Temporal change of estimate deer density index. The continuous line is the best-fit curve generated by the generalized additive model, dashed lines show 80% confidence intervals.
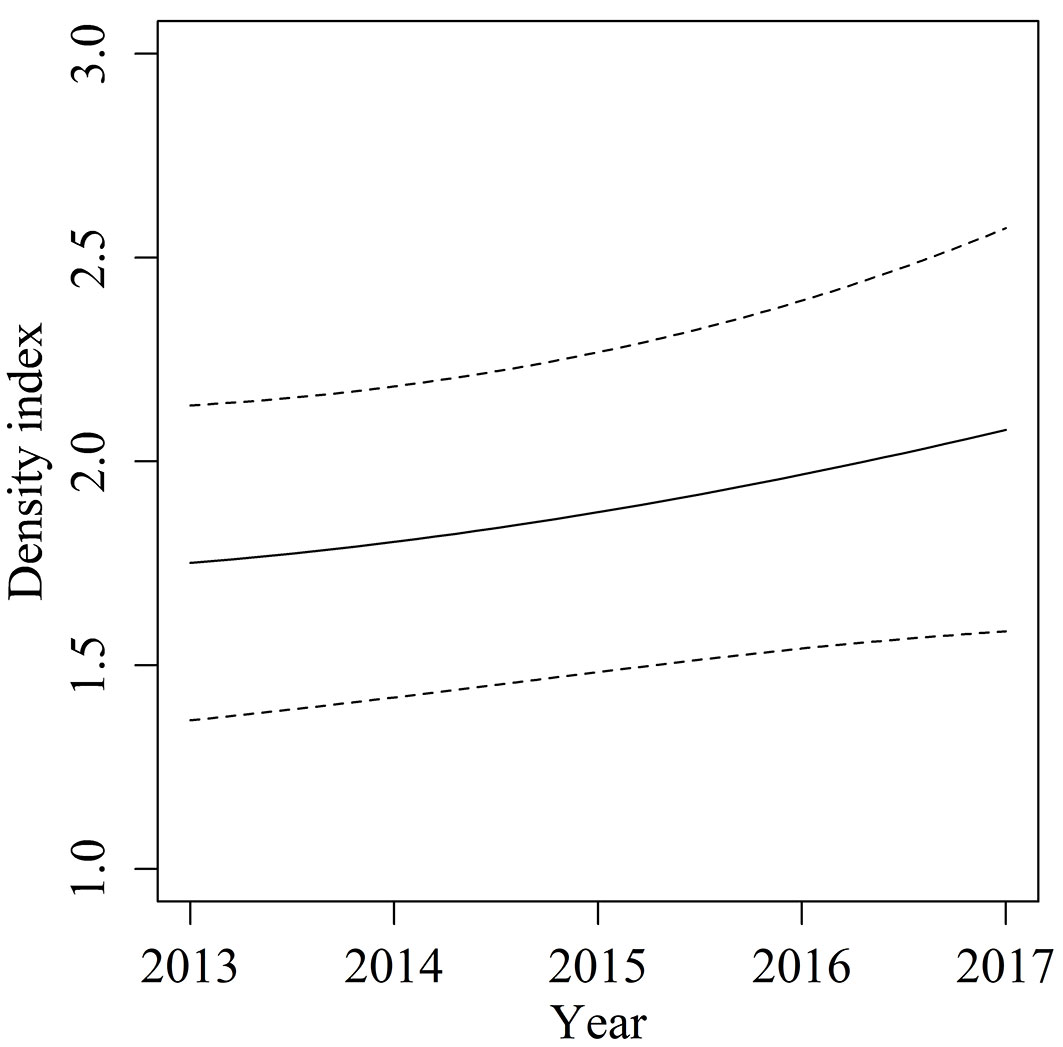
Fig. 6 - Estimated deer density on Kyushu Island, Japan, from 2013 to 2017. Deer density was extrapolated to the 100 km2 surrounding density survey points. Grey and colored areas indicate forest; white areas are not forested.
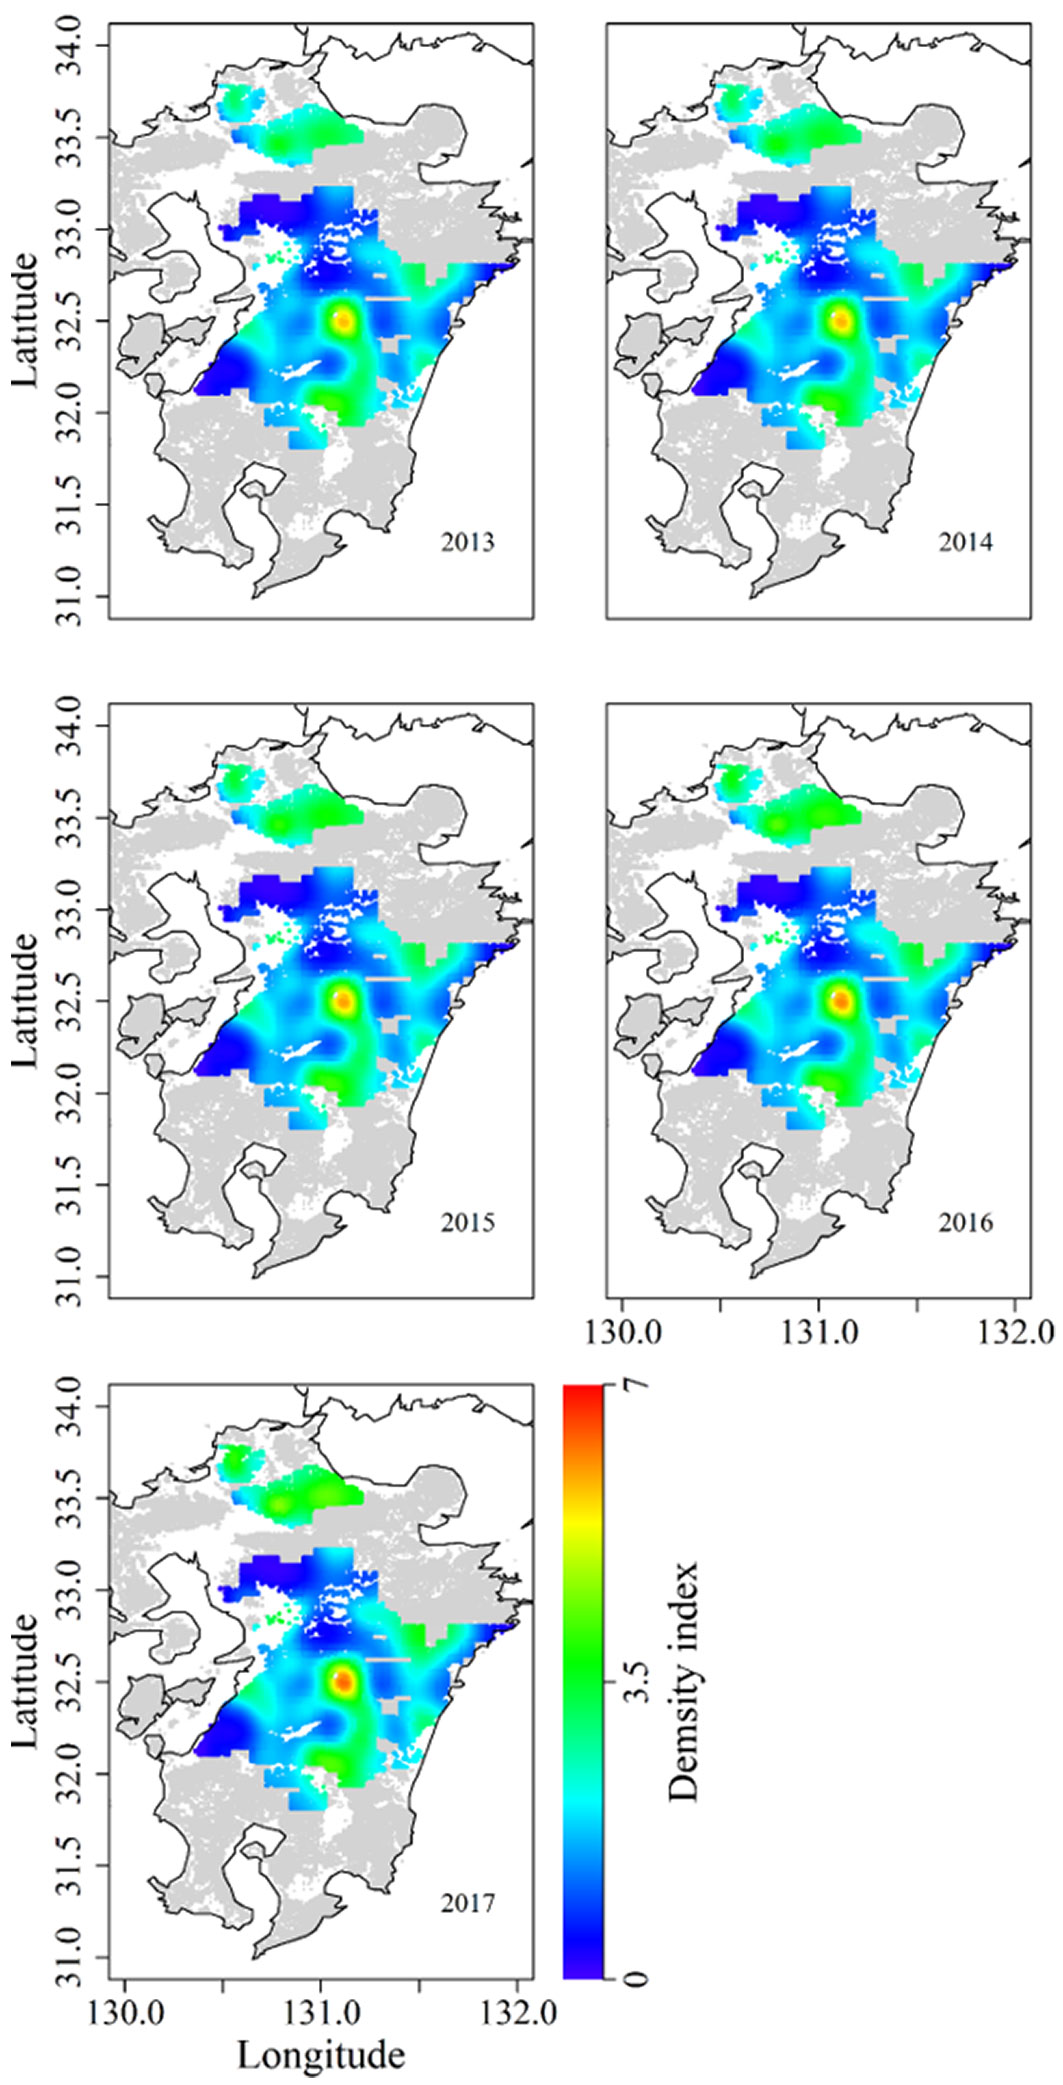
Locations of core areas with high browsing damage appeared to be a relatively good fit with areas of high deer abundance (Fig. 3 and Fig. 6). For example, the highest browsing pressure occurred in the north, where deer density indexes were consistently ≥3.5. In the central area, very high browsing pressure occurred around the core area with highest deer density. In the south, density indexes ≥3.5 were observed in two of the three areas with high browsing pressure. However, when we viewed the data at a finer scale, few discrepancies between damage and deer density became apparent. For example, in the north, although deer density was relatively high in 2017, browsing damage was low in plantation stands aged 1 year, planted in 2017. In addition, although deer densities in the north were lower than those in the central area or the south during the study period, damage was higher in the north than in the southern part of the central area. In addition, in the southwest deer density was low but browsing pressure was high.
Discussion
Because the estimation accuracy of this model in four-fold cross validation was relatively high, we consider that the GAM represents large-scale browsing damage relatively well. In addition, areas of high browsing damage generally coincided with areas of high deer abundance. This means that damage can actually occur.
We identified a few core areas with high browsing pressure. Also, areas with high damage level matched areas with a high proportion of damaged area relatively well. Thus, we suggest that planting should be avoided in these areas, because it will likely meet with low success. However, there is a caveat. The model showed that browsing damage increases as plantation age increases, which indicates that browsing damage accumulates year on year and/or the amount of forage increases with plantation age. Thus, low browsing pressure in the first year of planting may not be a recommendation to plant more trees in the area. As in the northern part of our study area, browsing pressure may markedly increase in plantations aged 2 years and older even if browsing pressure is low in the first year. Thus, plantation stands aged at least 2 years may be better indicators of where browsing pressure will be high.
A few studies have predicted the distribution of forest damage by using additive models ([32]). These studies predicted damage from physical factors such as storms and wind. In contrast, this study indicates that a GAM can be used to predict the damage caused by biological factors. In this study, we considered the association between browsing damage and sika deer density. However, deer species other than sika deer also damage forests ([27], [1]). We consider that this model could also be used to predict browsing damages by other deer species.
We studied the patterns of browsing damage caused by sika deer in tree plantations on Kyushu Island, Japan. Our comparison of the distribution of browsing damage with deer density at the landscape level is novel, because many previous studies examining the effect of deer density on browsing were performed at a small scale, in single plantations or site unit level ([10], [16], [41], [24], [18], [11]). We used data from 1995 to 2018 in the model and estimate deer density from 2013 to 2017, because estimate accuracy usually increases as the size of the dataset increase. Although core areas of browsing damage and high deer density generally coincided, there were discrepancies between browsing pressure and deer density in some areas. Browsing pressure by deer is determined not only by density but also by the habitat, especially food abundance ([26], [27], [19], [35]). We did not evaluate the effect of the local environment because we wanted to focus on the large-scale comparison between deer density and browsing pressure. To clarify the factors causing the discrepancies, the environmental factors affecting browsing should be studied at a smaller scale.
Conclusion
Reducing browsing damage is an important factor for sustainable forestry management. In this study, we modelled a large-scale spatial variation in deer browsing damage by using a GAM. Because high browsing pressure on young trees is an important factor that reduces the success of mature trees, using this model to predict browsing pressure could help to reduce economic losses caused by deer browsing. In addition, because our model is very simple, consisting of only two independent factors (plantation age and location) it can easily be reproduced in other areas. We expect that the model will help to select locations for new plantations in deer habitats.
Acknowledgements
Data from pellet count surveys were provided by the Kumamoto, Miyazaki, and Fukuoka prefecture governments. We thank Dr. N. Kotaka for helpful comments concerning this study. We acknowledge the invaluable comments of the two anonymous reviewers on earlier versions of this manuscript.
Funding
This study was funded by the Forestry and Forest Products Research Institute (grant no. 201703).
References
Gscholar
Gscholar
Gscholar
Gscholar
Authors’ Info
Authors’ Affiliation
Hiromi Yamagawa
Masatoshi Yasuda
Hiroshi Kondoh 0000-0001-6128-8421
Haruto Nomiya 0000-0002-8361-7879
Kyushu Research Center, Forestry and Forest Products Research Institute, Kumamoto 860-0862 (Japan)
Institute of Agricultural and Forest Resources, Fukuoka Agriculture and Forestry Research Center, Fukuoka 839-0827 (Japan)
Seikai National Fisheries Research Institute, Japan Fisheries Research and Education Agency, Nagasaki 851-2213 (Japan)
Present address: Socio-Ecological Systems Division, Fisheries Stock Assessment Center, Fisheries Resources Institute, Japan Fisheries Research and Education Agency, Yokohama 236-8648 (Japan)
Department of Wildlife Biology, Forestry and Forest Products Research Institute, Tsukuba, 305-8687 (Japan)
Corresponding author
Paper Info
Citation
Suzuki KK, Watanabe Y, Kubota T, Kuwano Y, Kawauchi Y, Yamagawa H, Yasuda M, Kondoh H, Nomiya H, Oka T (2021). Large-scale spatial distribution of deer browsing damage to young tree plantations. iForest 14: 34-40. - doi: 10.3832/ifor3387-013
Academic Editor
Giorgio Alberti
Paper history
Received: Feb 27, 2020
Accepted: Nov 12, 2020
First online: Jan 14, 2021
Publication Date: Feb 28, 2021
Publication Time: 2.10 months
Copyright Information
© SISEF - The Italian Society of Silviculture and Forest Ecology 2021
Open Access
This article is distributed under the terms of the Creative Commons Attribution-Non Commercial 4.0 International (https://creativecommons.org/licenses/by-nc/4.0/), which permits unrestricted use, distribution, and reproduction in any medium, provided you give appropriate credit to the original author(s) and the source, provide a link to the Creative Commons license, and indicate if changes were made.

Web Metrics
Breakdown by View Type
Article Usage
Total Article Views: 42538
(from publication date up to now)
Breakdown by View Type
HTML Page Views: 34732
Abstract Page Views: 3375
PDF Downloads: 3614
Citation/Reference Downloads: 3
XML Downloads: 814
Web Metrics
Days since publication: 1987
Overall contacts: 42538
Avg. contacts per week: 149.86
Article Citations
Article citations are based on data periodically collected from the Clarivate Web of Science web site
(last update: Mar 2025)
Total number of cites (since 2021): 10
Average cites per year: 2.00
Publication Metrics
by Dimensions ©
Articles citing this article
List of the papers citing this article based on CrossRef Cited-by.
Related Contents
iForest Similar Articles
Research Articles
Understory vegetation dynamics and tree regeneration as affected by deer herbivory in temperate hardwood forests
vol. 10, pp. 837-844 (online: 26 October 2017)
Research Articles
The impact of seed predation and browsing on natural sessile oak regeneration under different light conditions in an over-aged coppice stand
vol. 9, pp. 569-576 (online: 04 April 2016)
Research Articles
Effect of imperfect detection on the estimation of niche overlap between two forest dormice
vol. 11, pp. 482-490 (online: 18 July 2018)
Research Articles
Height-diameter models for maritime pine in Portugal: a comparison of basic, generalized and mixed-effects models
vol. 9, pp. 72-78 (online: 11 June 2015)
Research Articles
Impact of management practices on habitat use by birds in exotic tree plantations in northeastern Argentina
vol. 19, pp. 38-44 (online: 06 February 2026)
Research Articles
Variability of ant community composition in cork oak woodlands across the Mediterranean region: implications for forest management
vol. 10, pp. 707-714 (online: 27 July 2017)
Research Articles
Interactions between thinning and bear damage complicate restoration in coast redwood forests
vol. 13, pp. 1-8 (online: 08 January 2020)
Research Articles
Effects of forest management on bird assemblages in the Bialowieza Forest, Poland
vol. 8, pp. 377-385 (online: 02 October 2014)
Research Articles
Effect of the plantation age on the use of Eucalyptus stands by medium to large-sized wild mammals in south-eastern Brazil
vol. 8, pp. 108-113 (online: 21 July 2014)
Research Articles
Estimation of forest cover change using Sentinel-2 multi-spectral imagery in Georgia (the Caucasus)
vol. 13, pp. 329-335 (online: 07 August 2020)
iForest Database Search
Search By Author
Search By Keyword
Google Scholar Search
Citing Articles
Search By Author
Search By Keywords
PubMed Search
Search By Author
Search By Keyword


