Understory vegetation dynamics and tree regeneration as affected by deer herbivory in temperate hardwood forests
iForest - Biogeosciences and Forestry, Volume 10, Issue 5, Pages 837-844 (2017)
doi: https://doi.org/10.3832/ifor2186-010
Published: Oct 26, 2017 - Copyright © 2017 SISEF
Research Articles
Abstract
Plant competition and deer browsing are two main factors which limit tree recruitment. We examined natural tree-recruitment processes under continuous-tree-cover management. Changes in plant communities and tree regeneration were monitored over an eight-year period at two different sites in a temperate hardwood forest in the North-East of France. We used paired control plot (unfenced areas, free access to deer) and exclosures (fenced areas, excluding deer) at both sites. Shade-tolerant browsing-tolerant opportunistic species (beech, Fagus sylvatica at site 1 and bramble, Rubus spp. at site 2) were present in low numbers at the beginning of the study. We found that these species used a sit-and-wait strategy, waiting for opportunities to proliferate (thinning and deer exclusion). In the exclosure at site 1, beech proliferate slowly. In the exclosure at site 2, bramble proliferated enough during the first two growing seasons to prevent tree recruitment. Thus, fencing encouraged beech sapling or bramble growth, and this growth in turn was detrimental to the richness and diversity of the plant community. The two study cases presented show that both plant competition and deer browsing can be problematic for tree recruitment. Our results further suggest that excluding deer is not sufficient to enhance the growth of browse-sensitive and moderately shade-tolerant tree species such as oaks (Quercus petraea and Q. robur).
Keywords
Understory Vegetation, Plant Interaction, Competition, Browsing, Forest Regeneration, Exclosure
Introduction
The recruitment of vigorous, high-quality trees in sufficient quantity to ensure forest regeneration is a major issue in forestry. Forest renewal can be accomplished either through artificial (seeding or planting) or natural regeneration. The latter approach conforms with the basic principles of close-to-nature forest management (CNFM - [35]) and continuous-cover forestry (CCF - [32]), two concepts which attempt to reconcile wood production and other ecosystem services. Selective thinning is a basic technique in such forestry approaches, and ensures that young trees have enough light for proper growth while limiting the development of a dense competitive understory ([6]). Indeed, strong competition from surrounding vegetation is a major obstacle to successful natural regeneration ([2]) and can affect seed germination, seedling establishment, and sapling growth and survival ([9], [15]).
Deer populations in recent decades have increased exponentially in numerous regions of the Northern hemisphere ([1]). Locally, forest managers are facing increasingly challenging situations for forest regeneration due to the impact of browsing, fraying and bark stripping on the growth and survival of commercially important tree species ([30], [17]). Furthermore, deer exclusion by fencing is expensive and is not likely to be a universally appropriate tool to prevent deer damage. For example, Wasem & Häne ([38]) reported that excluding deer did not enhance tree recruitment because understory competition from bramble increased in the exclosure due to a lack of browsing. This plant strategy has been referred to as the “sit and wait” strategy. Greenberg et al. ([18]) found that a non-indigenous species (Celastrus orbiculatus Thunb.) in North America was able to take root and persist in undisturbed sites, then benefit from a disturbance (canopy opening) to suddenly proliferate and prevent tree recruitment. Species that are resistant or tolerant to browsing (e.g., through high growth rate, stored reserves, chemical or mechanical defenses) can have a head start over other species. Deer can modify the relative competitive ability of certain plants within a plant community. Indeed, differences in palatability and abundance between two competing species may give one species a competitive advantage over the other ([28]).
In our study, we assessed the impact of high densities of roe deer (Capreolus capreolus) and red deer (Cervus elaphus) on vegetation dynamics and tree recruitment. We used eight years of vegetation monitoring data from paired control-exclosure plots under continuous canopy cover in two temperate broadleaved forest sites in the North-East of France. Specifically, we tested whether deer browsing affected tree-understory vegetation interactions. Finally, we attempted to clarify the role of understory vegetation competition, browsing pressure and the interactions of these two parameters to help orient future forest management in the context of CNFM/ CCF.
Materials and methods
Study area
We set up a paired control plot-exclosure field experiment in the National Hunting and Wildlife Reserve (NHWR) of “La Petite Pierre”, a 27-km² forested area located in the Vosges Mountains in North-Eastern France (48.5° N, 7.0° E). The mean elevation is around 300 m a.s.l. The climate is continental with oceanic influences; winters are relatively mild and summers are cool (mean January and mean July temperatures are 1.3 ± 0.9 and 19.4 ± 0.7 °C, respectively - Météo France data from the Phalsbourg weather station, 10 km from La Petite Pierre). The mean rainfall during the study period (2005-2013) was 866 ± 43 mm per year. Poor acidic soils lie on sandstone bedrock and vegetation is of poor nutritive quality. The setup was located on two different sites whose characteristics are shown in Tab. 1. Soil type was brunisol and humus ranged from oligo-mull to hemi-moder.
Tab. 1 - Description of the two sites: forest characteristics and treatments. (a): Status at the beginning of the study (2005 for site 1 and 2006 for site 2); (b): Status in 2016 based on a subsample. The number of subplots at the end of the study in 2014 are shown in brackets. The forest site type at both sites is “sessiliflorous oak woodland on low acidic soils”.
| Variable | Units | Species | Site 1 | Site 2 | ||
|---|---|---|---|---|---|---|
| Exclosure | Control | Exclosure | Control | |||
| No. of subplotsa | - | - | 21 (6) | 21 (14) | 21 (21) | 60 (40) |
| Slopea | % | - | 12 | 22 | 2 | 4 |
| Basal areaa | m2 ha-1 | - | 24 | 24 | 13 | 23 |
| Basal areab | m2 ha-1 | - | 21 | 18 | 35 | 19 |
| Mean heightb | m | Beech | 26.5 ± 1.6 | 25.7 ± 1.4 | 43.7 ± 0.3 | 23.2 ± 1.6 |
| Oak | 29.9 ± 0.7 | 29.1 ± 1.1 | 36.4 ± 2.3 | 32.6 ± 1.5 | ||
| Dominant diameter classa |
cm | - | 40.5 - 59.5 | 40.0 - 60.5 | 23.0 - 40.5 | 23.0 - 40.5 |
| Dominant diameter classb |
cm | - | 47.5 - 67.5 | 47.5 - 67.5 | 27.5 - 47.5 | 27.5 - 47.5 |
| Average ageb | year | Beech | 90 | 90 | 160 | 150 |
| Oak | 100 | 100 | 140 | 150 | ||
| Thinning regime | - | - | 81 m3 ha-1 removed every 6 years | 68 m3 ha-1 removed every 8 years | ||
| Natura 2000 Habitat | - | - | Milio-Fagetum and Merculario-Abietum | Luzulo- Fagetum | ||
Deer populations
Roe deer and red deer are the main large herbivores, while large predators are absent from the study area. Deer populations are mainly regulated by hunting. To estimate red deer populations, spotlight counts were carried out following Garel et al. ([16]); roe deer populations were monitored by the pedestrian kilometric index according to Vincent et al. ([37]). We expressed the count in terms of number of deer per km to account for differences in road length. Red deer population densities (ind km-2) were estimated by the relationship between spotlight counts and Capture-Mark-Recapture (CMR) data following the methodology given by Garel et al. ([16] - Tab. 2). Unfortunately, no equivalent method exists to make reliable estimates of roe deer population densities, but roe deer population is lower in the study area.
Tab. 2 - Yearly dynamics of the mean number of roe deer (pedestrian kilometric index according to [37]) and red deer (spotlight counts according to [16]) observed per kilometer.
| Year | Roe deer | Red deer |
|---|---|---|
| 2005 | 0.33 | 0.65 |
| 2006 | 0.32 | 0.65 |
| 2007 | 0.43 | 0.73 |
| 2008 | 0.34 | 0.79 |
| 2009 | 0.3 | 0.72 |
| 2010 | 0.37 | 1.1 |
| 2011 | 0.2 | 0.85 |
| 2012 | 0.24 | 0.72 |
| 2013 | 0.15 | 0.71 |
| 2014 | 0.15 | 1.1 |
Experimental setup
Paired control plot and exclosure were used: one plot (fenced plot, hereafter “exclosure”) was fenced to exclude deer while the other plot was left open to natural deer browsing (unfenced plot, hereafter “control plot”). The experiments were set up in mature beech/oak forests at two different sites (about 2.2 km apart). One pair of control-exclosure plots was established in the winter of 2005 at site 1 (1.6 ha) and in the winter of 2006 at site 2 (1.5 ha). We systematically assigned 21 circular subplots (4 m2) in each of the control and exclosure plots at site 1; at site 2, 60 circular subplots (4 m2) were established in the control plot and 30 in the exclosure. The average distance between subplots was 17.3 ± 2.1 m at site 1 and 54.7 ± 21.3 m at site 2. Fences were approximately 2.3 m tall and were maintained throughout the course of the study. At both sites, thinning was undertaken before the set-up of the experiment (Tab. 1).
Data collection
Plant cover of all vascular plant species (expressed as the relative area covered by a species in percentage) was estimated with the Braun-Blanquet 7-grade cover-abundance scale ([8]). In addition, young trees were identified at species level and categorized as seedlings (height ≤ 15 cm) or saplings (15 cm < saplings ≤ 3 m). We also estimated density and mean height for saplings only (by species) in each subplot. These measurements were used to compare establishment and growth for the five target tree species: beech (Fagus sylvatica), sycamore maple (Acer pseudoplatanus), hornbeam (Carpinus betulus), sessile (Quercus petraea) and pedunculate oak (Q. robur). We combined the two oak species into a single category (hereafter “oak”) since considerable hybridization between sessile and pedunculate oaks prevented us from distinguishing these two species. We collected data between May 15 and June 15 every two years from 2006 to 2014 (with one additional survey in 2005 for site 1 only). In addition, we used the Braun-Blanquet 7-grade cover-abundance scale to estimate overall plant cover at each subplot for three vegetation layers: tree layer (woody vegetation >2.0 m), shrub layer (woody vegetation 2.0-0.5 m) and herbaceous layer (woody and non woody plant species <0.5 m).
Calculation and statistical analyses
We assumed the spatial distribution of individual plants to be independent and estimated the overall plant cover following Fischer ([13]). Community diversity was estimated using diversity indices calculated by taking into account all the species in the botanical surveys: species richness (S) and Piélou’s equitability (J - [31]).
We chose to focus on the most common tree and plant species. We therefore excluded all rare species and retained only the species recorded with a cover of more than 2.5 % in more than 5 % of the subplots of at least one site. Thus, we restricted our analyses to the four target tree species previously mentioned (beech, sycamore maple, hornbeam and oak) and 21 understory plant species (see Tab. S1 in Supplementary material). Because understory vegetation dynamics differed between the two sites as shown by non-metric multidimensional scaling (NMDS - [29]), we performed separate analyses for each site. We acknowledge that the statistical inferences from this work have some limitations due, in part, to pseudo-replication sensu Hurlbert ([21]). Our study should therefore be taken as a comparison between two contrasting case studies. To avoid possible over-estimates in our results, we applied more conservative non-parametric tests (Wilcoxon tests, Kruskal-Wallis rank tests) rather than parametric tests and we made restrictive use of p-values. Dunn ([12]) a posteriori multiple comparison tests were conducted on data that varied significantly from year to year. Seedling and sapling density, sapling height and diversity index were all analyzed in the same manner. Semi-variograms were performed in order to assess the presence of any patterns of spatial auto-correlation of response variables among subplots. All the analyses were performed using the R 3.1.0 statistical package ([33]).
Results
Deer populations
In our study area, the mean number of deer observed per kilometer was 0.32 ± 0.005 (mean ± standard error of the mean) for roe deer and 0.80 ± 0.08 for red deer, corresponding to an average of 39.6 ± 11.2 (minimum: 14.5; maximum: 105.6) red deer per km² ([16]). This is probably an overestimate of the overall yearly mean for local populations because migrating animals that do not live year round in the reserve were undoubtedly also counted. Albeit, Dumont et al. ([11]) showed that the risk of damage to broad-leaved seedlings was high at a density of 15 hinds per km².
Composition and diversity of the plant community
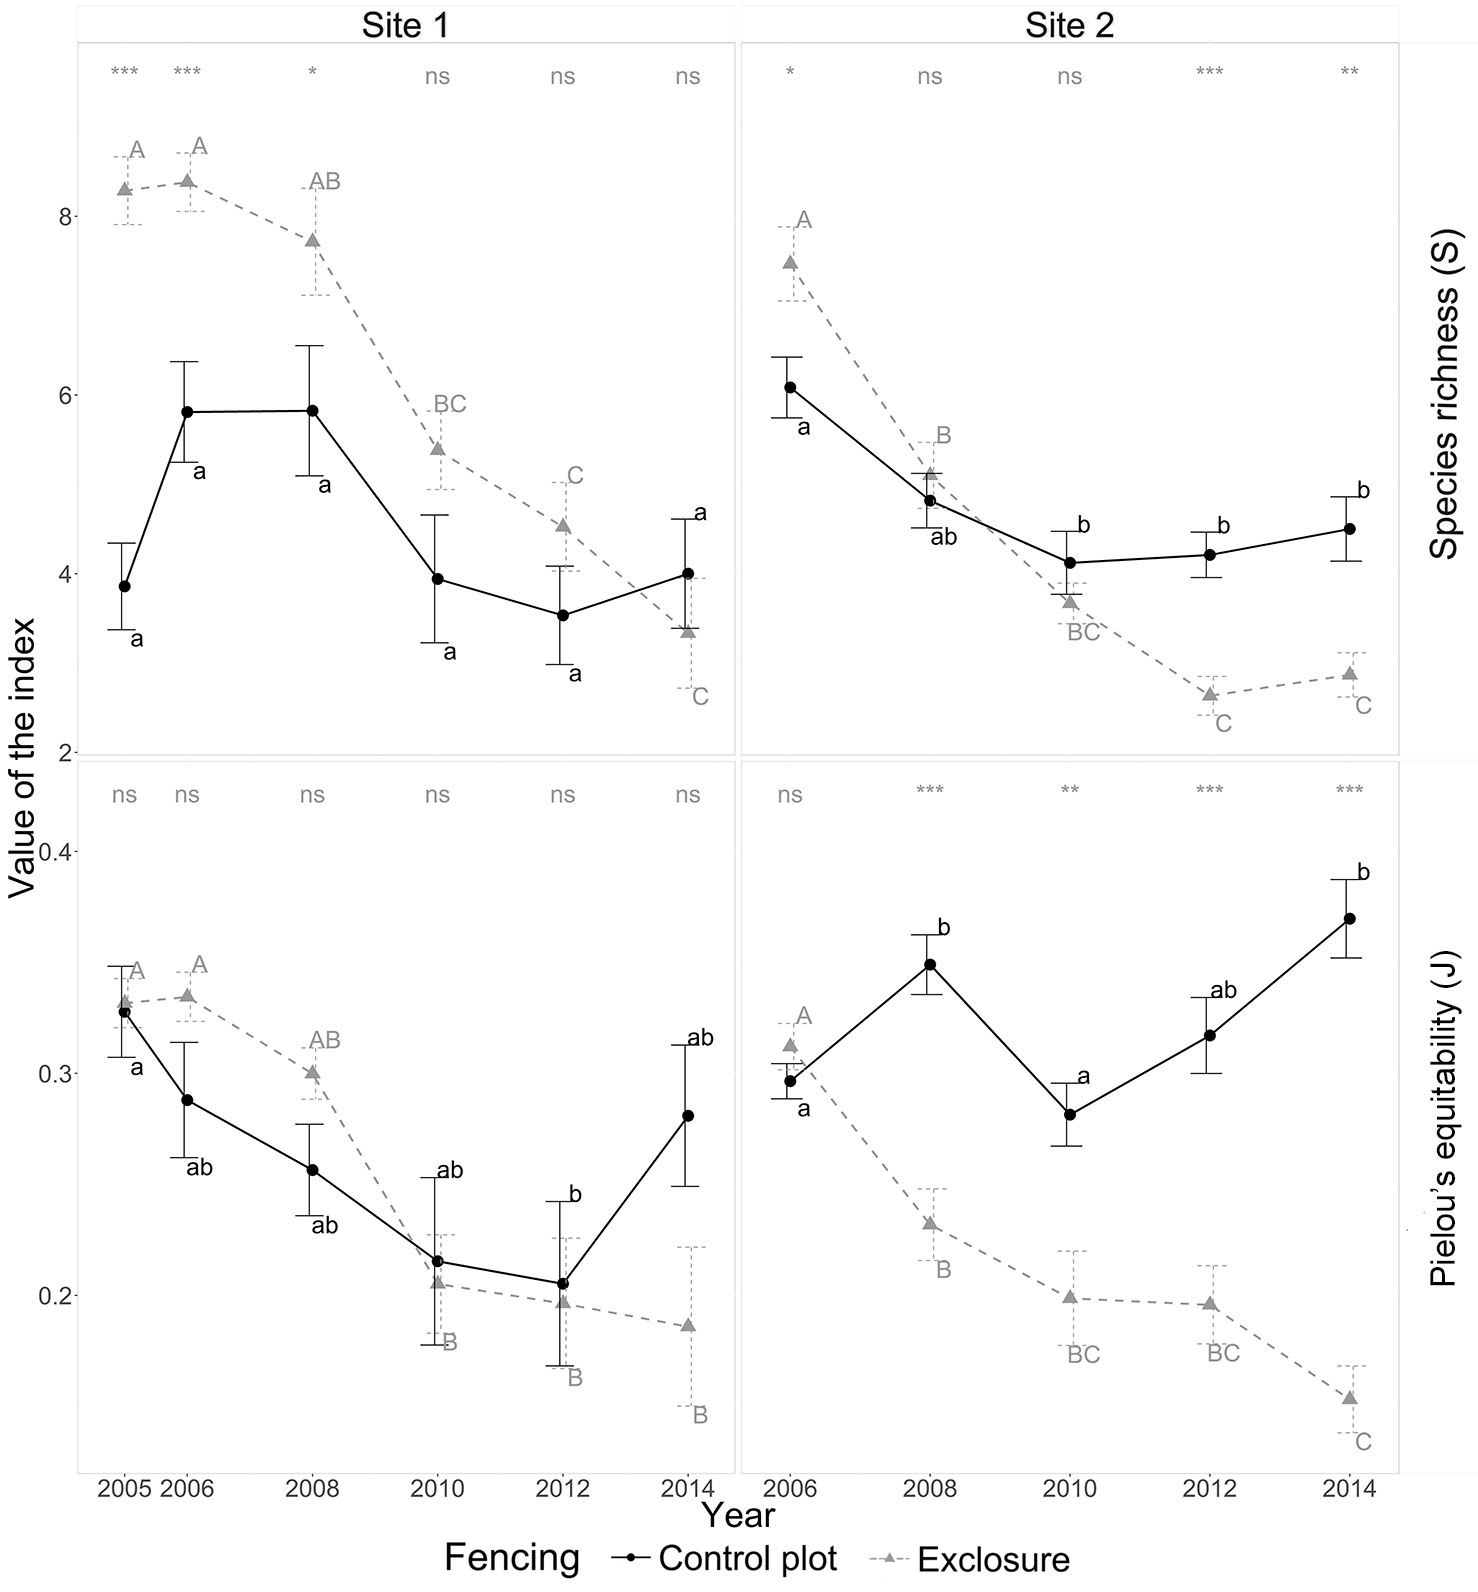
Plant community composition was consistently different between site 1 and site 2 (see Fig. S1b in Supplementary material). We recorded 90 different plant species: 69 at site 1 and 68 at site 2. Forty-seven species were common to both sites. At site 1, species richness at the beginning of the experiment was lower in the control plot (3.9 ± 0.5 species; mean ± SE) than in the exclosure (8.3 ± 0.4 species), but from 2010 to 2014 richness had become similar between control and exclosure plot (about 3.7 species in 2014 - Fig. 1) with a significant decrease in species richness in the exclosure plot. At site 2, species richness was consistently lower in the control plot (6.1 ± 0.4 species) than in the exclosure (7.5 ± 0.4 species) for the first five years of the experiment; then from 2012 to 2014, the situation reversed to consistently greater richness in the control (2014: 4.5 ± 0.4 species) than in the exclosure (2014: 2.9 ± 0.2 species). In site 2, Piélou’s equitability was similar between the control and exclosure plots at the beginning of the experiment (about 0.3). Furthermore, Piélou’s equitability consistently increased in the control plot (2014: 0.37 ± 0.02) and consistently decreased in the exclosure (2014: 0.15 ± 0.02) from 2008 to 2014. Plant communities shifted toward a more complex community structure in controls and toward a simpler community structure inside the exclosure (Fig. 1). For site 2, results are consistent with NMDS results (see Fig. S1 in Supplementary material): plant communities followed different trajectories in control and exclosure plots.
Fig. 1 - Yearly diversity index values in the presence of deer (control plot - solid line) and in the absence of deer (exclosure plot - dotted line) for sites 1 and 2 from 2005 to 2014. Error bars indicate standard errors of the mean. Wilcoxon tests were used to estimate differences between control and exclosure plots at each given year; the results of the tests are displayed at the top of each panel: (ns): non-significant; (*): p-value<0.05; (**): p-value<0.01; (***): p-value<0.001. Letters next to points indicate differences between successive years at a 5% probability (Kruskal-Wallis test): lower and upper case letters are for control and exclosure plots, respectively.
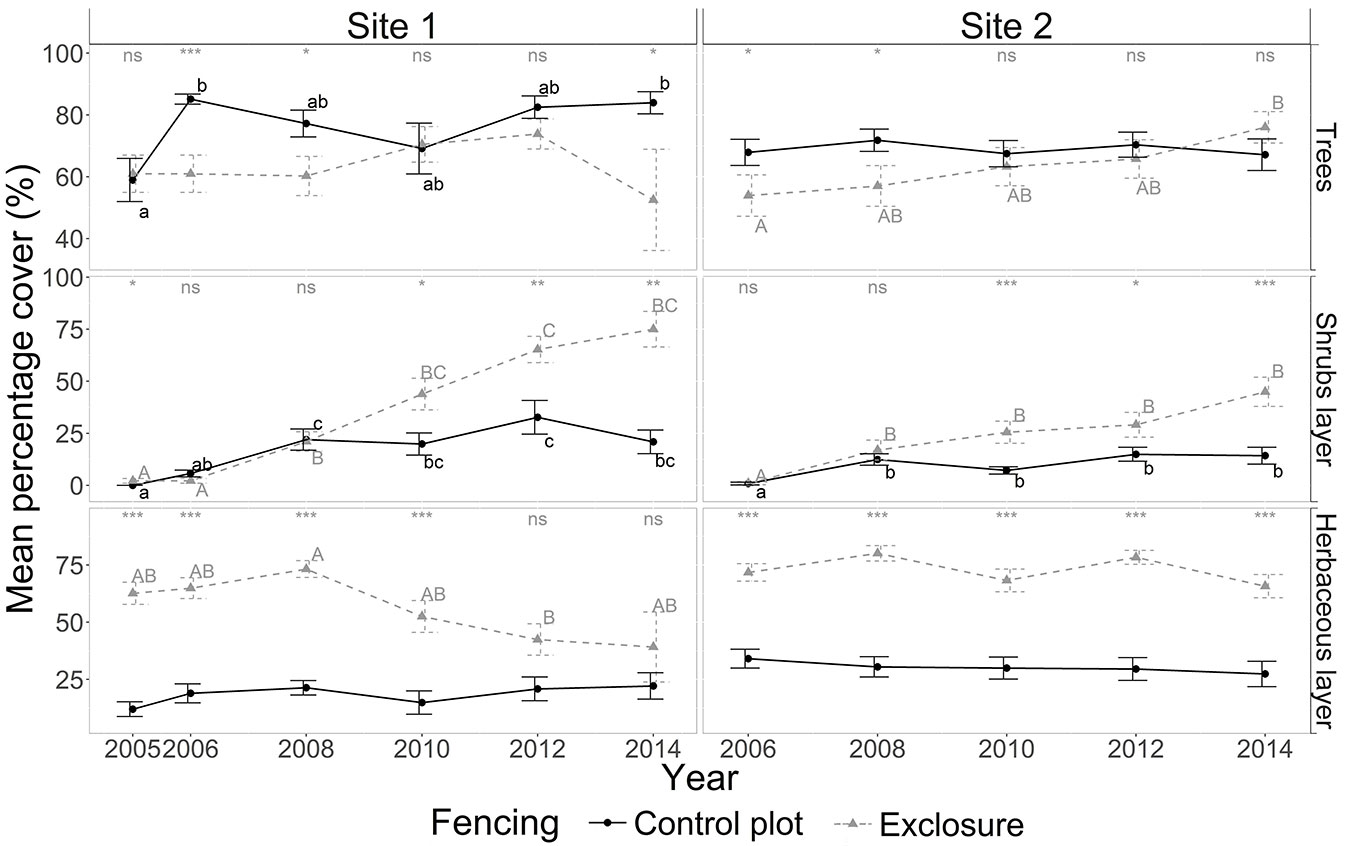
Average tree canopy cover was significantly greater (Fig. 2) in the control plot than in the exclosure at site 1 in 2006, 2008 and 2014; while no difference was observed between the control and exclosure plots the other years (2005, the beginning of the experiment, and 2010). At site 2, average tree canopy cover was significantly greater in the control plot than in the exclosure in 2006 and 2008 (Fig. 2). At both sites, shrub cover remained the same between control and exclosure plots at the beginning of the experiment (2006 - 2008), then became lower in the control plot from 2010 onwards (Fig. 2). Herbaceous cover showed different patterns at the two sites. At site 1, herbaceous plant cover decreased from 62.6 ± 4.8 % to 39.2 ± 15.3 % in the exclosure, reaching levels similar to those in the control plot (about 20 %) from 2012 onwards. At site 2, the herbaceous cover was greater in the exclosure (Fig. 2) and remained constant at about 72.8 ± 1.4 % compared to the control where it remained at about 30.5 ± 1.4 % throughout the study period.
Fig. 2 - Yearly dynamics in plant cover (%) for tree, shrub and herbaceous layers in the presence of deer (control plot, solid line) and in the absence of deer (exclosure plot, dotted line) for sites 1 and 2 from 2005 to 2014. For details on the legend, see Fig. 1.
Site 1: Beech-dominated understory
The exclusion of deer at site 1 resulted in a steady increase in beech cover from 21.3 ± 2.7 % in 2005 to 75 ± 8.5 % in 2014, while the progress in the control plot, though significant, was less pronounced (Fig. 3). It took five years to obtain a significant increase in beech cover in the exclosure plot compared to nine years in the control plot.
Fig. 3 - Yearly dynamics in cover (%) for the main tree, shrub and herbaceous understory species in the presence of deer (control plot, solid line) and in the absence of deer (exclosure plot, dotted line) for sites 1 and 2 from 2005 to 2014. Only species with a cover percentage greater than 2.5% in at least 5% of the sampled subplots at site 1 or 2 were considered. Note the different scales on the y axes. For details on the legend, see Fig. 1.
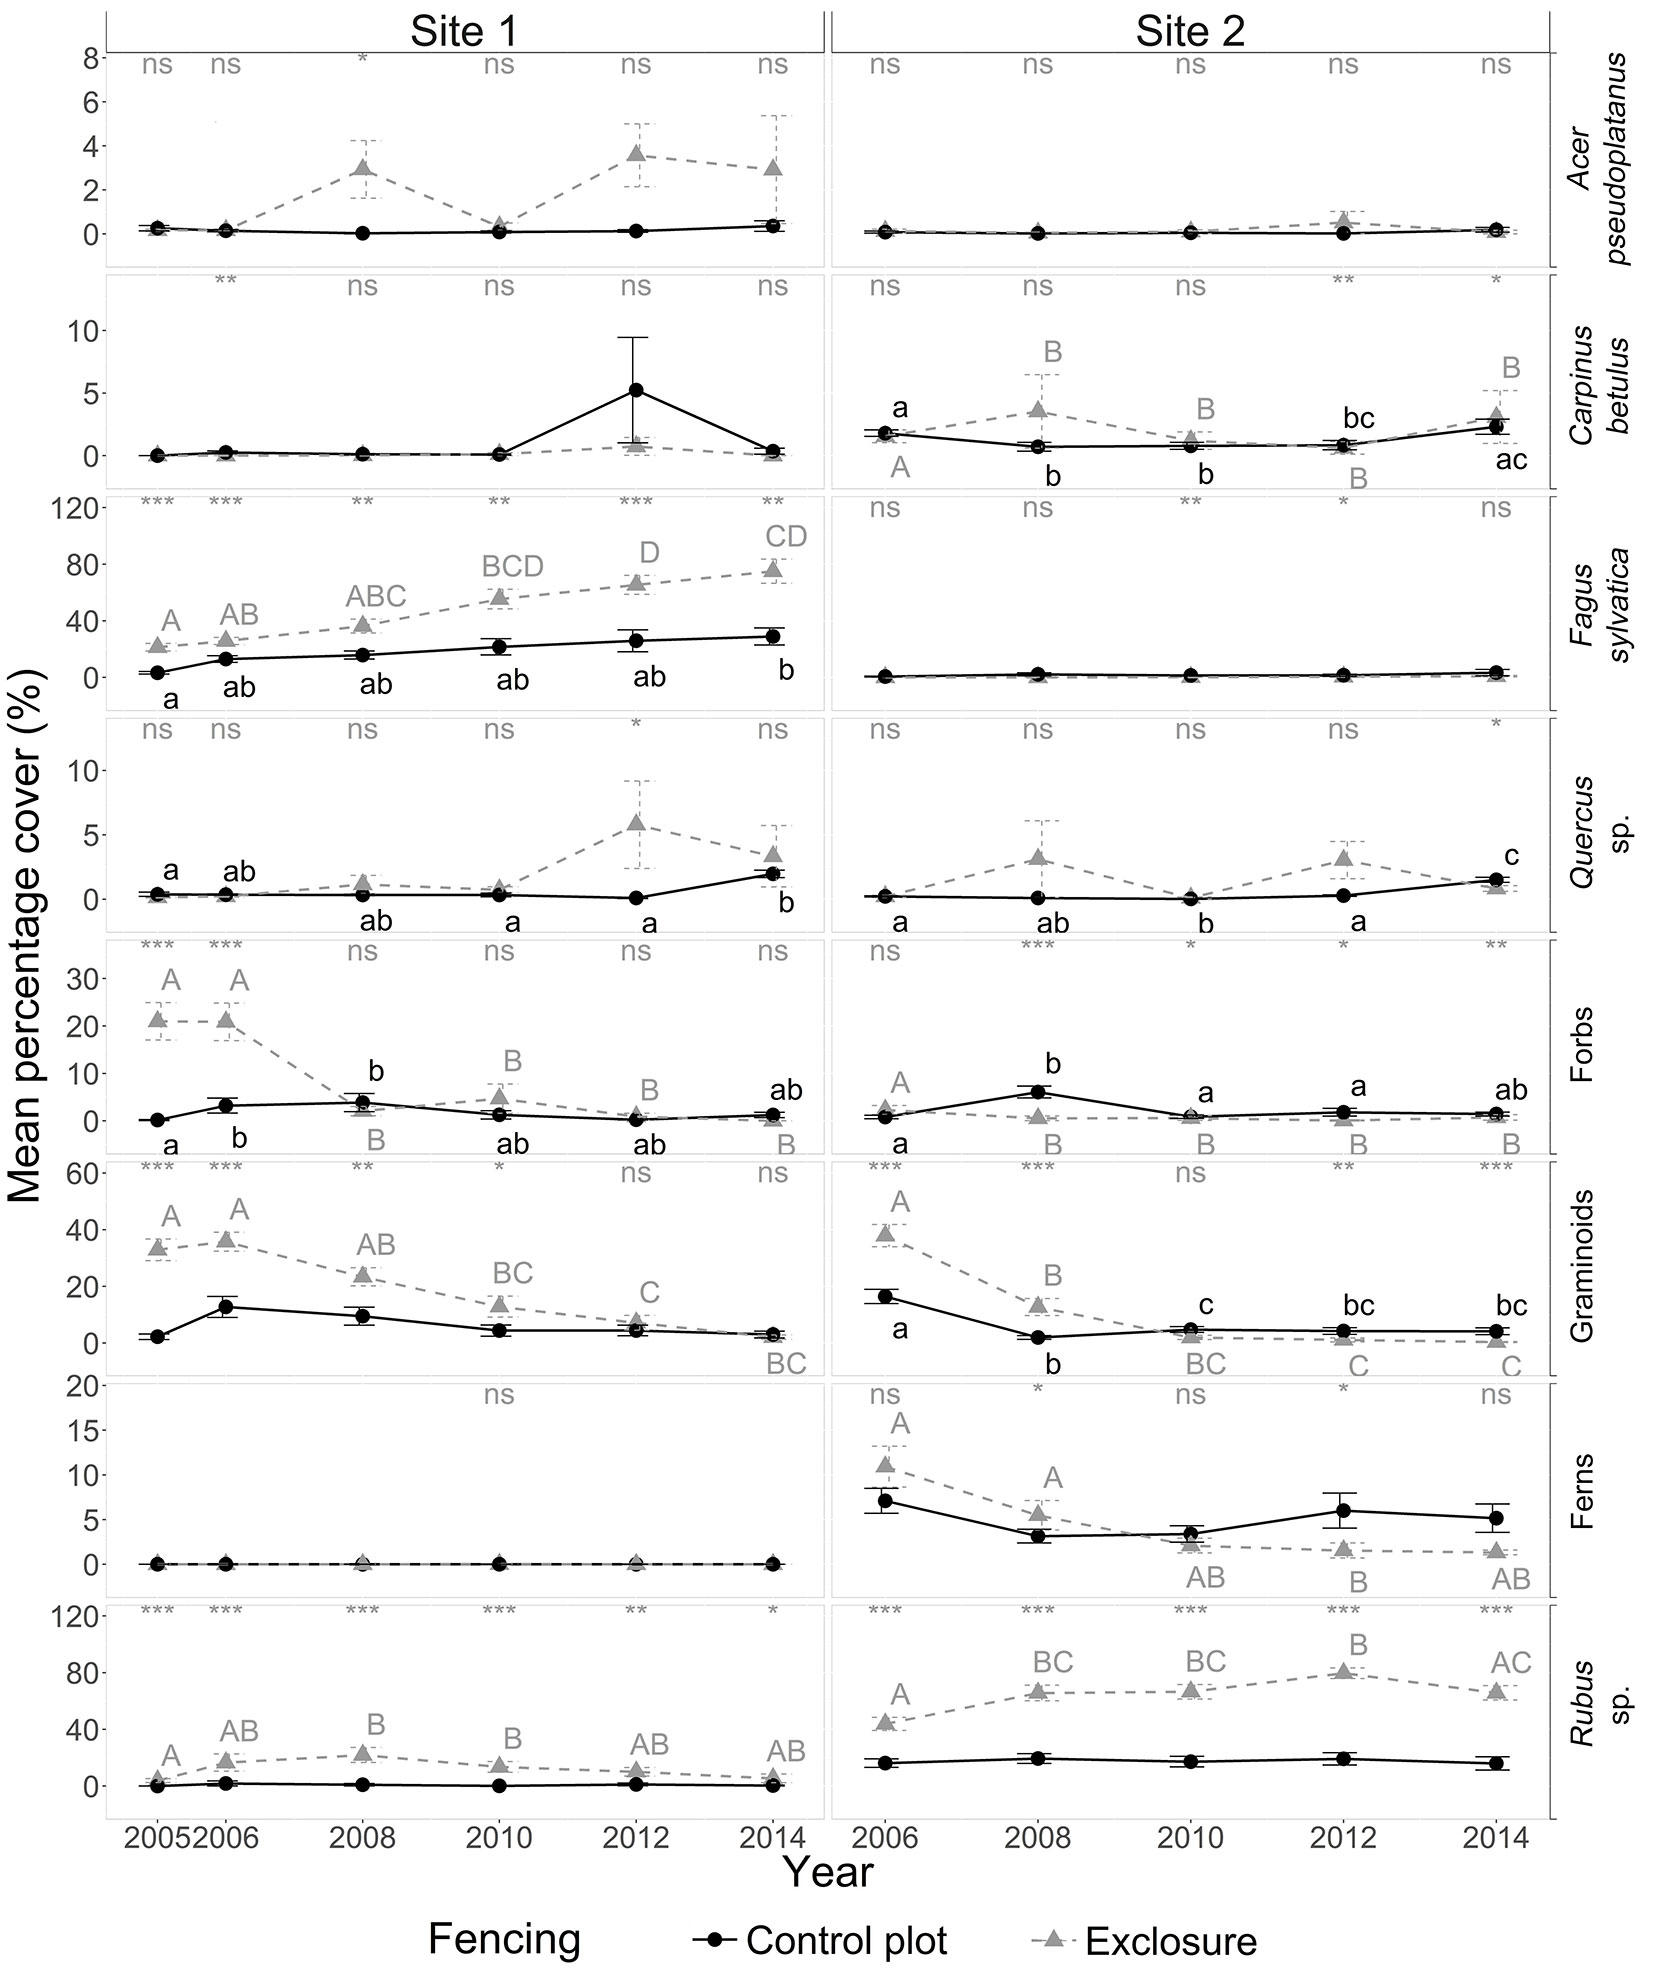
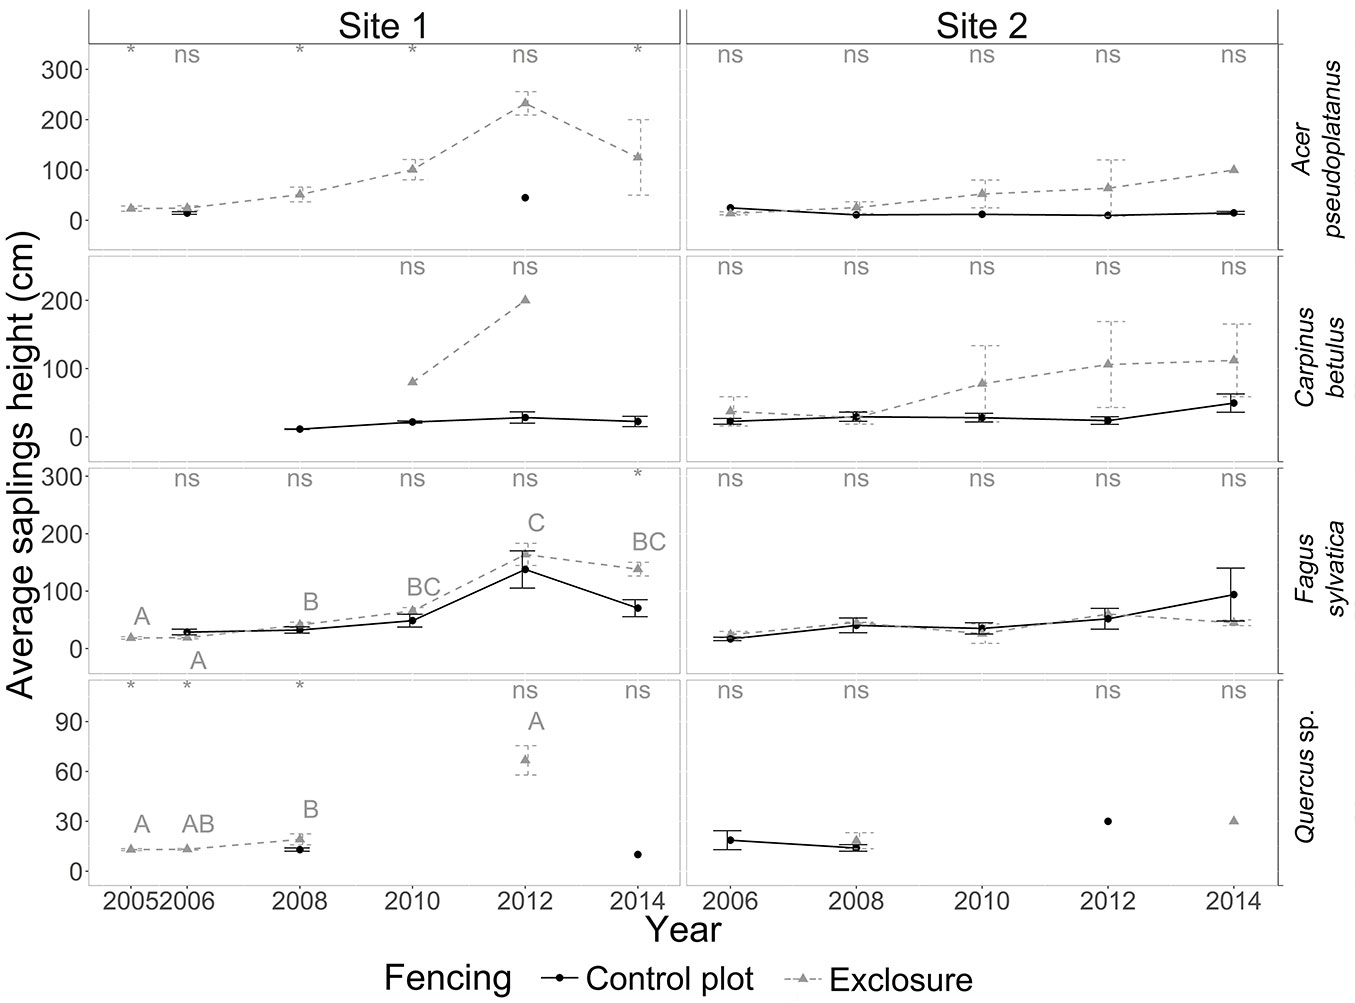
At site 1, tree recruitment was dominated by beech sapling dynamics; seedling and sapling densities of oak, sycamore maple and hornbeam (in decreasing order) were low - even negligible from a silvicultural point of view - in both control and exclosure plots (Fig. 4, Fig. 5). Average beech sapling density was consistently about 2.5 times lower in the control plot than in the exclosure, and remained stable over time (Fig. 5), with on average about 5.6 ± 0.2 beech saplings per square meter (Fig. 6). Beech sapling height increased from 29 ± 5 cm in 2006 to 138 ± 32 cm in 2012 in the control plot, and from 19 ± 2 cm in 2005 to 164 ± 19 cm in 2012 in the exclosure. In the exclosure, the herbaceous understory cover varied greatly over time for all three functional groups (forbs, graminoids and Rubus spp.) as opposed to the control plot where the herbaceous understory cover remained stable throughout the study period (Fig. 3). Graminoids showed a strong and rapid increase after fencing (35.8 ± 3.4% in 2006), but then progressively disappeared over time to reach 0% in 2014. Forbs dropped from 20% in 2005-2006, becoming completely absent by 2014 (Fig. 3). Bramble (Rubus spp.) showed the same general pattern, though the decrease was slightly delayed with maximum cover reached in 2008 (Fig. 3).
Fig. 4 - Yearly dynamics in seedling (<15 cm) density (number of seedlings per 4 m2) for the four target tree species in the presence of deer (control plot, dotted line) and in their absence (exclosure plot, solid line) for sites 1 and 2 from 2005 to 2014. Note the different scales on the y axes. For details on the legend, see Fig. 1.
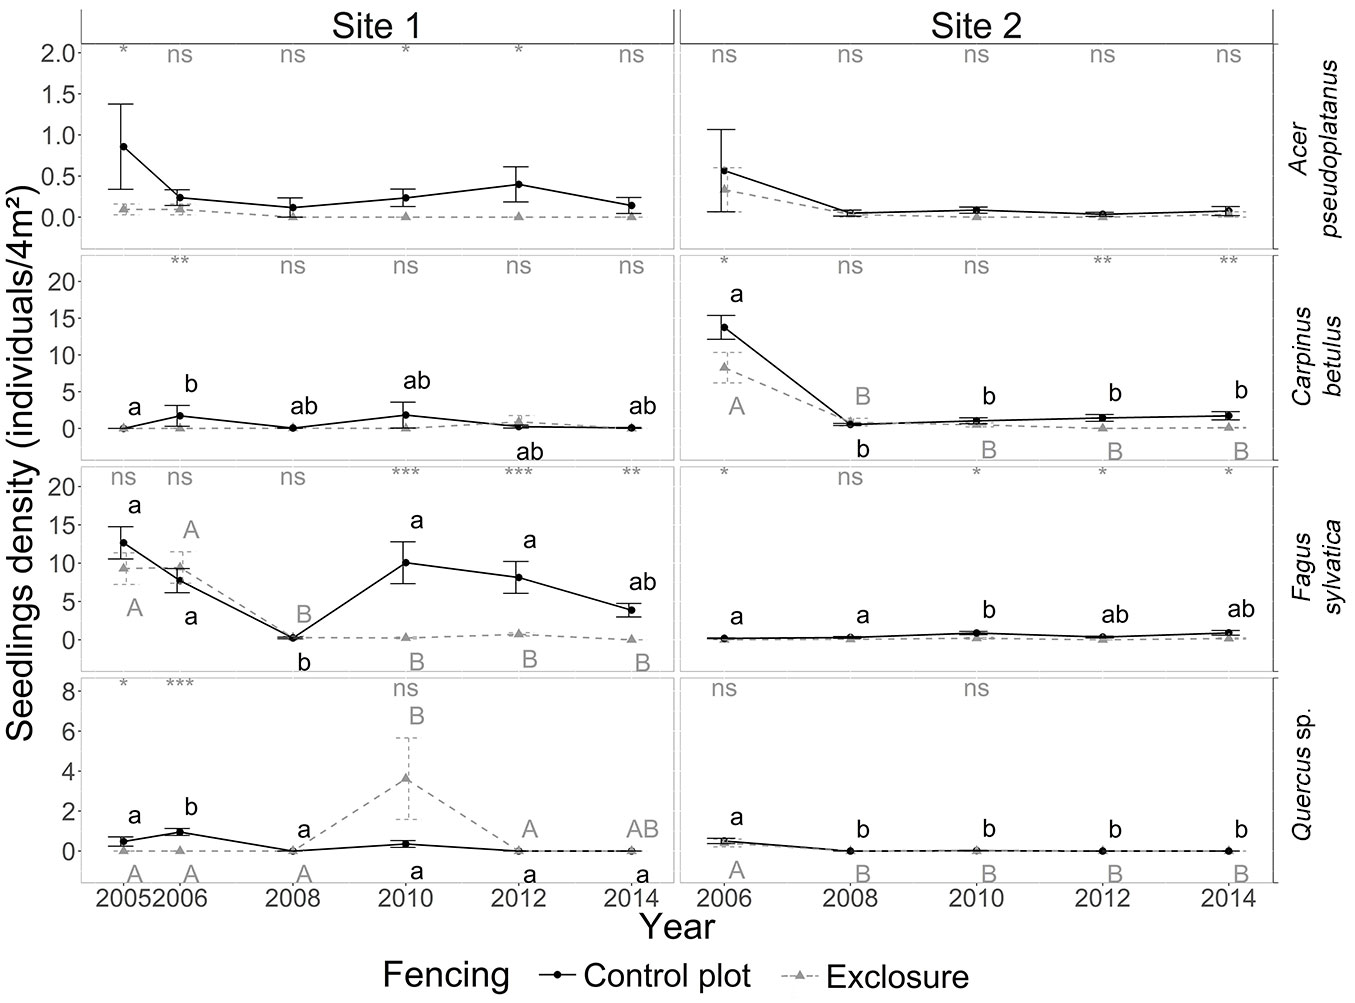
Fig. 5 - Yearly dynamics in sapling density (number of saplings per 4 m2) for the four target tree species in the presence of deer (control plot, dotted line) and in the absence of deer (exclosure plot, solid line) for sites 1 and 2 from 2005 to 2014. Note the different scales on the y-axes. For details on the legend, see Fig. 1.
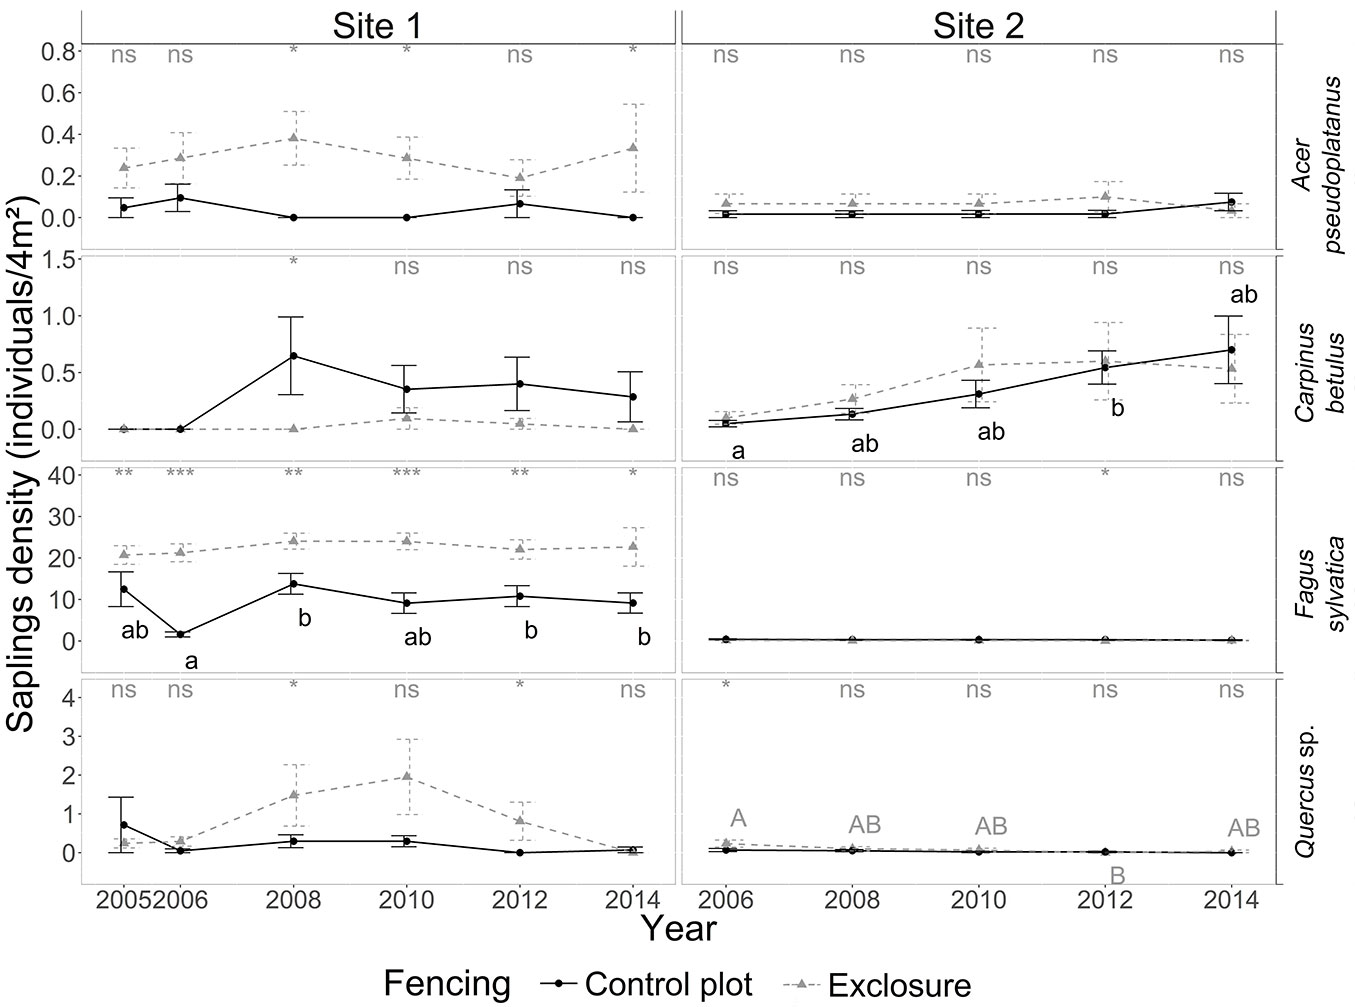
Fig. 6 - Yearly dynamics in the average height (cm) of saplings (15 cm < saplings > 3m) for the four target tree species in the presence of deer (control plot, dotted line) and in their absence (exclosure plot, solid line) for sites 1 and 2 from 2005 to 2014. Note the different scales on the y axes. For details on the legend, see Fig. 1.
Site 2: Rubus-dominated understory
The exclusion of deer at site 2 did not result in an increase in cover for any of the four target tree species (Fig. 3). At site 2, tree recruitment was low (even negligible from a silvicultural point of view) throughout the study period for all four target species. Beech and oak seedlings and saplings were virtually absent. Hornbeam (and to a lesser extent sycamore maple) seedlings and saplings were present in significant numbers during the first field campaign in 2006, but in spite of this, their densities had already dropped to near-zero values by the following field campaign in 2008. Densities for these two species then remained low throughout the remainder of the study period (Fig. 4). Sapling height did not significantly differ between control and exclosure plots for any of the target tree species, although sycamore maple and hornbeam saplings tended to be taller in the exclosure than in the control plot (Fig. 6).
At site 2, bramble was the most frequent and abundant type of vegetation in the understory; it occurred in almost all the exclosure subplots at a mean cover of about 64.3 ± 2.3% overall. After fencing, bramble cover increased consistently from 43.8 ± 4.7 % in 2005 to 65.8 ± 5.1% in 2014 in the exclosure plot (Fig. 3), while bramble cover remained stable (at about 18 %) throughout the study period in the control plot. Two plant species disappeared in the exclosure plot over time: raspberry decreased from about 18.3 ± 3.9 % cover in 2006 to 0.1 ± 0.1% in 2014; and Carex remota from about 17.4 ± 3.0 % in 2006 to 0.2 ± 0.1 % in 2014. Forb cover was consistently low in the exclosure and in the control plot (Fig. 3), while the abundant cover of graminoids and ferns dropped dramatically during the first two to six years, and switched from being more abundant to less abundant in the exclosure plot compared to the control plot.
Discussion
We observed that fencing consistently favored beech at site 1. These results are consistent with other studies on the effect of protection from browsing on tree recruitment: browsing reduced the sapling height of beech ([30]) and other species both under a mature canopy ([36]) and in clearcuts ([5]). Leonardsson et al. ([25]) showed that, after ten growing seasons, exclosures favored oak regeneration by reducing ungulate browsing: some oak saplings reached a height of more than 130 cm in exclosures, but never in the presence of deer. However, in our case, fencing was not sufficient to assure the regeneration of tree species other than beech. It is therefore likely that excluding deer in our study favored the pre-existing beech seedlings (advanced regeneration).
We observed that fencing favored the rapid regrowth of bramble at site 2, where it became hyper-dominant in the exclosure plot within two years of fencing. The role of deer in controlling bramble and ground cover growth is consistent with the results by Kirby ([23]); excluding deer can bring about explosive growth in bramble thickets ([24]). Balandier and colleagues (2013) have shown that bramble is more adapted to shady environments and to disturbance (tolerant/resistant to browsing) than was first thought.
Concomitantly with the increase in beech and bramble cover, many herbaceous species disappeared and the cover of forbs, graminoids and ferns declined at both sites. Graminoids and ferns, therefore, benefitted from browsing pressure, a result which has also been found in other studies ([34], [20]). Likewise, the competitive ability of beech saplings was detrimental to plant community richness and diversity at site 1 in agreement with the results of other studies ([7]).
Moreover, bramble is known to be a strong competitor for resource acquisition ([14], [2], [3]). In agreement with Fotelli et al. ([15]), Dodet et al. ([10]) and Wasem & Häne ([38]), we showed that under high bramble cover, the establishment, growth and survival of tree seedlings and saplings were weak. This is also consistent with a study performed by Harmer & Morgan ([19]) on advanced oak. However, this contradicts the findings reported by Marquis ([27]), who underlined that species like bramble, which reduce strongly competitive species like graminoids, ferns and forbs, can indirectly improve tree regeneration by reducing competition for resources. However, as shown by Bellingham et al. ([4]), at lower deer densities, results should be more contrasted. Maintaining deer populations at relatively low levels should favor both community diversity and sapling growth.
Although diversity indices were calculated at the alpha-level and not at the gamma-level, we remain cautious about our results as they were possibly influenced by the differing number of subplots. Indeed, at site 1 the number of subplots was similar between the control and exclosure plots (n=21), but differed at site 2 (n=60 and 30 for the control and exclosure plot, respectively). Moreover, the number of subplots varied over time. This could account for some of the observed changes given that we did not account for this bias in the analyses other than by using a fixed subplot size and calculating the indices at the subplot level (alpha). Despite these caveats, our results are likely to be relatively robust since no clear spatial pattern was found using semi-variograms. We should also bear in mind that exclosure experiments inform about the recovery of a plant community after release from browsing and do not provide information about the community that would have occurred without the presence of deer ([26]). Moreover, even though eight years may be considered rather short for a forest study, this time span should be long enough to observe the first responses of the forest understory to deer browsing pressure and is similar to time spans in other exclosure studies on oak ([25]).
Furthermore, caution should be taken when interpreting our results as differences in stand and site characteristics were considerable. The lower basal area at the beginning of our experiment in the exclosure plot for site 2 (p <0.05) could lead to a misinterpretation of our results. The higher shrub and herbaceous plant cover in the exclosure compared to the control could have been due to differences in light availability. However, we assumed that light availability at ground level was similar in the control and exclosure plots as Ellenberg’s ecological indicator values (weighted by the relative cover) for light (modified by [22]) showed no differences at the beginning of the experiment (see Fig. S2 in Supplementary material). Furthermore, differences were observed between control and exclosure plots after the first year of the experiment (cover percentage, number of saplings, etc.). This could have resulted from unobserved differences in the plots at the set-up of the experiment or from a rapid response of very dynamic species such as bramble to thinning events before our first measurements.
Thanks to these two concomitant eight-year experiments, we showed that fencing could be a useful tool to improve beech regeneration and growth. However, in our case, fencing combined with initial thinning was not sufficient to assure the regeneration of the other target tree species after eight years of deer exclusion; hence we are not able to offer guidelines to the forest manager who wishes to direct wood production towards tree species other than beech (in particular oak). Furthermore, removing deer browsing by fencing was not enough to favor tree recruitment at site 2, where bramble was widely present before the exclosure, and whose subsequent explosion suppressed other herbaceous understory species. However, a pattern does seem to emerge from these two case studies: shade-tolerant, browsing-tolerant, opportunistic species with a “sit and wait” strategy appear to dominate the community in the exclosure (beech in site 1 and bramble in site 2). Future management practices should no longer consider understory competition and deer browsing as two independent problems, nor should fencing be seen as a universal tool to mitigate deer impact on tree recruitment. Forest managers should pay particular attention to the presence of strong plant competitors and adapt their management accordingly.
Acknowledgements
We especially thank Philippe Hum (ONF), Jean-Luc Hamann (ONCFS) and their students for field work. We thank François Klein (ONCFS) and Jean-Pierre Tremblay for their advice. We also thank Y. Dumas (Irstea) for his helpful assistance in 2016 data collection (soil). We thank Yoan Paillet for re-reading. L. Laurent was funded by a PhD grant from Irstea and the Conseil Régional de Centre-Val de Loire (grant number 00087494) and through funds provided by the ONCFS (grant number 2013 /16 / 6171).
References
Gscholar
Gscholar
Gscholar
Authors’ Info
Authors’ Affiliation
Anders Mårell
Philippe Balandier
Institut National de Recherche en Sciences et Technologies pour l’Environnement et l’Agriculture (Irstea), Research Unit on Forest Ecosystems (EFNO), F-45290 Nogent-Sur-Vernisson (France)
Office National des Forêts, 1, rue Person, BP 20132 67703 Saverne (France)
Office National de la Chasse et de la Faune Sauvage, Direction Recherche et de l’Expertise, Unité Ongulés Sauvages, “Montfort”, 01330 Birieux (France)
Corresponding author
Paper Info
Citation
Laurent L, Mårell A, Balandier P, Holveck H, Saïd S (2017). Understory vegetation dynamics and tree regeneration as affected by deer herbivory in temperate hardwood forests. iForest 10: 837-844. - doi: 10.3832/ifor2186-010
Academic Editor
Andrea Cutini
Paper history
Received: Aug 02, 2016
Accepted: Sep 05, 2017
First online: Oct 26, 2017
Publication Date: Oct 31, 2017
Publication Time: 1.70 months
Copyright Information
© SISEF - The Italian Society of Silviculture and Forest Ecology 2017
Open Access
This article is distributed under the terms of the Creative Commons Attribution-Non Commercial 4.0 International (https://creativecommons.org/licenses/by-nc/4.0/), which permits unrestricted use, distribution, and reproduction in any medium, provided you give appropriate credit to the original author(s) and the source, provide a link to the Creative Commons license, and indicate if changes were made.

Web Metrics
Breakdown by View Type
Article Usage
Total Article Views: 51874
(from publication date up to now)
Breakdown by View Type
HTML Page Views: 41360
Abstract Page Views: 4323
PDF Downloads: 4863
Citation/Reference Downloads: 23
XML Downloads: 1305
Web Metrics
Days since publication: 3162
Overall contacts: 51874
Avg. contacts per week: 114.84
Article Citations
Article citations are based on data periodically collected from the Clarivate Web of Science web site
(last update: Mar 2025)
Total number of cites (since 2017): 16
Average cites per year: 1.78
Publication Metrics
by Dimensions ©
Articles citing this article
List of the papers citing this article based on CrossRef Cited-by.
Related Contents
iForest Similar Articles
Research Articles
Large-scale spatial distribution of deer browsing damage to young tree plantations
vol. 14, pp. 34-40 (online: 14 January 2021)
Research Articles
The impact of seed predation and browsing on natural sessile oak regeneration under different light conditions in an over-aged coppice stand
vol. 9, pp. 569-576 (online: 04 April 2016)
Research Articles
Impact of management practices on habitat use by birds in exotic tree plantations in northeastern Argentina
vol. 19, pp. 38-44 (online: 06 February 2026)
Research Articles
Environmental factors affecting formation of lammas shoots in young stands of Norway spruce (Picea abies Karst.) in Latvia
vol. 11, pp. 809-815 (online: 14 December 2018)
Review Papers
Problems and solutions to cork oak (Quercus suber L.) regeneration: a review
vol. 16, pp. 10-22 (online: 09 January 2023)
Research Articles
Modelling natural regeneration of Oak in Saxony, Germany: identifying factors influencing the occurrence and density of regeneration
vol. 16, pp. 47-52 (online: 16 February 2023)
Research Articles
Effects of low-impact logging on understory birds in the Brazilian Amazon
vol. 14, pp. 122-126 (online: 08 March 2021)
Research Articles
Growth dynamics of the Norway spruce and silver fir understory in continuous cover forestry
vol. 13, pp. 56-64 (online: 05 February 2020)
Research Articles
Density and spatial distribution of beech (Fagus sylvatica L.) regeneration in Norway spruce (Picea abies (L.) Karsten) stands in the central part of the Czech Republic
vol. 9, pp. 666-672 (online: 12 March 2016)
Research Articles
A silvicultural stand density model to control understory in maritime pine stands
vol. 10, pp. 829-836 (online: 25 September 2017)
iForest Database Search
Search By Author
Search By Keyword
Google Scholar Search
Citing Articles
Search By Author
Search By Keywords
PubMed Search
Search By Author
Search By Keyword


