Canopy Chamber: a useful tool to monitor the CO2 exchange dynamics of shrubland
iForest - Biogeosciences and Forestry, Volume 10, Issue 3, Pages 597-604 (2017)
doi: https://doi.org/10.3832/ifor2209-010
Published: May 15, 2017 - Copyright © 2017 SISEF
Technical Reports
Abstract
A transient state canopy-chamber was developed to monitor CO2 exchange of shrubland ecosystems. The chamber covered 0.64 m2 and it was modular with a variable height. Several tests were carried out to check the potential errors in the flux estimates due to leakages and the environment modifications during the measurements inside the chamber. The laboratory leakages test showed an error below 1% of the flux; the temperature increases inside the chamber were below 1.3 °C at different light intensity and small pressure changes. The radial blowers inside the chamber created different wind speed at different chamber height, with faster speed at the top of the chamber and the minimum wind speed that was recorded at soil level, preventing detectable effects on soil CO2 emission rates. Moreover, the chamber was tested for two years in a semi-arid Mediterranean garrigue, identifying a strong seasonality of CO2 fluxes with the highest rates during spring and lowest rates recorded during the hot dry non-vegetative summer.
Keywords
Canopy Chamber, CO2 fluxes, Cistus monspeliensis, Shrubland, Semiarid Ecosystems, Mediterranean Garrigue
Introduction
In recent years, the quantification of ecosystem CO2 fluxes has received increased attention by the scientific community, both at broader scale as well as at the plant-environment scale. In large areas with homogeneous topography and soil cover, micro-meteorological techniques, such as eddy covariance ([4]), can measure ecosystem CO2 fluxes without altering canopy environment ([13]). On the other hand, for heterogeneous multi-specific community like eco-tonal and transitional areas, plot size experiments, or forest understory vegetation the canopy chamber technique can be a suitable alternative that provides reliable data ([40], [39], [7]).
Canopy chamber systems can be differentiated into “steady state” (open systems) and “non-steady state” (closed systems), according to the recirculation of the air inside the chamber ([26]). In the “steady state” type, an external airflow passes through the chamber and the fluxes are calculated on the base of the differential CO2 concentration of the incoming and outgoing air. In the “non-steady state” type, the fluxes are calculated on the basis of the CO2 concentration changes in the air passing inside the chamber in a closed loop. In both systems, the measurement of CO2 is repeated during short time intervals (seconds).
Enclosing a portion of an ecosystem inside a chamber produces several artifacts, caused by the chamber characteristics and deployment (chamber effect). The chamber walls affect light environment, air temperature and humidity, as well the CO2 concentration inside the chamber. Although transparent materials are used, chamber walls absorb, reflect and therefore reduce the photosynthetically active radiation (PAR, 400-700 nm) reaching the ecosystem ([40]), decreasing the photosynthetic rates of the plant community. The greenhouse effect produced by the walls and the consequent increase in air temperature and relative humidity ([24]) can change both photosynthetic and respiratory processes ([6], [2]). The modified aerodynamic conditions due to fan functioning ([4]) and the pressure variation occurring inside the chamber ([12]) can alter the soil CO2 efflux, producing an error in the estimation of the different components of the ecosystem CO2 fluxes (respiration and photosynthesis). Fans generally increase the CO2 fluxes from the soil by disturbing the boundary layer above soil surface ([17], [35]), while over-pressurization generate a mass transfer into the soil inhibiting the CO2 efflux ([40], [43]). Additionally, the changes in CO2 and H2O concentration inside the chamber affect the natural gradient in the soil-atmosphere interface, thus the rates of processes such as photosynthesis, respiration or transpiration are biased from undisturbed rates ([28], [32]).
The choice of adequate wall material ([30]) and the use of non-steady state operating for short periods ([40]), can limit the chamber effects due to walls, although longer periods of measurements seems to increase the confidence of the measurements ([33]). Furthermore, the application of a venting tube on the chamber wall can help to balance the pressure between the inside and outside of the chamber ([38]). On the other hand, other systems based on air and microclimate conditioning have been tested to reduce the chamber effects, but these systems lack portability ([29], [30]).
In the literature, a variety of chambers can be found with different configurations designed to respond to specific requirements such as: different ecosystem types and environments (e.g., croplands, grasslands, orchards, forest understories - [40], [18], [32]), needs to modify the microclimatic conditions inside the chamber ([29]), and the accessibility of measurement areas ([30]).
In the context of a long-term climatic manipulation experiment on European shrubland ([5]), the objectives of this work were: (i) to develop a portable canopy chamber system designed to measure the CO2 fluxes in shrubland ecosystems in remote areas; (ii) to assess the microclimatic modifications produced by the chamber system; and (iii) to test the suitability of the system to quantify the seasonal variation of photosynthetic and respiratory CO2 fluxes in a Mediterranean, transitional ecosystem (garrigue).
Material and methods
Chamber design
The originally developed chamber was vertically modular and made of a minimum of 3 parts: a soil collar, a base and a lid (see Fig. S1 in Supplementary material). The chamber covers an area of 0.64 m2 (0.8 × 0.8 m), and by piling up two or more bases, the height can vary from 0.6 to 1.3 m, depending on the plant height. To avoid leakages, all the junction parts are sealed by foam gaskets (RS 567-963, RS components).
The soil collar guarantees the insertion of the chamber to the ground in order to avoid leakeages of gases from the bottom. It is made of a stainless steel frame that can be fixed to the base, and it is equipped of a blade that enters 5 cm into the ground. Along the blade, every 5 cm, there are 5 mm-diameter holes that allow the roots colonization, and partially compensate for the disturbance occurring during soil collar installation. The base consists of an open top and open bottom parallelepiped with 4 transparent 2 mm-thick Lexan® polycarbonate (GE plastic, Pittsfield, MS, USA) walls, held together by an aluminium frame. H2O and CO2 showed a low permeation through Lexan®, which has often been used in recently developed gas exchange chambers for its transparency and low permeability ([3]). In the lower part of the base two battery-operated radial fan blowers were fixed; the rotational speed of the blowers can be regulated using an external level potentiometer.
The lid is a bottom open parallelepiped made of five transparent walls made of the same materials as the base. Sensors of air temperature, air relative humidity (HydroClip S3 probe; Rotronic, Basserdorf, Switzerland) and photosynthetic photon flux density (PPFD; Apogee quantum sensor - Apogee Instruments Inc., Logan, UT, USA), together with a high-resolution differential pressure transducer sensor (TEPR 070, Tecno El, Rome, Italy) were mounted on the interior of the lid to monitor the chamber environment during measurements. Additionally, a curled venting tube (6 mm diameter, 70 cm length), passing through one of the wall of the lid, was inserted to equilibrate the pressure between the inside and the outside of the chamber.
The measurements of CO2 and H2O concentrations were made by an infrared gas analyzer LI-8100 (LI-COR, Lincoln, NE, USA), connected to the chamber by two polytetrafluoroethylene (PTFE) tubes (2 m in length), while the data originated from the lid sensors were recorded by the Auxiliary Sensor Interface (LI-COR, Lincoln, NE, USA). According to the purpose of this study, only the CO2 fluxes were calculated as the temporal changes of the concentration in the air passing in a closed loop in the canopy chamber and in the analyzer. The flux computation can change depending on the regression type used to fit the data (typically linear or exponential fitting are used). An underestimation of the fluxes is often reported if the linear regression is used ([22]), although this error is dependent on chamber volume to area ratio (chamber height), and experimental tests reported that it becomes negligible for a chamber height higher than 80 cm ([27]).
In the present study, we used the LI-COR 8100 File Viewer 3.1.0 flux computation. The software performs at the same time both linear and exponential regression, providing the normalized sum of square residuals of fits. Because the linear fit performed better with our measurements, the fluxes presented here were calculated using the slope of the linear regression that fit the variation of CO2 concentrations inside the chamber during measurement interval after the closure of the chamber.
The time duration of the measurement was chosen after preliminary tests, accounting for a duration that would simultaneously allow an adequate CO2 concentration change as well as the linearity in gas concentration change during the time. We established that 90 seconds was the optimal duration time for the chamber presented here. This duration was similar to the 100 seconds used in another large chamber closed system ([32]).
Chamber tests
Several tests were conducted in laboratory condition and outdoor, to evaluate the errors of our chamber system on flux measurements.
Chamber leakages test. This test was carried out in the laboratory to estimate the error produced on flux calculation caused by the leakages. The empty chamber was installed over an inert surface and pure CO2 was injected inside the chamber to reach the concentration of 1000 ppm, maximizing the gradient between CO2 concentration outside and inside the chamber, thus the leakages. The CO2 concentration inside the chamber was monitored over time by the LI-8100 analyzer.
The flux error associated to the leaks was calculated by the following equations reported by Pérez-Priego et al. ([32]) for a large canopy chamber (eqn. 1):
where (eqn. 2):
In those equations α represents the leak coefficient of the chamber (m3 s-1), Ci1 and Ci2 represent the CO2 concentration (ppm) inside the chamber at time 1 and 2, Ca is the CO2 concentration outside the chamber measured discontinuously with the LI-8100 analyzer (ppm), V is the volume of the chamber (m3), ∂t is the time (s) and Fc is the net exchange of the ecosystem (µmol CO2 m-2 s-1). When in the chamber there is nothing generating a CO2 flux, Fc is zero, and α depends only on time and on the concentration gradient between the outside and the inside of the chamber. The flux error ε (%) associated to the leaks was estimated according to the eqn. 3:
Temperature and relative humidity (RH) tests. These tests were based on concurrent measurements of temperature outside and inside the chamber (temperature test) and the measurement of RH increase inside the chamber (RH test) for the 282 field measurements (90 seconds length) carried out at different meteorological conditions. The soil and air temperatures were ranging from about 11 to 30 °C and about 20 and 34 °C, respectively; PPFD from about 600 to 1600 µmol photons m-2 s-1 and relative soil water content from about 6 to 55%.
Pressure test. The high-resolution pressure transducer installed on the chamber lid was used to monitor the difference of pressure (ΔP) between outside and inside the chamber (Pi-Pa where Pi is the pressure inside the chamber and Pa is the ambient pressure; the positive sign represents an overpressure in the chamber). The check of ΔP and its analysis was a standard procedure for all the 282 field chamber measurements.
Radiation test. To test the attenuation of solar radiation due to the chamber wall absorbance and reflectance, we monitored the solar radiation inside and outside the chamber in 6 moments along a sunny day in clear sky conditions (2011-06-28), integrating different sun angle. The irradiation measurements were done by a portable spectroradiometer (Field Spec Pro FR, Analytical Spectral Devices, Boulder, CO, USA). The instrument measured the irradiance in the wavelength range 350-2500 nm with a resolution of 1 nm.
Blowers test. To test the effect of rotational speeds on air circulation inside the chamber, we positioned the chamber on a bare sandy soil, where both wind speed inside the chamber (thermo-anemometer 2103-1 Delta-OHM, Italy) and soil CO2 efflux rate were measured. The wind speed measurements were carried out at 6 different heights above the ground from 2 to 52 cm. In addition, wind speed measurements at 22 cm height were also performed at five different zenith angles (0°, 45°, 90°, 135°, 180°). All measurement were carried out at each level of blower speed potentiometer (6, 8, 10 and 12 Volts). Simultaneously, we tested how the blowers speed affected the rate of CO2 efflux from bare soil. The results obtained for each level of blower speed (soil CO2 efflux and wind speed) were tested by ANOVA and Fisher’s post-hoc tests.
Chamber comparison. Our Canopy Chamber was compared with the commercial Soil Survey Chamber 8100-103 (LI-COR, Lincon, Nebraska, NE, USA). The comparison was made in the field on a bare sandy soil. Within the area defined for the canopy chamber measurement (0.64 m2), five PVC collars (ø 0.2 m, covering about 25% of the area) were inserted at 0.05 m depth for the measurements with the Soil Survey Chamber 8100-103. The comparison was performed by measuring in a short time lag the soil CO2 efflux on the PVC collars by the Survey Chamber 8100-103 followed by measurement by the Canopy Chamber. In order to avoid any photosynthetic activity, an aluminum cloth darkened the canopy chamber during the measurements. The 5 measurements obtained by the Soil Survey Chamber 8100-103 were averaged for the comparison with the value measured using the chamber developed in this study. The comparison was carried out measuring the fluxes in 8 campaigns carried out in different seasons and environmental condition: soil and air temperature were ranging from about 11 to 30 °C and 20 and 34 °C, respectively; while relative soil water content was ranging from about 6 to 55%.
NEE, TER measurements and GP estimation in a Mediterranean garrigue
The net ecosystem exchange (NEE) and total ecosystem respiration (TER) fluxes were calculated according to the following equation ([25] - eqn. 4):
where P0 is the initial pressure (kPa), W0 is the initial concentration of water vapor (mmol mol-1), S is the surface covered by the chamber (cm2), R is the universal gas constant (8.314 Pa m3 K-1 mol-1), T0 is the initial temperature (°C) and ∂C′/∂t is the change of CO2 concentration during the measuring interval (μmol mol-1 s-1).
The net ecosystem exchange was measured by positioning the base over the metallic soil collar, then the radial blowers were switched on, and finally the lid was positioned over the base. After the NEE measurement, the lid was pulled up to vent the chamber; then, after 2 minutes it was repositioned over the base and the entire chamber was darkened by an aluminum cloth to measure the TER. The gross photosynthesis of the ecosystem (GP) was calculated by subtracting TER from NEE.
In order to test the canopy chamber under variable field conditions, we measured the NEE, TER, GP and the environmental parameters sixteen times throughout the years 2010 and 2011 on a Mediterranean shrubland, located in the northeast of Sardinia (Italy - 40° 37′ N, 8° 10′ E). The soil is rocky and shallow and is covered mostly by a malacophyllous drought semi-deciduous species: Cistus monspeliensis L. The height of the plants is lower than 1 m. The climate is Mediterranean with a mean annual temperature of 16.8 °C and a mean annual rainfall of 640 mm. Further information on the site characteristics are reported in De Dato et al. ([11], [9]). Six chamber soil collars, delimiting six areas including at least one Cistus plant, were installed about 2 months prior to the start the measurements, in order to allow root re-colonization after the disturbance. To monitor soil water content and soil temperature two sensors (5TM - Decagon Devices, Pullman, WA, USA) were inserted inside each collar at 5 cm depth. The sensors measurements were recorded by an external data-logger (Em50 - Decagon Devices, Pullman, WA, USA).
Result and discussion
Chamber system tests
Chamber leakages
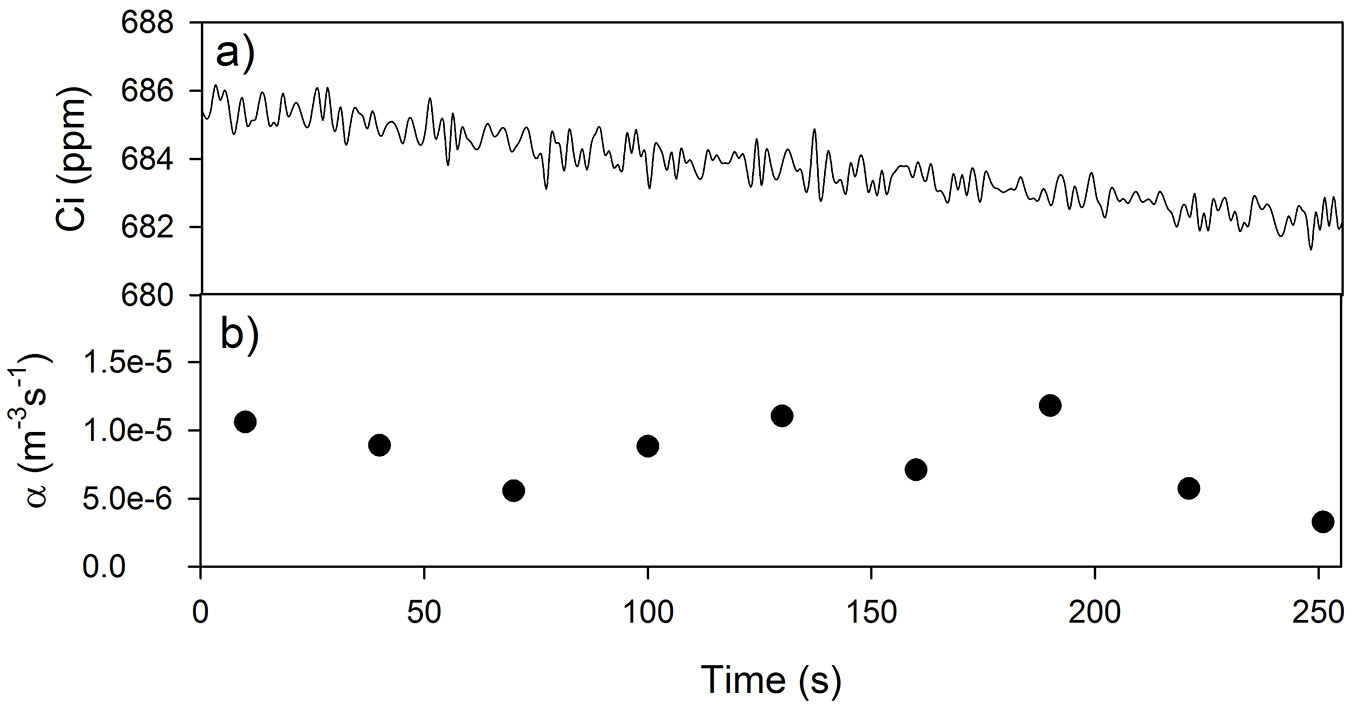
The CO2 concentration of the empty chamber decreased regularly during the time of the test (in Fig. 1a is showed a part of the test). On average, the leak coefficient α (Fig. 1b) obtained solving the eqn. 2 was about 8·10-6 m3 s-1, while the average flux error ε estimated over the standard time of the measurements (90 s) was less than 1% per minute. The ε value estimated in this study was constantly in the range of 0.8-1% per minute, similar to the values reported for chamber of comparable volumes by Steduto et al. ([40]) and Pérez-Priego et al. ([32]), while larger errors are reported for the chamber developed by Held et al. ([19]) and Grau ([16]).
Fig. 1 - (a) Time evolution of CO2 concentration inside the chamber; (b) leak coefficients α (black circles) estimated on a 30 seconds base. The measurement was carried out in laboratory condition.
Temperature and relative humidity tests
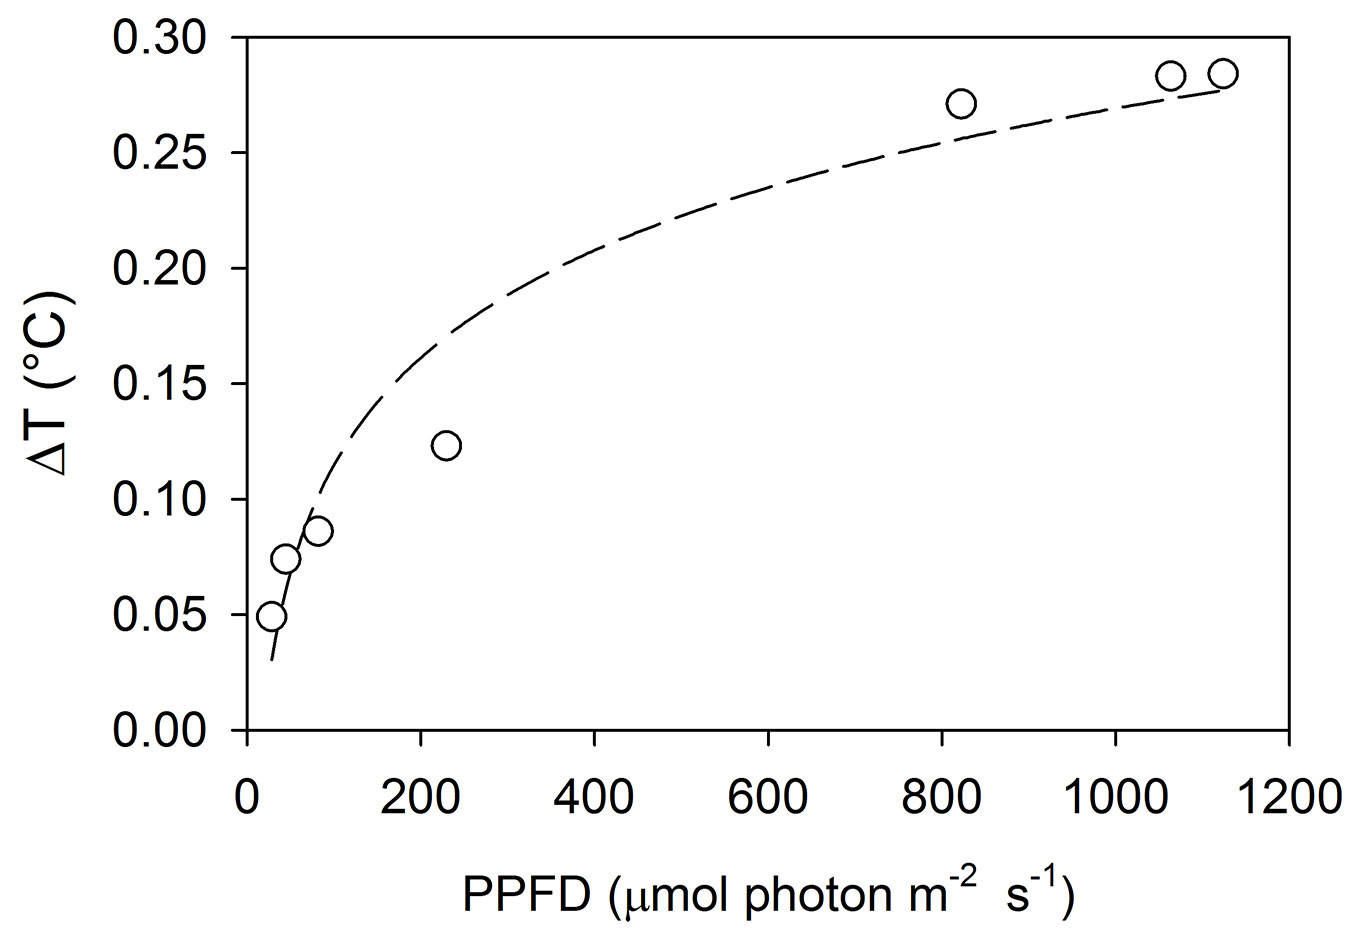
The chamber walls altered the energy balance between the chamber and the outside environment, producing a slight increase of temperature inside the chamber (Tab. 1). The temperature increases (ΔT) were a function of PAR level (Fig. 2) and in the measurement interval (90 s), they were always below 1.3 °C (Tab. 1). The recorded ΔT was similar to the one reported from a larger canopy chamber ([3], [32]) and considerably lower than the 2-4 °C found in many other closed chambers ([16], [37], [40]). The lower values measured in our chamber may be explained by both the short duration of measurements and the lower infrared reflectance properties of the Lexan material constituting the chamber walls. Moreover, we noticed that the aluminum cloth (used for the respiration measurement) slightly reduced the temperature increase (0.2 °C, overall average). Relative humidity (RH) increase during the measurements ranged between 4 and 20 % with an average value of 13% (Tab. 2). No condensation inside the chamber was observed, in any of the sampling campaigns. Although limited, the observed increase may affects the evaporation processes (out of the scope of our measurements), but considering the short time of the measurements and a certain delay in the stomata responses ([46]), no major effect on the CO2 exchanges could be assumed.
Tab. 1 - Average initial measurement temperature (Initial T Air) and relative humidity (Initial RH) values and temperature increase (ΔT Air) and relative humidity increase (ΔRH) values for each field measurement campaign (totally 282 measurements).
| Date | Initial T Air (°C) |
ΔT Air (°C) |
Initial RH (%) |
ΔRH (%) |
|---|---|---|---|---|
| 2010-Feb-26 | 22.38 | 0.34 | 62.31 | 15.42 |
| 2010-Mar-16 | 22.19 | 0.67 | 54.16 | 19.70 |
| 2010-Apr-28 | 29.46 | 0.60 | 60.26 | 18.74 |
| 2010-Jun-07 | 32.45 | 0.77 | 47.33 | 17.53 |
| 2010-Jul-02 | 33.55 | 1.27 | 65.95 | 15.38 |
| 2010-Jul-28 | 34.56 | 0.62 | 47.63 | 6.39 |
| 2010-Sept-10 | 32.02 | 0.46 | 46.02 | 4.93 |
| 2010-Oct-10 | 34.07 | 0.31 | 35.26 | 9.10 |
| 2010-Nov-06 | 26.85 | 0.43 | 57.15 | 15.09 |
| 2011-Feb-12 | 20.50 | 0.32 | 58.50 | 15.20 |
| 2011-Mar-24 | 27.70 | 0.72 | 62.10 | 12.19 |
| 2011-May-05 | 30.68 | 0.38 | 44.09 | 17.56 |
| 2011-Jun-15 | 29.61 | 0.82 | 63.73 | 15.42 |
| 2011-Jul-15 | 34.78 | 0.48 | 39.34 | 6.41 |
| 2011-Oct-19 | 28.81 | 0.68 | 41.53 | 4.36 |
| 2011-Nov-13 | 22.79 | 0.90 | 53.11 | 13.97 |
Fig. 2 - Relationship between the increase in air temperature inside the chamber (ΔT) and incident light (PPFD) measured at the end of 90 seconds period. The line is the logarithmic equation fitting the data.
Tab. 2 - Imposed blowers voltage (V), soil CO2 efflux (μmol CO2 m-2 s-1) and coefficient of variation (CV %) of the flux computation. Values are means (± standard error) of 5 different measurements carried out on a bare sandy soil. For each column different letters indicate significant differences (p<0.05) after one-way ANOVA and Fisher’s post-hoc test.
| Blowers voltage (V) |
Soil CO2 efflux (μmol CO2 m-2 s-1) |
Coefficient of variation (%) |
|---|---|---|
| 0 | 4.07 ± 0.57 a | 3.17 ± 0.52 b |
| 6 | 4.49 ± 0.77 a | 1.63 ± 0.33 a |
| 8 | 4.06 ± 0.83 a | 1.39 ± 0.11 a |
| 12 | 4.10 ± 0.79 a | 1.38 ± 0.08 a |
Pressure test
Considering all the 282 measurements, the maximum ΔP was on average +4 ± 0.4 Pa (positive sign means overpressure in the chamber). Generally, spikes of 4-5 Pa occur only occasionally during a measurement and were not influenced by temperature increase and H2O concentration inside the chamber (an example of ΔP variation during a typical measurement is reported in Fig. S2 - Supplementary material). Steduto et al. ([40]) explained these short time variations by the functioning of the air pump located inside the analyser, while Takle et al. ([43]) showed that also wind could induce pressure fluctuation. In our case, due to the coastal location of the experimental site, wind could play a major role on chamber pressure fluctuations. Positive or negative pressure perturbations could be dependent on wind intensity and direction as previously demonstrated ([21]).
Considering all the 90 seconds of the measurement, ΔP showed a net variation of +0.2 Pa. Although the effect of pressure is connected to the degree of soil permeability ([42]), these levels of over pressurization should not inhibit the natural soil CO2 efflux ([28]) and thus we can exclude sensible errors on the ecosystem respiration measurements.
Radiation test
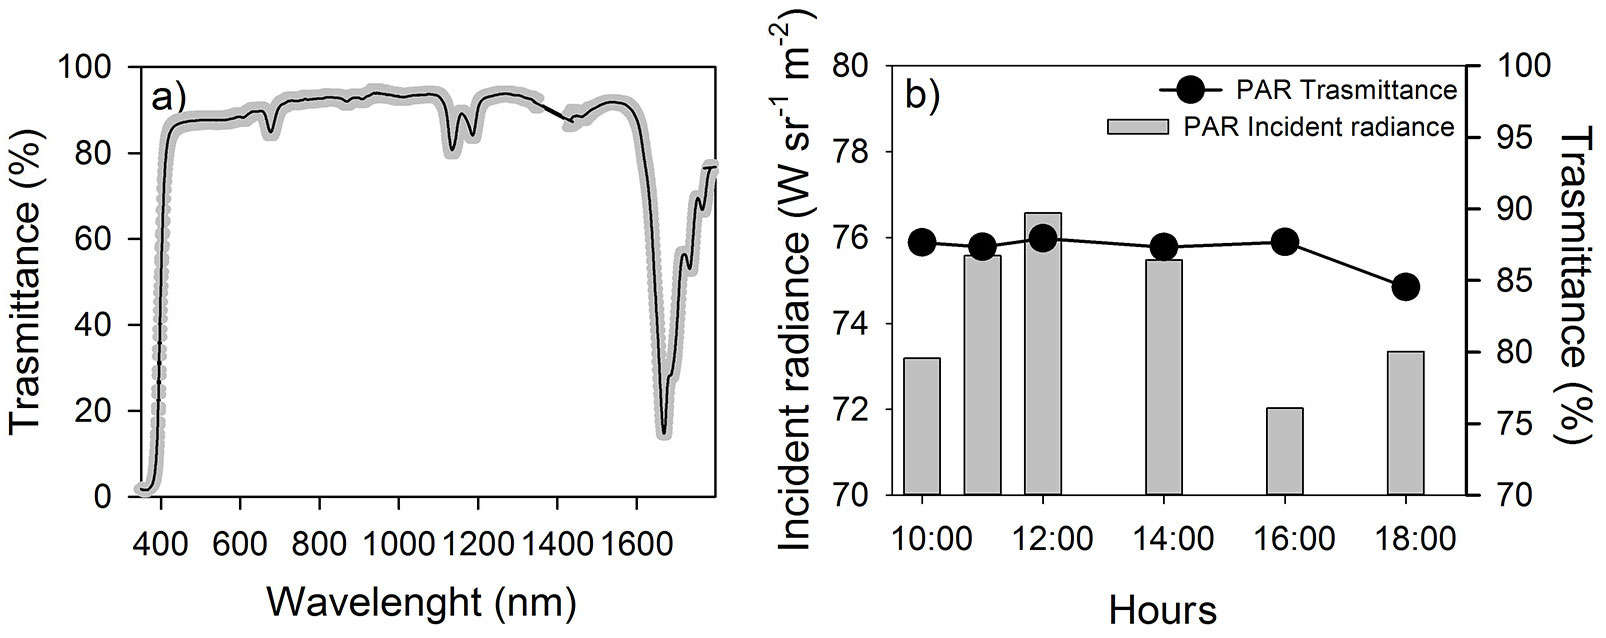
The reduction of the radiation available for the ecosystem is unavoidable, and the degree of this reduction depends on chamber wall material properties and on the shade of the holding frame as well as on the solar angle. As reported in Fig. 3a, the Lexan transmittance of the radiation was close to 0 in the UV region (< 400 nm), while reached about the 90% in the photosynthetic active region (PAR, 400-700 nm). Moreover, the transmittance in this region was affected neither by the different levels of radiation nor by the different radiation angle (changing with the hours of the measurement - Fig. 3b). Out of the PAR, the transmittance became lower, reaching values of about 20% in the SWIR region (short wave infrared, about 1600 nm) that did not influence the photosynthetic activity in the short term (Fig. 3a). These values of transmittance are similar ([34]) or higher than the transmittance reported for others chambers ([19], [40], [3]).
Fig. 3 - (a) Solid black line and gray band represent the averaged solar radiation transmitted by chamber walls and standard deviation (n=6), respectively. The wavelength transmittance was averaged based on six measurements carried out at different times in 2011-06-28. (b) Incident PAR radiance (integrated value between 400-700 nm) outside the chamber (gray bars) and percent of radiance transmitted inside the chamber (black circles) during different times during 2011-06-28.
Blowers test
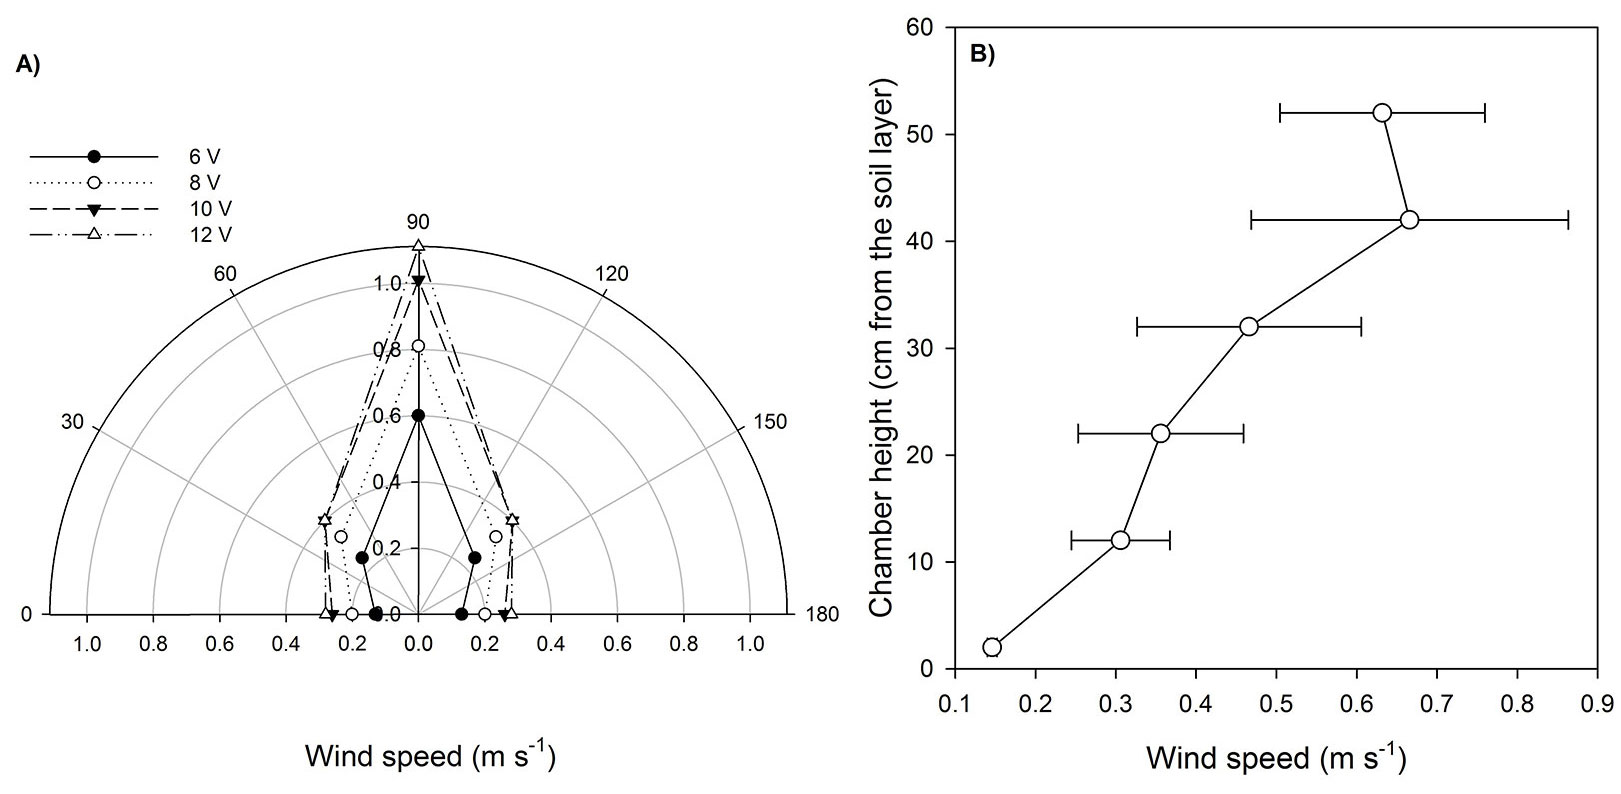
Inside the chamber, wind speed increased with chamber height, with the minimum wind speed recorded at 2 cm height (soil level) and the maximum between 42 and 52 cm height (Fig. 4b). Moreover, the wind speed was maximum at the zenith angle of 90° (perpendicular to the soil layer), while the minimum was found at 0° and 180° (parallel to the soil layer) (Fig. 4a). Several studies reported a change of the boundary layer at the soil level as a consequence of the fans functioning, causing an overestimation of soil CO2 effluxes ([4], [17], [35]). In our chamber, the lowest wind speed was recorded in the vicinity of the soil and the blowers speed did not sensibly affect the soil CO2 emission rates. On the contrary, it improved significantly the precision of the measurement expressed as the coefficient of variation of the flux (Tab. 2).
Fig. 4 - (a) Wind speed measured at different zenith angles for different blowers power. Black circles, white circles, black triangles and white triangles represent the wind speed (m s-1) measured at 6, 8, 10 and 12 volts blowers voltage respectively. The rotation speed of the blowers was function of power supply. The measurements were carried out inside the chamber at 22 cm height. (b) Wind speed profile. White circles represent the wind speed measured across the chamber height profile with the blowers at 10 volts. Bars represent the standard error of the wind speed mean over 5 different zenith angles.
Chamber comparison
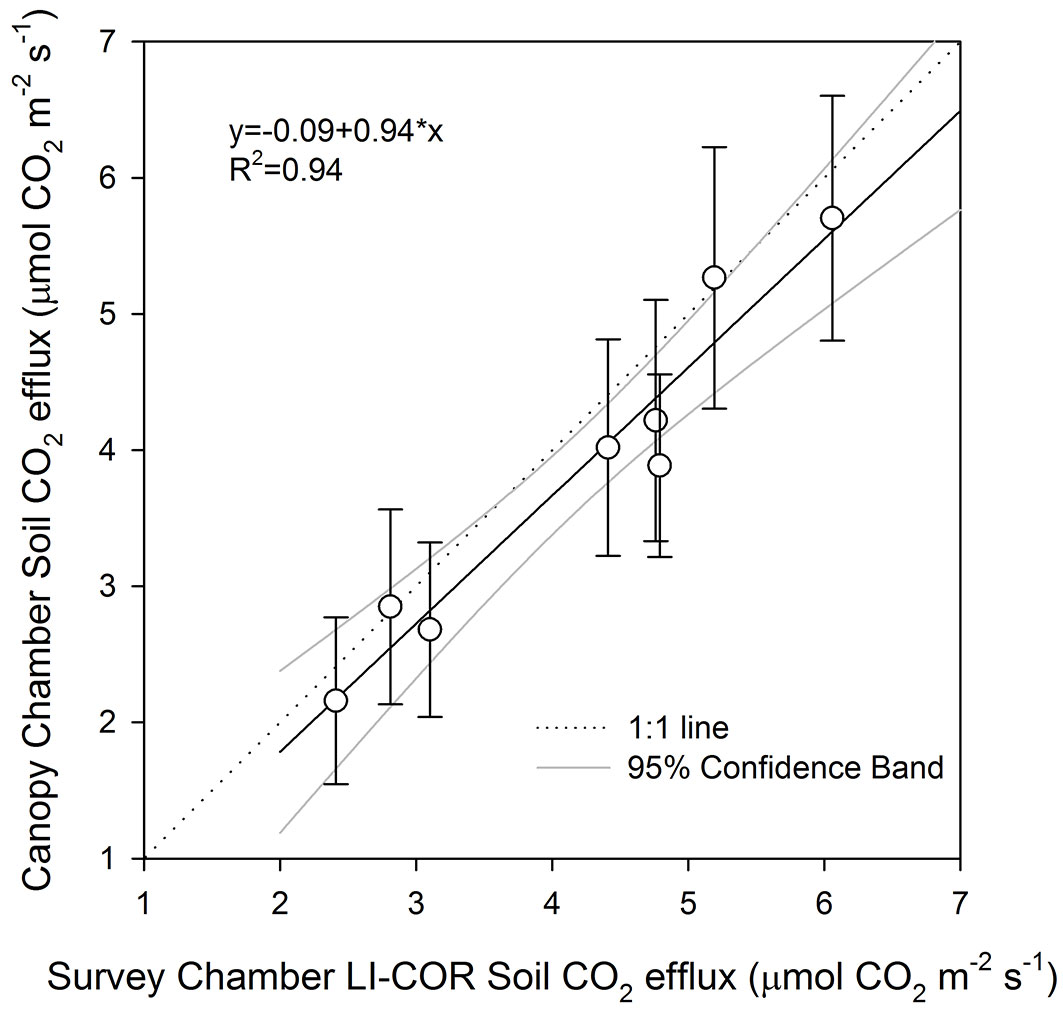
The result of the comparison showed a non-significant deviation between the fluxes measured by the Canopy Chamber and the Soil Survey Chamber 8100-103, as demonstrated by the linear regression with a not significant intercept (p = 0.82) and not different from the 1:1 line (Fig. 5). Although the comparison was conducted on bare soil, the small deviation resulting between the averaged points and the Canopy Chamber is probably due to the high spatial variability generally present in soil CO2 efflux ([41]).
Fig. 5 - Relationship between soil CO2 efflux measured by Canopy Chamber and Soil Survey LI-COR 8100-103 chamber. The dotted line represent the 1:1 line, the black line represent the linear regression and grey lines the 95% confidence band. The vertical bars represent the standard deviation of the mean (n=5).
CO2 flux measurements in a Mediterranean garrigue
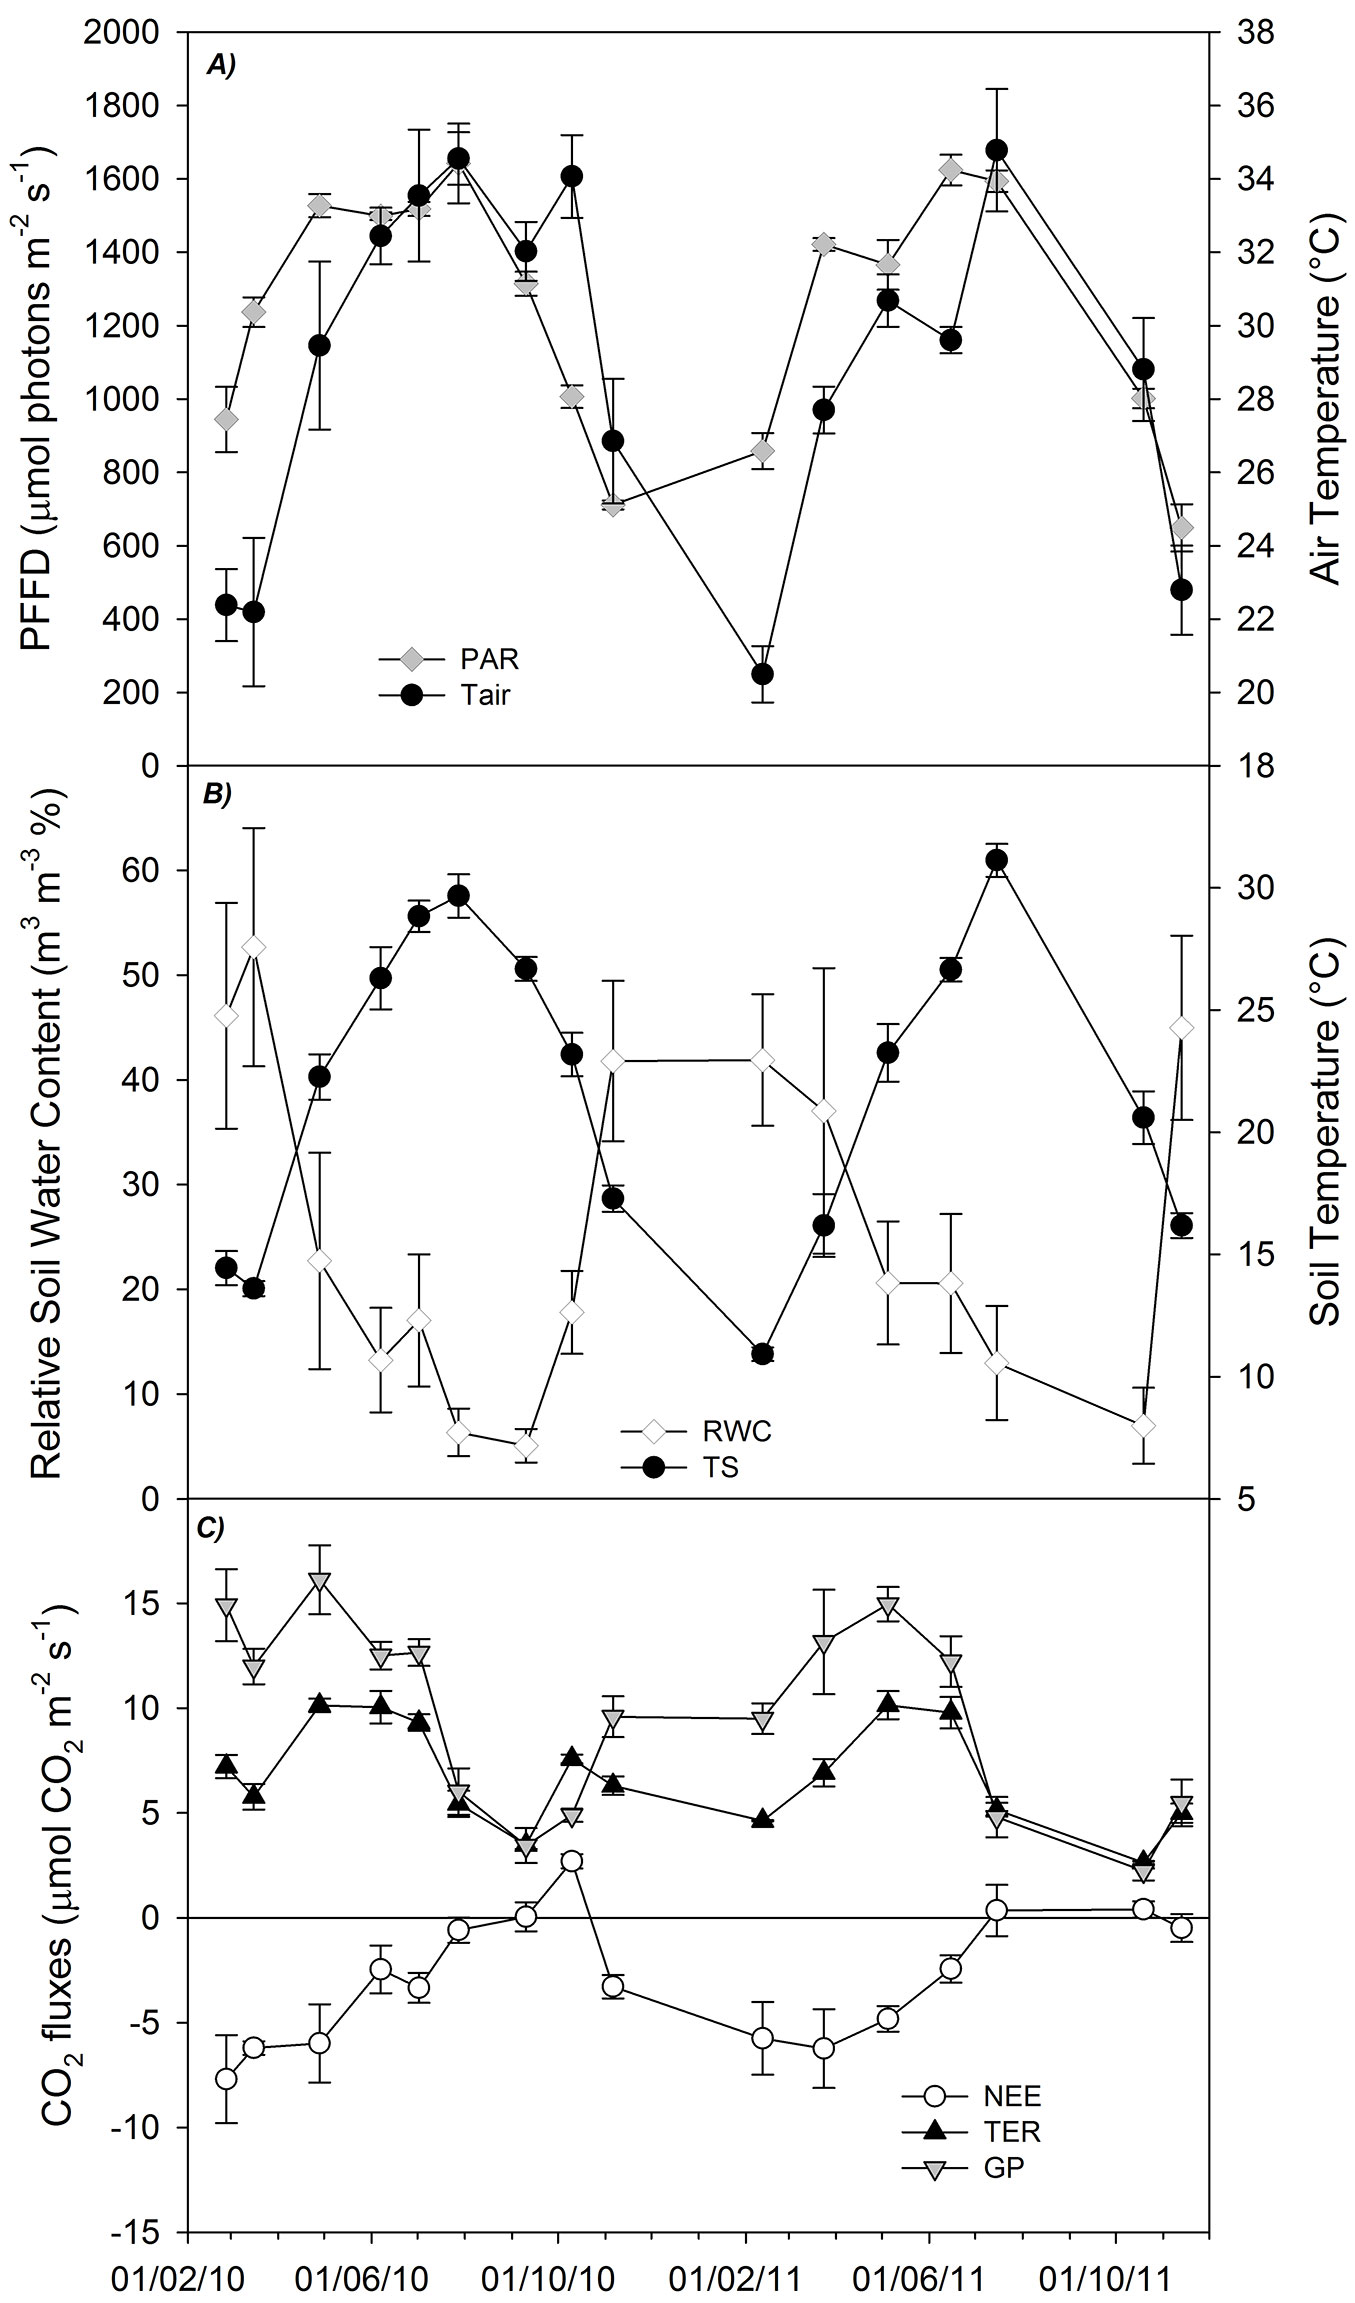
Over the two years of field measurements, the environmental factors (photosynthetically active radiation, air temperature, soil water content and soil temperature) showed high temporal variability, with the typical trends of the Mediterranean climate: the highest values of air, soil temperature and radiation were measured together with the lowest value of soil water content and vice versa (Fig. 6A and Fig. 6B). During the same period, the CO2 fluxes measured by the Canopy Chamber showed a significant seasonal variability (Repeated measures ANOVA, p<0.0001 - Fig. 6C), similar between the two years: the gross photosynthesis (GP) increased almost continuously from the winter period (11.98 ± 0.84 µmol CO2 m-2 s-1) until the early spring (16.12 ± 1.64 µmol CO2 m-2 s-1). Afterwards, following the decrease of soil water content, GP started to decline until it reached its minimum in summer (3.45 ± 0.83 µmol CO2 m-2 s-1). Total ecosystem respiration (TER) showed a similar temporal trend (Fig. 6C) increasing from the winter value of 7.22 ± 0.55 µmol CO2 m-2 s-1 to the maximum of 10.13 ± 0.33 µmol CO2 m-2 s-1 recorded in spring; then gradually decreasing until the minimum of 3.49 ± 0.20 µmol CO2 m-2 s-1 recorded at the end of the summer.
Fig. 6 - Measured values recorded during the field application of the chamber. (A) Air condition inside the chamber: the grey diamonds represent the incident radiation while the black circles represent the air temperature (°C). (B) Soil condition: white diamond and black circle represent soil water content and soil temperature at 5 cm depth, respectively. (C) Gross photosynthesis (GP; grey triangles), Ecosystem Respiration (TER; black triangles) and Net Ecosystem Exchange (NEE; white circle). The bars represent the standard error of the mean (n=6).
Consequently, NEE showed a maximum uptake of CO2 during late winter-spring (about -7.69 ± 1.48 µmol CO2 m-2 s-1); after this period it gradually reduced, reaching a balance between the GP and TER during the summer (Fig. 6C). This seasonal variation of GP, TER and NEE is similar to that observed in other Mediterranean ecosystems ([48], [31], [1]) where productivity rates are higher in spring followed by a strong summer reduction connected both to the stomatal and non-stomatal limitation to the photosynthesis ([14], [15]) and to the drought semi-deciduous habitus of Cistus species ([47], [10]).
The autumnal rains re-activated both photosynthetic and respiratory processes, but to different extent: TER peaked at 7.58 ± 0.21 µmol CO2 m-2 s-1, while GP reached only 4.63 ± 0.03 µmol CO2 m-2 s-1. As a result, the ecosystem became a net source of CO2 (+2.69 ± 0.32 µmol CO2 m-2 s-1).
The delay of the autumnal recovery of the photosynthesis is due to the summer semi-deciduous habits of Cistus in semi-arid environment; meanwhile, the availability of respiratory substrates, derived from leaves fall and fine roots dead during the summer drought ([23]), coupled with favourable soil water conditions (Fig. 6B), substantially increased the respiratory fluxes, as already observed in other arid and semi-arid ecosystems ([20], [31], [45]). A comparison of the fluxes measured by our Canopy Chamber with those deriving from comparable or different measuring techniques, in similar environment is limited because of the lack of data. However, GP and TER reported by our investigation are similar to the fluxes measured with a chamber system in a cork oak understorey in Portugal, and mainly composed by Cistus crispus and Cistus salvifolius ([8]). Moreover the fluxes measured in this study were within the values measured by eddy covariance and reported by Unger et al. ([44]) for a savannah-like woodlands during drought period and Reichstein et al. ([36]) for a Juniperus phoenicia L. shrubland located near our experimental site.
Conclusion
The developed modular Canopy Chamber was a useful tool to measure the CO2 fluxes at ecosystem level. The chamber tests showed microclimatic disturbances within the range (and in some case outperformed) of other chambers reported in the literature. The error due to the chamber leaks is estimated in 1% per minute; the temperature increment was always below 1.3 °C, the visible radiation reduction due to chamber walls was about 10% and the pressure variations between outside and inside the chamber were in such a range that the gas exchange measurements were not critically altered. In addition, we found that the use of radial ventilators, oriented to move the air in vertical direction, guaranteed an optimal air mixing with the minimum interference with the soil CO2 effluxes.
Furthermore, the open field application showed the suitability of this instrument to monitor the CO2 fluxes (NEE, TER and estimated GPP) in remote areas, with relative small and complex plant canopies as a semi-arid Mediterranean garrigue. There, the Canopy Chamber was able to detect CO2 fluxes in a wide range of environmental conditions, evidencing the high seasonality of the CO2 fluxes and giving the opportunity to obtain both NEE and TER during daytime. These positive tests and application indicated that this Canopy Chamber could be used in various experimental situations and could give the opportunity to know the dynamics of CO2 fluxes of shrubland vegetation as well the contribution of understory shrubland vegetation to the whole forest ecosystem fluxes.
Acknowledgements
The authors thank the financial support by the European Union FP7 - Infrastructure-2008-1 project INCREASE, contract no. 227628.
References
CrossRef | Gscholar
CrossRef | Gscholar
Gscholar
CrossRef | Gscholar
Authors’ Info
Authors’ Affiliation
Giovanbattista De Dato
Dario Liberati
Paolo De Angelis
University of Tuscia, Department for Innovation in Biological, Agro-Food and Forest Systems (DIBAF), v. S. Camillo de Lellis snc, I-01100 Viterbo (Italy)
National Research Council of Italy (CNR), Istitute for Agro-Environment and Forest Biology (IBAF), v. Salaria km 29.300, I-00015 Monterotondo Scalo, RM (Italy)
Council for Agricultural Research and Economics (CREA), Forestry Research Centre (CREA-SEL), v.le Santa Margherita 80, I-52100 Arezzo (Italy)
Global Change Research Centre, Division of Impact Studies and Physiological Analyses, Belidla 4a, CZ-60300, Brno (Czech Republic)
Corresponding author
Paper Info
Citation
Guidolotti G, De Dato G, Liberati D, De Angelis P (2017). Canopy Chamber: a useful tool to monitor the CO2 exchange dynamics of shrubland. iForest 10: 597-604. - doi: 10.3832/ifor2209-010
Academic Editor
Tamir Klein
Paper history
Received: Aug 25, 2016
Accepted: Mar 26, 2017
First online: May 15, 2017
Publication Date: Jun 30, 2017
Publication Time: 1.67 months
Copyright Information
© SISEF - The Italian Society of Silviculture and Forest Ecology 2017
Open Access
This article is distributed under the terms of the Creative Commons Attribution-Non Commercial 4.0 International (https://creativecommons.org/licenses/by-nc/4.0/), which permits unrestricted use, distribution, and reproduction in any medium, provided you give appropriate credit to the original author(s) and the source, provide a link to the Creative Commons license, and indicate if changes were made.
Web Metrics
Breakdown by View Type
Article Usage
Total Article Views: 51823
(from publication date up to now)
Breakdown by View Type
HTML Page Views: 43055
Abstract Page Views: 3646
PDF Downloads: 3867
Citation/Reference Downloads: 20
XML Downloads: 1235
Web Metrics
Days since publication: 3181
Overall contacts: 51823
Avg. contacts per week: 114.04
Article Citations
Article citations are based on data periodically collected from the Clarivate Web of Science web site
(last update: Mar 2025)
Total number of cites (since 2017): 10
Average cites per year: 1.11
Publication Metrics
by Dimensions ©
Articles citing this article
List of the papers citing this article based on CrossRef Cited-by.
Related Contents
iForest Similar Articles
Research Articles
Using field and nursery treatments to establish Quercus suber seedlings in Mediterranean degraded shrubland
vol. 13, pp. 114-123 (online: 26 March 2020)
Research Articles
Effects of warmer and drier climate conditions on plant composition and biomass production in a Mediterranean shrubland community
vol. 1, pp. 39-48 (online: 28 February 2008)
Research Articles
Links between phenology and ecophysiology in a European beech forest
vol. 8, pp. 438-447 (online: 15 December 2014)
Review Papers
Open top chamber and free air CO2 enrichment - approaches to investigate tree responses to elevated CO2
vol. 3, pp. 102-105 (online: 15 July 2010)
Research Articles
Methods for biomass stock estimation in Mediterranean maquis systems
vol. 10, pp. 108-114 (online: 21 August 2016)
Research Articles
Establishment of a planted field with Mediterranean shrubs in Sardinia and its evaluation for climate mitigation and to combat desertification in semi-arid regions
vol. 2, pp. 77-84 (online: 10 June 2009)
Research Articles
Vertical position of dry mass and elemental concentrations in Pinus sylvestris L. canopy under the different ash-nitrogen treatments
vol. 8, pp. 838-845 (online: 25 March 2015)
Research Articles
Evergreen species response to Mediterranean climate stress factors
vol. 9, pp. 946-953 (online: 07 July 2016)
Research Articles
Developing stand transpiration model relating canopy conductance to stand sapwood area in a Korean pine plantation
vol. 14, pp. 186-194 (online: 14 April 2021)
Research Articles
Effects of mild drought on the morphology of sun and shade needles in 20-year-old Norway spruce trees
vol. 12, pp. 27-34 (online: 10 January 2019)
iForest Database Search
Search By Author
Search By Keyword
Google Scholar Search
Citing Articles
Search By Author
Search By Keywords
PubMed Search
Search By Author
Search By Keyword

