Variation in resistance to the rust fungus Melampsora larici-populina Kleb. in Populus nigra L. in the Czech Republic
iForest - Biogeosciences and Forestry, Volume 9, Issue 1, Pages 146-153 (2015)
doi: https://doi.org/10.3832/ifor1458-008
Published: Oct 26, 2015 - Copyright © 2015 SISEF
Research Articles
Abstract
Differences in Populus nigra L. clone resistance to the rust fungus Melampsora larici-populina Kleb. (MLP) were studied in field trials where infected trees were compared with fungicide-protected trees. MLP rust infections were assessed using a 6-point scale. Four parameters of poplar growth were also measured to gauge host response to infection: shoot thickness, shoot number at the end of the growing season, individual plant dry weight, and dry matter yield per unit area. Five of eight known pathogen virulence types were detected. Cumulative growth in shoot thickness in sprayed and unsprayed plots was similar in clones with high rust pathogen resistance, but significantly different in clones with low resistance. Clones with low resistance also exhibited delayed growth initiation in the year following infection, an effect attributed to lower food storage accumulated during the previous year, reflected in a reduction in stem diameter. Based on stem thickness measurements, it was confirmed growth ceased at the end of August. Average rust severity symptoms ranged from 2.75 to 4.22 on the 6-point scale. The percentage reduction for the various growth parameters resulting from rust infection ranged as follows: individual plant dry weight 5-64%; dry matter yield 21-66%; shoot number 17-46%; and stem diameter 1-35%. Exclusive of stem diameter, these reductions correlated with severity in MLP rust infection. The one exception was tolerance to rust infection displayed by one of the clones. Clones with the lowest growth reductions were 97/152 and 97/157. Growth and yield parameter variation as a result MLP resistance difference was observed among tested P. nigra clones. This variation can be viewed as confirmation that resistance observed in this study and P. nigra clones is a suite of quantitative traits. These findings have important implications for MLP resistance breeding programs.
Keywords
Stem diameter, Pathogen effects, Pathogen tolerance, Melampsora larici-populina virulence, Field infection
Introduction
In Europe, rust caused by the basidiomycete Melampsora larici-populina Kleb. (MLP) is the primary disease of cultivated poplars and causes severe damage leading to economic losses ([14]). Steenackers et al. ([30]) reported that serious infections by this obligate biotrophic parasitic fungus result in premature leaf-fall and a delay in flushing the following year, resulting in significant growth reductions, and suggested that infections have a negative influence on poplar wood quality, because the annual ring is incompletely formed, with insufficient late wood and poor lignification.
MLP is distributed throughout the whole Eurasian continent and its range is supposed to encompass that of the natural host P. nigra ([1]). MLP is a leaf rust fungus with a heteroecious macrocyclic lifestyle, where the life cycle is dependent on two different host species. Diploid teliospores overwinter on senescent poplar leaves and in early spring, haploid basidiospores disseminate by wind to infect larch needles, leading to haploid pycniospores production. Fusion of opposite mating types generates aecia containing dikaryotic aeciospores. These wind-borne spores then infect poplar leaves in spring and summer and produce another sporulation structure called the uredinium, which corresponds to the familiar orange pustule formed on the abaxial epidermis of infected mature poplar leaves. Large numbers of urediniospores are released from these uredinia during spring and summer and disperse over very large distances ([1]). In autumn, teliospores are formed once again in the black telia pustules found on infected leaves ([17]).
MLP in Europe displays variability in pathogenicity and five pathotypes (E1 to E5) have been recognized, distinguished on the basis of eight virulence types ([29]). All virulence types have been observed in western Europe, although in central Europe, the main types to date have been virulence 3 and 4, and to a lesser extent types 2 and 5 ([1]). The geographic distribution of types is likely due to the cultivation of different cultivars compared to those grown in western Europe. Pinon & Frey ([28]) detected significant differences between fungal populations parasitizing wild and cultivated poplar stands. Results showed complex pathotypes recovered primarily from cultivated poplar stands were absent or very rare in riparian P. nigra populations. The pathotypic structure distinguished the cultivated stands with high richness (pathotype diversity) and complexity (mean virulence number in pathotypes) from the wild stands with low richness and complexity. High linkage disequilibria between virulence indicated preferential virulence associations, probably due to selection imposed by host tree availability ([16]). Pinon & Frey ([28]) reported the main selection force exerted on rust populations was host population. However, Xhaard et al. ([32]) showed poplar cultivation influenced spatial distribution and genetic structure of the fungal plant pathogen and resulted in the spread of a range of different virulence alleles in most pathogen populations.
The poplar clones currently grown in Europe are primarily the result of inter-specific crosses between the American species, P. deltoides Bartram ex Marsh. and P. trichocarpa Torr. & A. Gray, the Asian species P. maximowiczii Henry, and the European P. nigra L. Indeed, 90% of cultivars sold in 2009 by nurseries to growers in France were interspecific hybrids of just two types, P. deltoides × P. trichocarpa and P. deltoides × P. nigra ([13]). In Belgium, the hybrid clones P. deltoides × P. trichocarpa and the reciprocal ([30]) and P. deltoides × P. nigra are grown. In Italy, the hybrid “I-214” and related clones derived from crossing P. deltoides with P. nigra are the main poplars distributed to growers.
In central Europe, the trend in recent years has been to grow the hybrid clone P. nigra × P. maximoviczii “Max 4” ([19]). The original domestic species P. nigra is not commonly grown in its pure form because few cultivars are available ([18]).
Differences among individual Populus species reaction to MLP infection depend on species resistance levels. Resistance is broadly defined as any mechanism that reduces the extent of pathogen infection, whereas the ability of a host to reduce the pathogen effect on growth is defined as tolerance ([7]). P. deltoides is the only one of the four species listed which showed a qualitative resistance to the rust MLP, i.e., a resistance based on either one or two major genes ([10]). However, this resistance type can be suddenly overcome by emergence of new virulence in a relatively short period of time following release of a new cultivar ([13]). For example, Pinon & Frey ([29]) observed considerable progressive losses in the hybrid cultivar P. trichocarpa × P. deltoides “Beaupré”, widely grown in France and Belgium, when the resistance gene R7 was overcome. The biomass yield reduction caused by MLP was ’ ¼ 20-30% in the first year and up to 50-60% in the following year ([15]). In view of the transitory nature of resistance based on qualitative resistance genes, plant breeders have now focused their efforts on quantitative resistance genes, where selection is slower, but the risk of a sudden loss in resistance is reduced. Furthermore, selection is a more difficult process; the observed resistance is an interaction between genotype and environment ([26]).
Studies of the molecular basis for MLP resistance identified three major gene loci: R1 and Mer, two qualitative resistance genes inherited from P. deltoides, which were effective against virulence 1 and 7 of the pathogen, respectively, and RUS, a major quantitative resistance factor inherited from P. trichocarpa, with a strong effect on uredinia size. RUS and R1 were identified at INRA, France ([10]), whereas a Belgian team identified Mer ([6]). Genetic analysis results of quantitative resistance to MLP in P. deltoides × P. trichocarpa F1 progenies showed quantitative resistance was not as polygenic ([23], [12], [10], [11], [21]).
Solutions to delay pathogen adaptation must rely on a more careful exploration of the genetic variability available in the European species P. nigra, which co-evolved with the pathogen and on the simultaneous release of several unrelated cultivars to generate greater host diversity on a regional scale ([13]). Qualitative resistance to MLP in P. nigra has not yet been detected ([22], [24], [29]). However, Benetka et al. ([2]) conducted genetic analysis of P. nigra resistance and observed marked variation in susceptibility to MLP in the tested progeny of several resistant parent genotypes, which provided evidence for quantitative resistance in this species.
The aim of the present study was to measure resistance to Melampsora larici-populina in selected P. nigra clones as expressed by MLP symptom development, and compare growth and yield parameters in trees treated and untreated with fungicide.
Material
Materials
Ten P. nigra clones (designated 98/7, 97/38, 98/109, 98/115, 98/117, 97/152, 97/157, 98/101, 108, and 210), with different levels of Melampsora larici-populina Kleb. (MLP) resistance were derived from our own breeding program using P. nigra ([4]). Two clones (98/7 a 97/152) were employed in previous trials ([3]). Parental trees were found in a natural environment; crosses were made between parental individuals from different natural climatic and geographic conditions. The genetic diversity was previously confirmed in these individuals by microsatellite DNA analyses ([4]).
A set of test clones, including “Robusta”, “Ogy”, “Brabantica” (P. deltoides × P. nigra), “Unal”, “Hoogvorst”, “Rap”, “Beaupré” (P. trichocarpa × P. deltoides), “Aurora” (P. candicans Ait.), and “87B12” (P. deltoides - [28], [29]) were planted to determine the MLP virulence spectrum present in the trials.
Locality and organization
The trials were established in spring 2007 at Michovky, located near the Silva Tarouca Research Institute, Public Research Institute in Průhonice (Central Bohemian Region, Czech Republic, 49° 59′ 30″ N, 14° 34′ 34″ E). Average temperatures and precipitation for the experimental period 2009-2011 are shown in Tab. 1.
Tab. 1 - Average temperatures (T) and precipitation (P) at the trial locality - Pruhonice (2009-2011).
| Year | Variable | Jan | Feb | Mar | Apr | May | Jun | Jul | Aug | Sep | Oct | Nov | Dec | Sum | Mean |
|---|---|---|---|---|---|---|---|---|---|---|---|---|---|---|---|
| 2009 | P (mm) | 17.3 | 36.9 | 53.5 | 20.7 | 94.4 | 107.4 | 112.6 | 37.6 | 25.8 | 51.4 | 26.6 | 53.4 | 637.6 | - |
| T (° C) | -3.4 | 0.3 | 4.8 | 12.8 | 14.2 | 15.9 | 19.2 | 19.6 | 15.7 | 8.3 | 6.4 | -0.3 | - | 9.4 | |
| 2010 | P (mm) | 8.5 | 35 | 22.3 | 31.9 | 100.8 | 80.1 | 133.1 | 104 | 42.5 | 8.9 | 49.5 | 57.4 | 674 | - |
| T (° C) | -4.1 | -0.7 | 4.3 | 9.6 | 12.7 | 17.5 | 20.9 | 18 | 12.2 | 6.7 | 5.2 | -4.6 | - | 8.1 | |
| 2011 | P (mm) | 35.4 | 9.7 | 26.7 | 33 | 40.3 | 110.8 | 180.1 | 63.8 | 36.5 | 46.1 | 2.1 | 34.6 | 619.1 | - |
| T (° C) | -0.3 | -1.1 | 5.3 | 11.9 | 14.8 | 18.5 | 17.5 | 18.7 | 15.2 | 8.3 | 2.7 | 2.9 | - | 9.5 |
One-year old saplings obtained by cultivating 0.2 m-long hardwood cuttings, 5 to 6 mm thick were planted by hand at 2.20 × 0.45 m spacing (an initial plant density of 10 101 plants per ha). Two treatments with four replications and four or five plants per replication were used in a randomized block design. Border rows were planted around the experimental plot to reduce potential border effects, and plots were fenced to prevent wild animal browsing.
Plants were pruned by hand to a height of 0.1 m above ground in early spring 2009. At the end of this growing period, the two thickest and two thinnest shoots (with minimum diameter of 0.01 m) per plant were selected and girth at a 0.5 m height was color-marked to facilitate future identification.
Treatments
One set of trees was fungicide-sprayed [S] and the other unsprayed [U]. A guard row was planted between S and U treatments. During 2009-2011, a combination of the fungicides Amistar (Azoxystrobin) and Impact (Flutriafol) was applied to the S variant. All applications were made at concentrations of 0.05% Amistar and 0.05% Impact. Spraying was applied three times per year; in mid-July, the beginning of August, and the end of August. The effects of the last fungicide application lasted until the end of the growing season (see below).
Evaluating MLP incidence
Melampsora larici-populina resistance levels were evaluated under field conditions using a 6-point scale: 0 - absence of rust infection on leaves; 1 - small patches covered by uredia on one half of the leaves; 2 - small patches covered by uredia on most leaves; 3 - larger patches of rust or continuous coverage on all leaves; 4 - rust covering all leaf surfaces, incipient leaf necrosis; 5 - all leaves necrotised or shed. The overall plant condition was also noted. The evaluations were conducted on various dates during 2009-2011, and at least four times per year. The first observation was in mid-July, when the first rust signs were observed, and the final at the beginning of September.
The last 10 days in August were the best time to make assessments of clone resistance. Earlier in the year, infection pressures were lower and later in the year, pressures were so high premature leaf-fall occurred in some clones. Consequently, valuable data could be lost in the unsprayed tree group. The point values used for analysis were the means of the point evaluations made for each replicate.
The spectrum of MLP virulence present was determined by reference to the rust virulence found in test clones.
Measurements
At the end of each growing period, all shoots thicker than 0.01 m were counted and diameters measured. During the 2010 and 2011 growing periods, diameter growth of each color-marked stem was measured using a digital caliper at a 0.5 m height above ground at fourteen-day intervals. Furthermore, following biomass harvest in January 2012 (see below), all shoots thicker than 0.01 m at the end of the 2012 growing season were counted to measure re-sprouting. Growth at the initiation of the growing season was defined as the difference in shoot thickness at the end of the previous growing season and the first shoot thickness measure in spring (“2010-1” and “2011-1”, respectively). Growth measured at the second observation in spring was defined as the difference between the first and second measurement dates (“2010-2” and “2011-2”, respectively).
Biomass was harvested in January 2012. During harvest, the fresh weight biomass produced from all plants of the same clone in each replicate and treatment were weighed. Dry weight yield was estimated at the same time by obtaining a representative sample of the harvested material, including main and lateral shoots from each replicate and weighed separately. The size of these samples ranged from 400 to 1200 g, depending on shoot thickness. The samples were dried at 105 °C until the weight stabilized. The average dry matter weight of individual plants (DMIP) was calculated as follows: harvested fresh biomass weight obtained from each replicate was multiplied by the corresponding per cent dry matter (ratio of the dry matter weight to fresh weight of the sample), divided by the number of plants in the corresponding replicate expressed in kg yr-1. Total dry matter yield per unit area per year was calculated for specific unit areas (ha) and the percentage of living plants.
Decrease in individual growth parameters caused by MLP infections, expressed as a percentage was calculated by the following formula, using values for sprayed [S] and unsprayed [U] trees (eqn. 1):
Statistical analyses
Analysis of variance (ANOVA, MANOVA) was applied using the software package STATISTICA® ver. 8.0 (StatSoft Inc., Tulsa, OK, USA). Clones, treatments and replicates were used as independent variables; parameters including MLP incidence, total dry matter yield per unit area, DMIP, shoot number decrease per plant, thickest shoot diameter, and dry matter yield per unit area were treated as dependent variables. Following analyses, statistically significant differences among means were tested by the post-hoc Duncan’s test. Significant differences between S and U treatments overall, and S and U treatments among clones were established on the basis of t-tests. Unless otherwise stated, an a priori significance level of α = 0.05 was established.
Correlations were tested using Spearman’s coefficient of rank correlation. This test was applied to evaluate the constancy in infection degree within the black poplar clones during the observation years, and the relationship between severity of clone infection and observed changes in growth and dry weight parameters.
Results
MPL occurrence
A preliminary objective of this study was to determine the spectrum of virulence of the rust MLP based on test clones known to be susceptibles. Virulences 2, 3, 4, 5 and 7 were detected on test clones, and resistance to such spectrum was assessed on S and U treatments.
Significant differences in MLP occurrence between the S and U treatments were detected by the second assessment date at the beginning of August. The S treatments were mildly infected, despite fungicide application, primarily at the start of September during the first year, when MLP presence on most suceptible clones was rated as high as 2.5. MLP assessments ceased relatively early (i.e., less than two month) due to the growth period of P. nigra, which finished earlier than in the hybrid clones P. deltoides × P. nigra and P. nigra × P. maximoviczii “Max 4”. The positive correlation and significant t-test results between treated and untreated trees regarding MLP infections in 2009 and 2010 (r = 0.748; P < 0.05 and r = 0.816; P < 0.01, respectively) provided evidence to support limited genetic resistance in the clones, which was observed even when fungicide was applied. Significant differences in infection levels among clones in each of the three years of observations showed variation in MLP resistance among the genotypes (clones) under investigation (Tab. 2). These conclusions were based on an assessment of ’ ¼200 trees. ANOVA differentiated clones into groups with varying degrees of disease resistance. Neither extremely high infection nor complete resistance (immunity) to MLP were observed in the clones examined.
Tab. 2 - Mean point values for rust incidence: unsprayed clones classified based on infection severity. Different letters within the same column indicate significant differences among means after Duncan’s test (p<0.05).
| Clone | 2009 | 2010 | 2011 | mean 2009-2011 |
|---|---|---|---|---|
| 108 | 2.88 a | 2.63 ab | 2.75 a | 2.75 a |
| 97/152 | 3.00 a | 3.13 bc | 2.25 a | 2.79 a |
| 97/157 | 3.25 ab | 2.88 abc | 2.25 a | 2.79 a |
| 210 | 3.25 ab | 2.50 a | 4.00 b | 3.25 b |
| 98/109 | 3.25 ab | 3.38 cd | 4.00 b | 3.54 bc |
| 98/117 | 3.13 ab | 3.38 cd | 4.38 b | 3.63 cd |
| 98/115 | 3.38 ab | 3.38 cd | 4.13 b | 3.63 cd |
| 98/7 | 3.63 bc | 3.88 ef | 4.25 b | 3.92 de |
| 98/101 | 4.00 c | 3.75 d | 4.38 b | 4.04 e |
| 97/38 | 4.00 c | 4.33 f | 4.33 b | 4.22 e |
Rust infection effects on shoot formation
Growth in shoot thickness
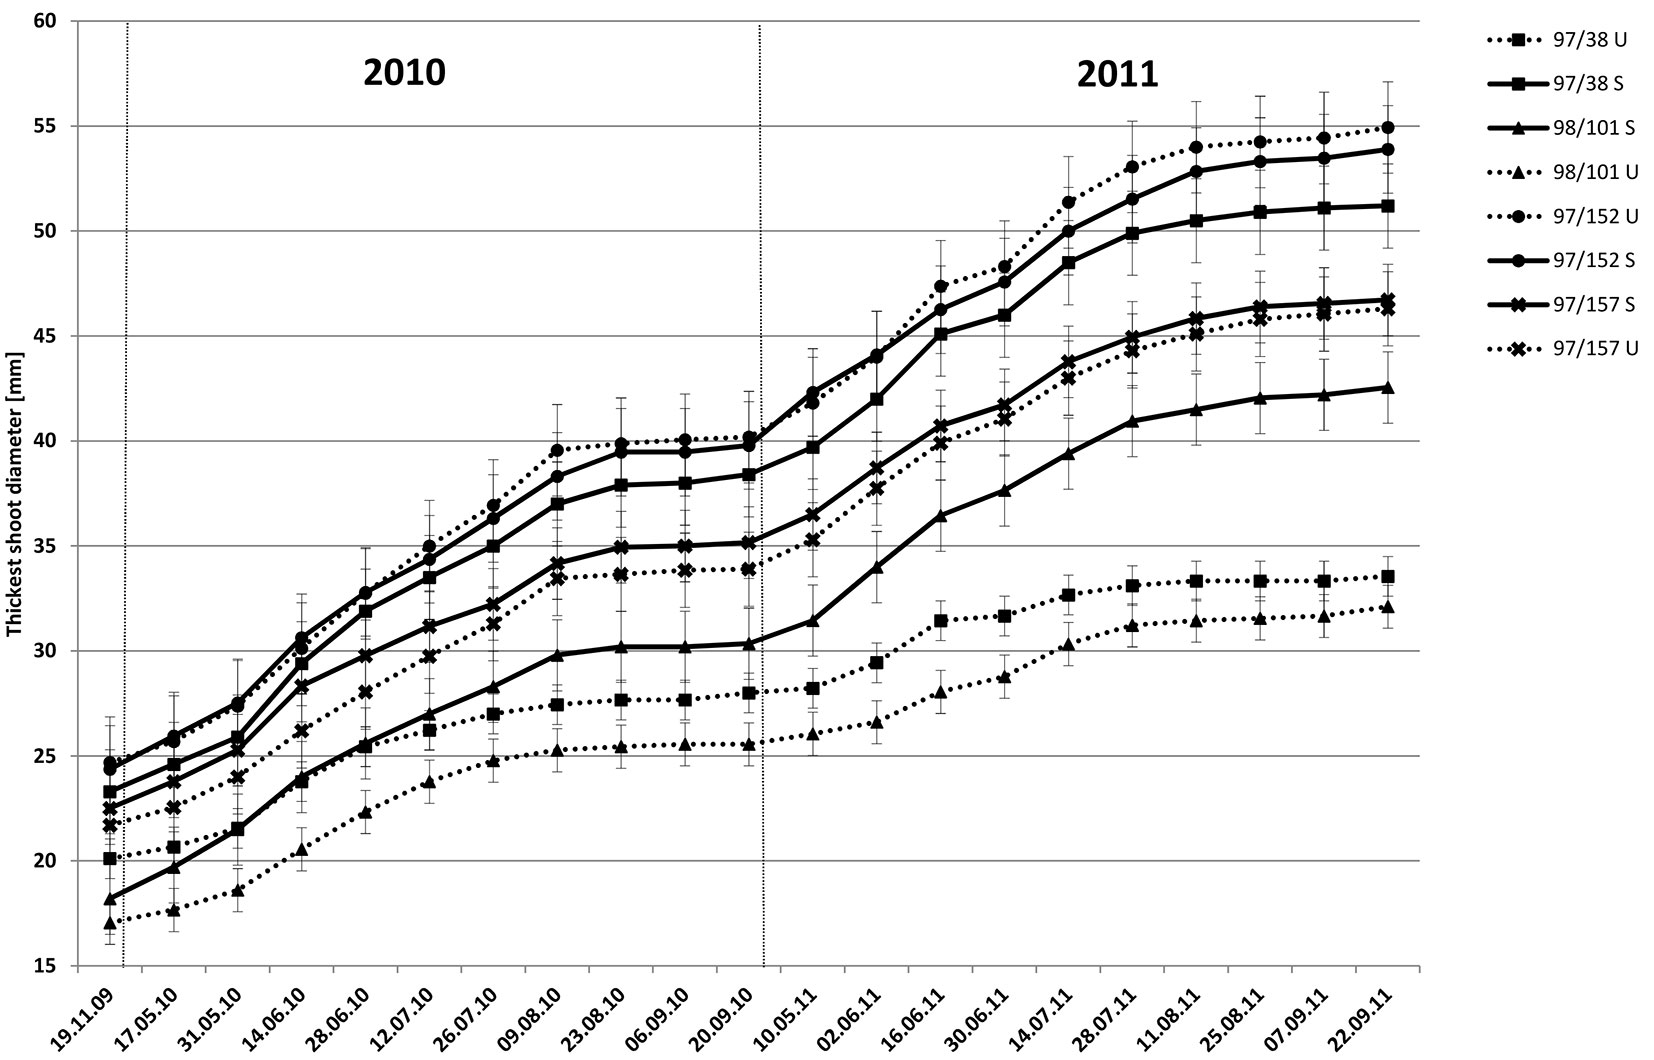
Observations were made at 14-day intervals on the selected, marked shoots for the entire growing season (2010 or 2011). The following two sets of observations were recorded: cumulative thickness in shoot growth and shoot thickness change. For clarity, only the thickest shoots of two clones with the lowest infection levels and two clones with the highest infection levels are shown in Fig. 1. In the clones with high resistance (97/152 and 97/157), the observed growth was similar in the S and U treatments. The initial fast clone growth in thickness was complete by the last 10 days of August and resumed again at the beginning of the next growing season; a pattern repeated in the following year. Differences between the treated and untreated clones with low resistance (97/38 and 98/101) were significant and consistent with t-tests based on mean shoot thickness (Tab. 3). Slow growth in untreated trees was seen in both years. Growth ceased at the end of August in both treatments, although this was less obvious in untreated trees due to an overall decreased growth rate.
Fig. 1 - Growth (mean ± SE) of the thickest shoot in two resistant (97/152 and 97/157) and two susceptible (97/38 and 98/101) clones, sprayed (S) and un-sprayed (U), in 2010 and 2011.
Tab. 3 - Average growth (difference in shoot thickness, mm) of clones during spring. (a): growth measured as the difference between the first observation date and the last from the preceding year; (b): growth measured as the difference between the first and second observation dates; (N): number of plant; (*): p < 0.05; (**): p < 0.01; (***): p < 0.001; (ns): not significant.
| clone | N | 2010-1 a | 2010-2 b | 2011-1 a | 2011-2 b | |||||||||
|---|---|---|---|---|---|---|---|---|---|---|---|---|---|---|
| S | U | S | U | t-test | S | U | t-test | S | U | t-test | S | U | t-test | |
| 98/7 | 15 | 14 | 1.40±0.74 | 0.71±0.83 | * | 2.33±1.05 | 1.86±0.77 | ns | 1.60±1.45 | 1.21±0.97 | ns | 1.80±1.26 | 1.71±1.68 | ns |
| 97/38 | 10 | 9 | 1.30±0.48 | 0.56±0.73 | * | 1.30±0.82 | 0.89±0.78 | ns | 1.30±0.95 | 0.22±0.44 | ** | 2.30±1.25 | 1.22±1.20 | ns |
| 98/101 | 20 | 18 | 1.50±1.00 | 0.61±0.70 | ** | 1.80±1.06 | 0.94±0.87 | * | 1.10±0.85 | 0.50±0.71 | * | 2.55±1.57 | 0.56±0.70 | *** |
| 108 | 20 | 20 | 0.85±0.75 | 0.20±0.41 | ** | 0.95±0.76 | 0.85±0.67 | ns | 1.05±1.15 | 0.70±0.66 | ns | 1.40±0.99 | 1.75±1.07 | ns |
| 98/109 | 20 | 20 | 1.50±0.76 | 1.05±0.83 | ns | 2.25±1.07 | 1.60±0.94 | * | 2.05±1.28 | 1.00±1.12 | ** | 2.60±1.67 | 2.05±1.64 | ns |
| 98/115 | 15 | 16 | 0.33±4.58 | 0.75±0.77 | ns | 2.93±4.27 | 1.56±0.89 | ns | 1.93±0.88 | 1.38±1.41 | ns | 2.60±1.30 | 1.81±0.98 | ns |
| 98/117 | 16 | 17 | 1.19±0.75 | 0.82±0.73 | ns | 1.63±0.81 | 1.82±1.01 | ns | 1.50±1.26 | 1.18±1.07 | ns | 2.19±1.38 | 1.88±1.17 | ns |
| 97/152 | 19 | 16 | 1.58±0.77 | 1.00±0.63 | * | 1.58±1.17 | 1.69±1.14 | ns | 2.53±1.78 | 1.63±1.02 | ns | 1.79±1.32 | 2.19±1.38 | ns |
| 97/157 | 18 | 20 | 1.28±0.89 | 0.85±0.88 | ns | 1.50±0.62 | 1.45±1.23 | ns | 1.33±0.84 | 1.40±0.88 | ns | 2.22±1.52 | 2.45±1.15 | ns |
| 210 | 20 | 20 | 0.60±0.68 | 0.50±0.51 | ns | 1.65±1.09 | 0.85±0.67 | ** | 1.00±0.73 | 0.60±0.82 | ns | 2.00±1.08 | 1.10±1.17 | * |
| - | 173 | 170 | 1.16±0.12 | 0.71±0.06 | *** | 1.78±0.12 | 1.35±0.08 | ** | 1.54±0.09 | 1.00±0.08 | *** | 2.13±0.10 | 1.69±0.10 | ** |
Changes in shoot thickness growth of several clones during the growing season are shown in Fig. 2, along with average rainfall data. In the resistant clone 97/152, growth in untreated trees was initially slightly higher than in treated trees. From the middle of August, growth in thickness decreased in both treatments and from the end of August to the start of September, growth was negligible. In the susceptible clone 97/38, untreated trees exhibited lower growth. Growth was minimal in both treatments from the middle of August to the end of the growing season when measured in early September. A further interesting result was growth at the onset of the experiment, where the observations in the first year showed minimal differences between treated and untreated trees (~0.5 mm), with the exception of clone 98/101 (0.9 mm - Tab. 3). During the second year, notable differences were recorded in growth thickness between treated and untreated trees in susceptible clones, although in clones with increased resistance the differences were minimal (Tab. 3). Results indicated lower carbohydrate accumulation from the previous year was responsible for the delay in growth initiation. Statistical analyses confirmed these results (Tab. 3). Significant differences were detected between treated and untreated trees between the last observation at the termination of one year’s growing season (September) and the first observation of the next year’s growing season (first half of May, 2010-1 and 2011-1 - Tab. 3); and also the following observation at the end of May (2010-2 and 2011-2 - Tab. 3), during a period of rapid growth. In clones with higher resistance (97/157 and 97/152), a significant difference in growth initiation between treated and untreated trees was revealed only in 97/152. In susceptible clone 98/101, significant differences were observed in shoot growth thickness for the entire study period, but in clone 97/38 only during the first growing season measurements (2010-1 and 2011-1 - Tab. 3).
Fig. 2 - Incremental growth of the thickest shoot (measured at 14-day intervals). (solid line): sprayed; (broken line): un-sprayed; (bar): precipitation. (a): rust-susceptible clone (97/38); (b) rust-tolerant clone (98/7); (c) rust-resistant clone (97/152).
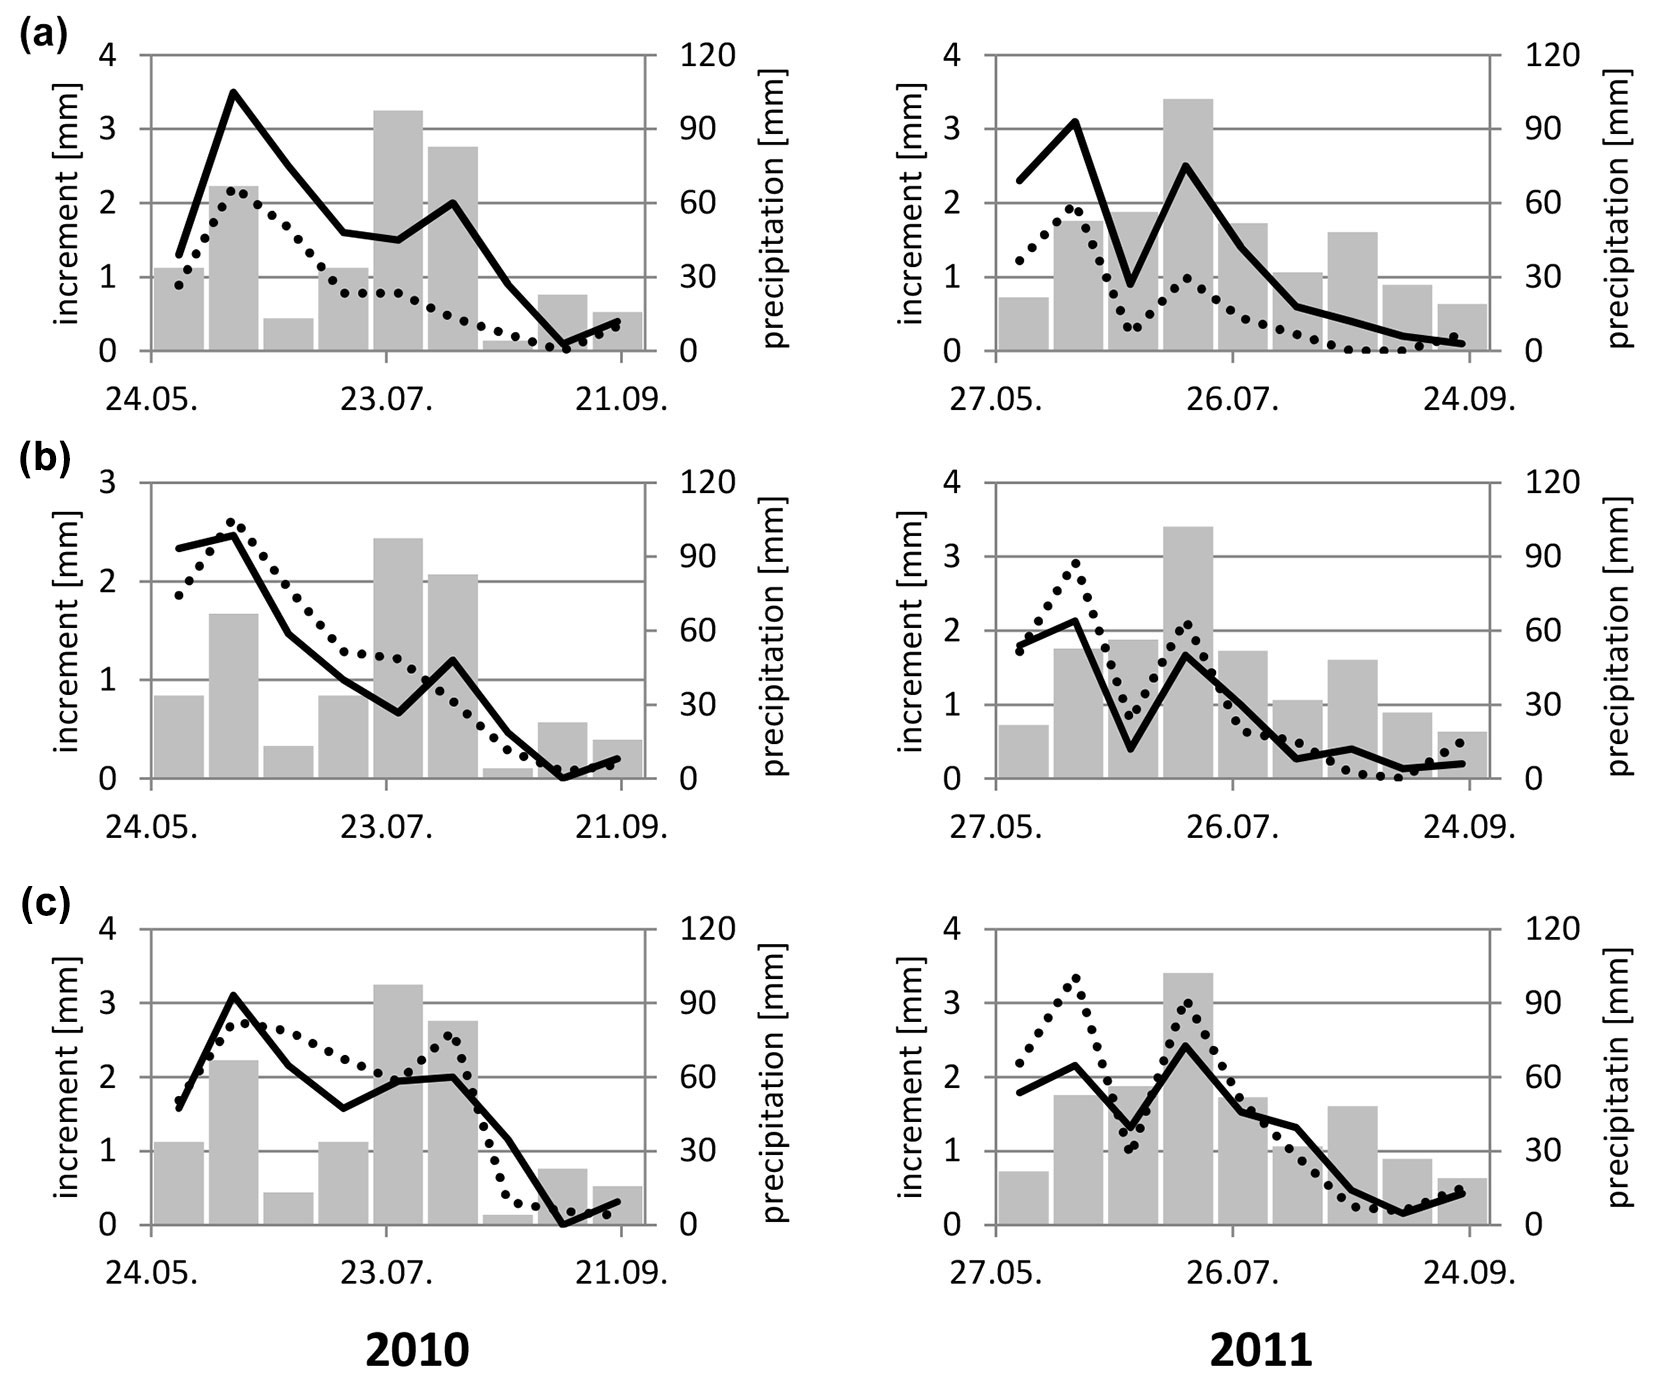
In the first year, significant rainfall was experienced during the first half of June and from the end of July to early September. Higher rainfall was accompanied by increased stem thickness in resistant clones. In susceptible clones, increased stem thickness was only recorded in mid-June for both treatments. In the second period of higher rainfall, only sprayed clones responded, likely because MLP inhibited growth in untreated trees. In the second year, higher rainfall arrived in mid-July, resulting in higher growth rates in resistant and susceptible trees, S and U. Low infection pressures at that time indicated negative effects due to MLP infection were not observed. Clone 98/7, which acted tolerant to MLP infection effects (see below), responded as a resistant clone.
By the end of August, growth in thickness terminated and was evidently not associated with MLP activity, since the same observations were made in resistant clones. This confirmed that by the end of August, black poplar had ceased growth and was no longer laying down reserves.
Shoot number
In the first trial year, following the first harvest, significant differences were not detected in the number of shoots produced by clones in treated and untreated trees, although the average number of shoots was higher in treated trees (Tab. 4). In the second and third year, a significant difference in shoot number was observed between sprayed and unsprayed trees of clones 98/101 and 98/117. In addition, a difference was detected for clone 210 in the third year. In the third year, a general decline in shoot number was recorded compared to the previous year in treated and untreated trees, which was due to a loss of weaker shoots caused by competitive pressures from thicker shoots.
Tab. 4 - Shoot number at the end of the growing period. (N): number of plants; (**): p < 0.01; (***): p < 0.001; (ns): not significant.
| clone | N | 2009 | 2010 | 2011 | |||||||
|---|---|---|---|---|---|---|---|---|---|---|---|
| S | U | S | U | t-test | S | U | t-test | S | U | t-test | |
| 98/7 | 15 | 14 | 9.33 ± 1.10 | 8.29 ± 0.86 | ns | 10.60 ± 1.31 | 8.07 ± 1.04 | ns | 9.40 ± 1.23 | 6.93 ± 0.65 | ns |
| 97/38 | 11 | 10 | 6.55 ± 0.99 | 5.30 ± 1.03 | ns | 7.64 ± 1.36 | 4.60 ± 1.15 | ns | 6.45 ± 0.82 | 4.60 ± 1.16 | ns |
| 98/101 | 20 | 19 | 15.10 ± 0.81 | 13.00 ± 1.55 | ns | 17.45 ± 1.13 | 9.47 ± 1.18 | *** | 13.65 ± 0.97 | 7.37 ± 0.83 | *** |
| 108 | 20 | 20 | 9.60 ± 0.69 | 11.10 ± 0.68 | ns | 11.30 ± 0.74 | 11.30 ± 0.68 | ns | 9.50 ± 0.72 | 10.30 ± 0.74 | ns |
| 98/109 | 20 | 20 | 9.30 ± 0.77 | 9.65 ± 0.59 | ns | 10.90 ± 0.95 | 9.75 ± 0.66 | ns | 9.58 ± 0.80 | 7.95 ± 0.56 | ns |
| 98/115 | 15 | 16 | 12.20 ± 0.94 | 12.69 ± 0.79 | ns | 14.13 ± 0.91 | 12.88 ± 0.83 | ns | 12.53 ± 0.87 | 10.44 ± 0.85 | ns |
| 98/117 | 16 | 17 | 13.56 ± 0.91 | 12.06 ± 1.22 | ns | 16.06 ± 1.28 | 12.29 ± 1.17 | ** | 12.69 ± 0.98 | 8.47 ± 0.97 | *** |
| 97/152 | 19 | 16 | 9.32 ± 0.84 | 9.50 ± 0.65 | ns | 11.05 ± 0.83 | 10.88 ± 0.85 | ns | 9.32 ± 0.71 | 9.56 ± 0.70 | ns |
| 97/157 | 18 | 20 | 7.65 ± 0.90 | 9.50 ± 0.97 | ns | 8.94 ± 1.03 | 10.35 ± 1.21 | ns | 8.61 ± 0.93 | 8.65 ± 0.98 | ns |
| 210 | 20 | 20 | 9.40 ± 0.65 | 8.70 ± 0.62 | ns | 10.30 ± 0.63 | 8.85 ± 0.56 | ns | 10.00 ± 0.62 | 7.80 ± 0.52 | *** |
| - | 174 | 172 | 10.33 ± 0.32 | 10.20 ± 0.33 | ns | 11.97 ± 0.38 | 10.08 ± 0.33 | *** | 10.29 ± 0.31 | 8.38 ± 0.27 | *** |
During re-growth following the second harvest, a difference in shoot number was detected in treated compared with untreated trees. Even prior to fungicide application, eight clones exhibited a decreased number of shoots in untreated trees (two significantly different). This result suggested the difference was caused by MLP development affecting reserve formation during the period before harvest. This was confirmed by a high negative correlation (r = -0.598; P = 0.005) between rust symptom severity before harvest and number of shoot formed in treated and untreated trees.
Shoot thickness
The inhibiting effects of MLP on shoot thickness were observed as early as the first year following the first harvest (Tab. 5). The average thickness of the thickest shoots in most clones was lower in unsprayed trees and a significant difference was shown between treated and untreated trees in clone 97/38. In the second and third years, a difference was indicated in four and five clones, respectively. It is perhaps worth noting, however, in clones 98/7 and 97/152 shoots were thicker in unsprayed trees, although the differences were not statistically significant. Furthermore, clone 98/7 was also suffering from a severe MLP attack at the time (average intensity 3.6).
Tab. 5 - Diameter of the thickest shoot at the end of the growing period (mm). (N): number of plants; (*): p < 0.05; (**): p < 0.01; (***): p < 0.001.
| clone | N | 2009 | 2010 | 2011 | |||||||
|---|---|---|---|---|---|---|---|---|---|---|---|
| S | U | S | U | t-test | S | U | t-test | S | U | t-test | |
| 98/7 | 15 | 14 | 18.53 ± 0.81 | 20.86 ± 0.82 | ns | 29.73 ± 1.66 | 31.79 ± 1.48 | ns | 39.33 ± 2.73 | 42.29 ± 2.52 | ns |
| 97/38 | 11 | 10 | 23.30 ± 0.79 | 20.11 ± 0.73 | ** | 38.40 ± 1.85 | 28.00 ± 1.79 | *** | 51.20 ± 3.40 | 33.56 ± 3.30 | ** |
| 98/101 | 20 | 19 | 18.20 ± 0.59 | 17.06 ± 0.59 | ns | 30.35 ± 1.17 | 25.56 ± 1.31 | ** | 42.55 ± 2.03 | 32.11 ± 2.11 | ** |
| 108 | 20 | 20 | 19.05 ± 0.60 | 18.70 ± 0.44 | ns | 30.55 ± 1.28 | 28.70 ± 0.80 | ns | 41.75 ± 2.19 | 40.25 ± 1.49 | ns |
| 98/109 | 20 | 20 | 21.20 ± 0.73 | 20.10 ± 0.67 | ns | 35.55 ± 1.72 | 31.70 ± 1.29 | ns | 49.90 ± 2.68 | 41.90 ± 2.21 | * |
| 98/115 | 15 | 16 | 20.73 ± 0.71 | 19.19 ± 0.69 | ns | 36.80 ± 1.94 | 31.44 ± 1.30 | * | 52.47 ± 3.30 | 44.31 ± 2.24 | * |
| 98/117 | 16 | 17 | 18.81 ± 0.73 | 19.59 ± 0.65 | ns | 31.25 ± 1.59 | 30.47 ± 1.25 | ns | 43.00 ± 2.59 | 40.00 ± 2.16 | ns |
| 97/152 | 19 | 16 | 24.37 ± 0.85 | 24.69 ± 1.04 | ns | 39.79 ± 1.76 | 40.19 ± 2.15 | ns | 53.89 ± 2.57 | 54.94 ± 3.11 | ns |
| 97/157 | 18 | 20 | 22.50 ± 0.89 | 21.70 ± 0.57 | ns | 35.17 ± 1.70 | 33.90 ± 1.17 | ns | 46.72 ± 2.82 | 46.30 ± 1.89 | ns |
| 210 | 20 | 20 | 23.25 ± 0.48 | 22.00 ± 0.49 | ns | 35.25 ± 0.93 | 30.75 ± 0.81 | *** | 47.00 ± 1.55 | 40.20 ± 1.57 | ** |
| - | 174 | 172 | 20.95 ± 0.28 | 20.38 ± 0.26 | ns | 34.13 ± 0.54 | 31.31 ± 0.49 | *** | 46.62 ± 0.86 | 41.84 ± 0.81 | *** |
Thick and weak shoot growth was also examined separately. The average growth of thick shoots between the first and second years (2009 and 2010) was significantly higher, as expected, in treated trees, as was the average growth in the following year (2010 to 2011), but growth was lower than the first trial period (2009/2010) for treated and untreated groups. The higher growth of three treated clones (97/38, 98/101 and 210) in both periods (2009/2010 and 2010/2011) was statistically significant.
The inhibiting MLP infection effects on shoot thickness was also found in weaker shoots, although the differences between treated and untreated were not significant. Significant differences were found in two individual clones between the first and second years (98/101 and 98/115), and in three clones between the second and third years (98/101, 98/7, and 98/115). In addition, untreated trees of clone 97/157 exhibited significantly thicker shoots as compared with those treated.
Differences between the two treatments in shoot number and thickness increased over the trial years, and emphasize the cumulative negative effects of MLP infection.
MLP influence on biomass yield
Fungicide-treated trees showed the yield potential of the studied clones without the negative effects of MLP infection. Results showed clones (both treated and untreated) varied in DMIP and total dry matter yield per unit area (Tab. 6). The heaviest treated clones averaged 2.02 kg, compared with the lightest, which averaged 1.14 kg. MLP infections significantly reduced DMIP in two clones (98/117 and 98/101). The clone with the highest yield per unit area among treated trees produced 19.03 t ha-1, compared with the lowest yield of 11.12 t ha-1. Total dry matter yield per unit area was significantly lower in four clones (97/38, 98/101, 98/115 and 98/117) and marginally lower in clone 210. The largest differences were observed in clones with the severest MLP infections, and the smallest in clone 97/157, which exhibited the mildest MLP infection symptoms.
Tab. 6 - Yield per unit area (dry matter, t ha-1 yr-1) and yields per plant (dry matter, kg yr-1). Values followed by the same letter are not statistically different (p > 0.05) according to Duncan’s test. (*): p < 0.05; (**): p < 0.01; (ns): not significant.
| clone | Yield per area [t ha-1 yr-1] | DMIP [kg plant-1 year-1] | ||||
|---|---|---|---|---|---|---|
| S | U | t-test | S | U | t-test | |
| 98/7 | 11.12 ± 2.59 b | 8.51 ± 0.48 bc | ns | 1.15 ± 0.23 b | 0.97 ± 0.06 bc | ns |
| 97/38 | 14.91 ± 2.05 ab | 5.88 ± 2.23 bc | * | 1.67 ± 0.38 ab | 0.88 ± 0.47 c | ns |
| 98/101 | 11.52 ± 1.73 b | 3.95 ± 0.84 c | ** | 1.14 ± 0.17 b | 0.41 ± 0.09 c | ** |
| 108 | 14.55 ± 1.69 ab | 11.10 ± 1.14 ab | ns | 1.44 ± 0.17 ab | 1.10 ± 0.11 bc | ns |
| 98/109 | 11.66 ± 1.80 b | 8.51 ± 1.50 bc | ns | 1.15 ± 0.18 b | 0.84 ± 0.15 c | ns |
| 98/115 | 12.45 ± 0.85 b | 9.56 ± 0.70 bc | * | 1.34 ± 0.15 ab | 0.95 ± 0.07 bc | ns |
| 98/117 | 11.97 ± 1.20 b | 6.84 ± 0.73 bc | * | 1.18 ± 0.12 b | 0.68 ± 0.07 c | * |
| 97/152 | 19.03 ± 0.98 a | 15.13 ± 3.03 a | ns | 2.02 ± 0.22 a | 1.92 ± 0.38 a | ns |
| 97/157 | 15.41 ± 3.08 ab | 15.97 ± 3.21 a | ns | 1.75 ± 0.43 ab | 1.58 ± 0.32 ab | ns |
| 210 | 13.96 ± 1.47 ab | 8.82 ± 1.53 bc | ns | 1.38 ± 0.15 ab | 0.87 ± 0.15 c | ns |
Decrease in yield parameters caused by MLP and resistance variability
The MLP-induced decrease in four growth parameters (shoot number per plant, thickest shoot diameter, individual plant dry matter weight (DMIP), and dry matter yield per unit area) was calculated as a percentage (see eqn. 1). This approach primarily eliminates differences in the growth potential of individual clones and facilitates comparisons. Clones with the lowest MLP infection levels, 97/157 and sometimes 97/152 and 108, showed the absence of growth parameter reductions, and in untreated trees even an increase (Tab. 2, Tab. 7). In the other clones, decreases in parameters were observed, as expected. Yield reductions were in the range of 21-66%, DMIP 5-64%, shoot numbers 17-46%, and thickest shoot diameter 1-35%.
Tab. 7 - Reduction in growth characteristics of clones infected by M. larici-populina. Different letters in the same column indicate significant difference among means after Duncan’ test (p<0.05).
| yield per area | DMIP | number of shoots | thickest shoot diameter | ||||
|---|---|---|---|---|---|---|---|
| clone | decrease (%) | clone | decrease (%) | clone | decrease (%) | clone | decrease (%) |
| 97/157 | -3.6 a | 97/152 | 4.9 ab | 108 | -8.4 a | 98/7 | -7.5 a |
| 97/152 | 20.5 abc | 97/157 | 9.5 a | 97/152 | -2.6 ab | 97/152 | -1.9 ab |
| 98/115 | 23.2 abc | 98/7 | 15.3 ab | 97/157 | -0.5 ab | 97/157 | 0.9 ab |
| 98/7 | 23.5 ab | 108 | 23.7 abc | 98/115 | 16.7 abc | 108 | 3.6 abc |
| 108 | 23.7 abc | 98/109 | 27 abc | 98/109 | 17 abc | 98/117 | 7 abc |
| 98/109 | 27 abcd | 98/115 | 29.4 abc | 210 | 22 abc | 210 | 14.5 abc |
| 210 | 36.8 bcd | 210 | 36.8 bc | 98/7 | 26.3 abc | 98/115 | 15.5 abc |
| 98/117 | 42.8 bcd | 98/117 | 42.8 bc | 97/38 | 28.7 abc | 98/109 | 16 abc |
| 97/38 | 60.6 cd | 97/38 | 47.7 c | 98/117 | 33.2 bc | 98/101 | 24.5 bc |
| 98/101 | 65.7 d | 98/101 | 63.6 c | 98/101 | 46 c | 97/38 | 34.5 c |
Significant differences in growth parameter percentages were detected after Duncan’s test. Results divided the clones into groups (3-6) on the basis of clone response to MLP infection. Two clones (97/157 and 97/152) demonstrated either an increase or a negligible decrease in all four-yield parameters, and the same applied to clone 98/7, with the exception of shoot number. In clones 97/38 and 98/101, decrease in parameters was consistently highest, and all other clones ranged between these two extremes.
In comparing decrease in yield parameters with MLP infection severity (as judged by symptoms), our results showed a positive correlation in three variables: dry matter yield per unit area (r = 0.628, P = 0.052), DMIP (r = 0.695, P = 0.026), and number of shoots (r = 0.860, P = 0.001). However, a correlation was not detected in reduction of shoot thickness due to the rather anomalous response of clone 98/7. This clone showed a high infection level, however 98/7 exhibited a small decrease in yield and shoot thickness, and the diameter of thickest shoots actually increased, inconsistent with high infection.
Discussion
This study of MLP infection effects on Populus nigra was based on the fact that carbon is involved in radial growth as a structural material and is fundamentally involved in all metabolic processes. This can be observed more or less directly via changes in stem diameter and respiration rates ([9]). Furthermore, storage material concentration, availability, and production, including carbohydrates such as starch and sugar in all tree components depend on time of year and specific genotype (clone - [27]). Two important dates were identified during our observations on stem growth during two years of the trials. Lower growth in untreated clones with low MLP resistance was identified at the start of the growing season, consistent with Steenackers et al. ([30]). This was the result of lower levels of storage materials produced in the previous year due to debilitating infection effects. In addition, shoot thickness ceased at the end of August in treated and untreated trees. This time frame was the effective end of the growing season and the termination of storage material production. This also corresponded with the gradual yellowing of leaves and leaf fall, starting at the beginning of September, and MLP also ceased to have any further effects on clones. This confirmed the growing season in black poplar finished earlier than in other species and in inter-specific hybrids. Over a period of three years, it was possible to observe increasingly greater differences between treated and untreated trees in terms of shoot thickness with low MLP resistance. Our results suggested a cumulative effect due to a decrease in food reserve accumulation caused by MLP. In this way, it was possible to use shoot thickness as an indicator of stress caused by the fungal pathogen MLP in black poplar, as in other plants ([8], [25]).
The presence of various MLP races active in this experiment was estimated by testing different clones with eight known virulence types ([29]). As a result, we confirmed the presence of virulence 2, 3, 4, 5 and 7, as previously reported ([1], [3]). Virulence 1, 6, and 8 were not identified.
On the basis of MLP symptom severity, the genotypes (clones) displayed considerable differences, from leaves totally effected and showing signs of necrosis, to relatively mild symptoms. Mild infections did not cause a reduction in biomass yield or shoot thickness. However, infection levels in these clones were higher than in clones derived from newer, intra-specific hybrids planted under similar conditions ([4]).
The range of symptoms and responses observed demontrated the existence of variation in MLP resistance. Some clones exhibited an absence of growth parameter reduction, however other clones showed notably high reductions. Infected genotypes with MLP tolerance were also recorded, according to Benetka et al. ([3]).
Similar to resistance established based on expressed symptoms, decrease in growth parameters divided clones into groups, which varied in reactions to MLP. This resistance measure corresponded to actual MLP infection and revealed tolerance presence, where a tree suffered apparently severe infection, while sustaining only a relatively small yield loss, compared with an intolerant infected cultivar ([5]). However, intolerant genotypes are somewhat problematic. During preliminary screenings at plant breeding stations, intolerant genotypes are often rejected due to the potential for high infection levels. However, a high tolerance clone combined with other desirable attributes, which are selected and subsequently propagated, could possess an infection reservoir and therefore, may be a threat to other clones.
The selected P. nigra genotypes with increased MLP resistance were derived from a hybrid population of ’ ¼ 2000 genotypes ([4]). These genotypes do not possess complete resistance as demonstrated by a pathotype population, which combined five virulence levels. Resistance studies in the hybrid population progeny have been ongoing for 12 to 17 years. Among the clones with relatively high resistance and good growth characteristics is a clone (108) obtained from a tree over one hundred years old.
It is debatable whether complete resistance (immunity) or resistance sufficient enough to prevent a reduction in performance from a given genotype is favored. In addition to resistance level, genotype persistence must also be considered. Johnson ([20]) reported resistance longevity estimates depended on the season and specific cultivar distribution under conditions favorable to the pathogen. Permanent resistance can only be regarded as provisional based on the results reported here. Vale et al. ([31]) showed permanent resistance genotype selection should be made under conditions where long-term exposure of the host to the pathogen has occurred.
The following question remains: how genetically distinct is P. nigra from the American species P. deltoides and P. trichocarpa based on molecular mechanisms for resistance? It might also be problematic for P. nigra to pass on resistance to progeny in inter-specific crosses, given progeny are typically more sensitive than parental taxa. Therefore, intra-specific crosses should be considered an alternative approach.
Conclusion
Substantial variability in rust MLP resistance was observed in P. nigra tested clones for all parameters examined. The results showed it was possible to select P. nigra for leaf rust Melampsora larici-populina resistance without reduced performance, and resistance will likely be stable. Results suggested the fairly high level of variability in P. nigra resistance indicated several quantitative traits are responsible for the attribute. Therefore, resistant clones identified here can be used as resistance donors in breeding programs. However, the disadvantage of P. nigra clones is a lower yield potential compared to interspecific hybrids, which might be a result of its shorter growing season.
Acknowledgement
The research was financed by institutional support (VUKOZ-IP-00027073). The authors gratefully acknowledge Malcolm Russell with English assistance. This contribution fits within the COST Action FP 1301 “EuroCoppice” of the EU Framework Programme Horizon 2020.
References
Gscholar
CrossRef | Gscholar
Online | Gscholar
Gscholar
Gscholar
Gscholar
Authors’ Info
Authors’ Affiliation
Katerina Novotná
Vojtech Benetka
Silva Tarouca Research Institute for Landscape and Ornamental Gardening, Publ. Res. Inst., Kvetnové námestí 391, CZ-252 43 Pruhonice (Czech Republic)
Corresponding author
Paper Info
Citation
Štochlová P, Novotná K, Benetka V (2015). Variation in resistance to the rust fungus Melampsora larici-populina Kleb. in Populus nigra L. in the Czech Republic. iForest 9: 146-153. - doi: 10.3832/ifor1458-008
Academic Editor
Alberto Santini
Paper history
Received: Sep 26, 2014
Accepted: Oct 01, 2015
First online: Oct 26, 2015
Publication Date: Feb 21, 2016
Publication Time: 0.83 months
Copyright Information
© SISEF - The Italian Society of Silviculture and Forest Ecology 2015
Open Access
This article is distributed under the terms of the Creative Commons Attribution-Non Commercial 4.0 International (https://creativecommons.org/licenses/by-nc/4.0/), which permits unrestricted use, distribution, and reproduction in any medium, provided you give appropriate credit to the original author(s) and the source, provide a link to the Creative Commons license, and indicate if changes were made.

Web Metrics
Breakdown by View Type
Article Usage
Total Article Views: 52314
(from publication date up to now)
Breakdown by View Type
HTML Page Views: 42460
Abstract Page Views: 4503
PDF Downloads: 3901
Citation/Reference Downloads: 18
XML Downloads: 1432
Web Metrics
Days since publication: 3899
Overall contacts: 52314
Avg. contacts per week: 93.92
Article Citations
Article citations are based on data periodically collected from the Clarivate Web of Science web site
(last update: Mar 2025)
Total number of cites (since 2016): 5
Average cites per year: 0.50
Publication Metrics
by Dimensions ©
Articles citing this article
List of the papers citing this article based on CrossRef Cited-by.
Related Contents
iForest Similar Articles
Research Articles
Verification of new Populus nigra L. clone improvement based on their performance over three rotations
vol. 13, pp. 185-193 (online: 12 May 2020)
Research Articles
Lenticel infection in Fraxinus excelsior shoots in the context of ash dieback
vol. 12, pp. 160-165 (online: 04 March 2019)
Research Articles
Latent infection of Biscogniauxia nummularia in Fagus sylvatica: a possible bioindicator of beech health conditions
vol. 9, pp. 49-54 (online: 18 June 2015)
Review Papers
Dutch elm disease and elm bark beetles: a century of association
vol. 8, pp. 126-134 (online: 07 August 2014)
Research Articles
A rapid method for estimating the median diameter of the stem profile of Norway spruce (Picea abies Karst) trees
vol. 10, pp. 328-333 (online: 11 February 2017)
Research Articles
Application of fungicides and urea for control of ash dieback
vol. 8, pp. 165-171 (online: 13 August 2014)
Research Articles
Efficacy of Phlebiopsis gigantea against Heterobasidion conidiospore and basidiospore infection in spruce wood
vol. 13, pp. 369-375 (online: 25 August 2020)
Short Communications
Endophytes in changing environments - do we need new concepts in forest management?
vol. 6, pp. 109-112 (online: 05 March 2013)
Short Communications
Detection and quantification of the air inoculum of Caliciopsis pinea in a plantation of Pinus radiata in Italy
vol. 12, pp. 193-198 (online: 10 April 2019)
Research Articles
Verticillium wilt of Ailanthus altissima in Italy caused by V. dahliae: new outbreaks from Tuscany
vol. 13, pp. 238-245 (online: 19 June 2020)
iForest Database Search
Search By Author
Search By Keyword
Google Scholar Search
Citing Articles
Search By Author
Search By Keywords
PubMed Search
Search By Author
Search By Keyword


