Species-specific climate response of oaks (Quercus spp.) under identical environmental conditions
iForest - Biogeosciences and Forestry, Volume 7, Issue 2, Pages 61-69 (2014)
doi: https://doi.org/10.3832/ifor0911-007
Published: Nov 18, 2013 - Copyright © 2014 SISEF
Research Articles
Abstract
Oak forests play a major role in Britain due to their economic, social and historic value. Sudden oak death and general decline symptoms have therefore caused major concerns in the forestry sector over the past decade. Several strategies have been proposed to preserve the economic and social value of oak forests, including the planting of native species with more southerly origins, or non-native species of oak that may be better suited to the projected climate of the future. The Ovington research plots, established 50 years ago at the Bedgebury Pinetum in southeast England, provided the opportunity to compare annual growth rates and climate-growth relationships of five oak species growing adjacent to each other on the same soil type and under the same climatic conditions. Clear differences were evident in annual increment and climate-growth responses for the five Quercus species. Growth rates were significantly lower (p<0.05) for the two species native to the UK (Q. petraea and Q. robur) compared to the southern European and American species. A partitioning analysis using key climatic variables separates Q. coccinea from the other species due to its negative response to low temperatures. These results were confirmed by pointer year analysis. The analysis suggests that Q. robur is likely to be the more resilient of the two native species of oak to the future climate of southern Britain. Of the non-native species of oak evaluated, Q. coccinea represents an alternative species to Q. robur and Q. petraea on very dry, nutrient-poor sites. Q. palustris may also have some potential under current conditions for species diversification, but its requirement for higher summer precipitation than the other four species suggests that this potential may not be sustained as climate change progresses. However, if alternative species are selected as more resilient to climate change in terms of growth, it will be essential to consider a range of other issues including impacts on biodiversity, resilience to endemic tree pests and diseases, form and appearance, landscape and timber quality.
Keywords
Quercus spp., Species Trial, Dendroecology, Climate-growth Relationships
Introduction
An increase in pest and disease outbreaks as well as projected climate warming constitutes a serious threat to forestry over the coming decades ([11], [65]). As a consequence of these impacts, individually or in combination, tree vitality and survival may decline resulting in reduced productivity ([43]). The resilience of species to biotic and abiotic stresses, as well as their adaptation potential to changing environmental conditions, is important knowledge to guide sustainable forest management ([6]). Oak comprises the highest percentage of broadleaved woodland in Great Britain but its yield is expected to decline in the south and east under future climate projections ([15]). These forests possess a high economic and socio-economic value ([27], [32]), raising the question as to whether replacement with another oak species, better adapted to summer drought and wet winters, is an appropriate response to projected climate change. While Quercus species are believed to show high competitiveness under drier conditions than currently experienced in southern England ([1], [15], [26]), Thomas et al. ([68]) found that a combination of waterlogging in winter and summer drought weakens oak to a level where diseases can attack more readily. Cases of drought-induced mortality have also been reported in Europe ([24], [12], [31], [3]). Modelled results presented by Attorre et al. ([7]) suggest that the general assumption regarding drought sensitivity is invalid; instead, the performance of oak is dependent on origin and the characteristics of individual species. Other authors attribute the decline of oak in Europe to a combination of several factors, including infection by Phytophthora cinnamomi exacerbated by climatic factors ([13]). Thomas & Blank ([67]) propose nutrient imbalance as the reason for oak decline, while Andersson et al. ([5]) concluded that the decline of oak and its inevitable death is a long process which can begin decades previously.
Tree ring analysis can be used to better understand the potential for an onset of decline driven by responses to climate ([60], [61]). Despite age and management-related variation in growth, the sensitivity of a species on a given site to environmental changes can be assessed ([30]). Tree-ring analysis is regularly used to evaluate climate-growth interactions as well as establishing the drivers for tree mortality ([19]). While site conditions modulate climate-growth correlations ([70], [45]) information on species-specific climate responses still can be derived ([17], [58]). This approach was the subject of a number of dendrochronological studies ([42], [25], [26], [21], [30], [34], [22], [59]). However, a direct comparison of the response to climate of different oak species growing in close proximity has not been undertaken for mature forest stands.
Our aims were: (1) to quantify growth differences between five Quercus species from one plantation in Bedgebury, UK; and (2) to calculate climate-growth correlations based on daily data.
Materials and Methods
Location and soil description
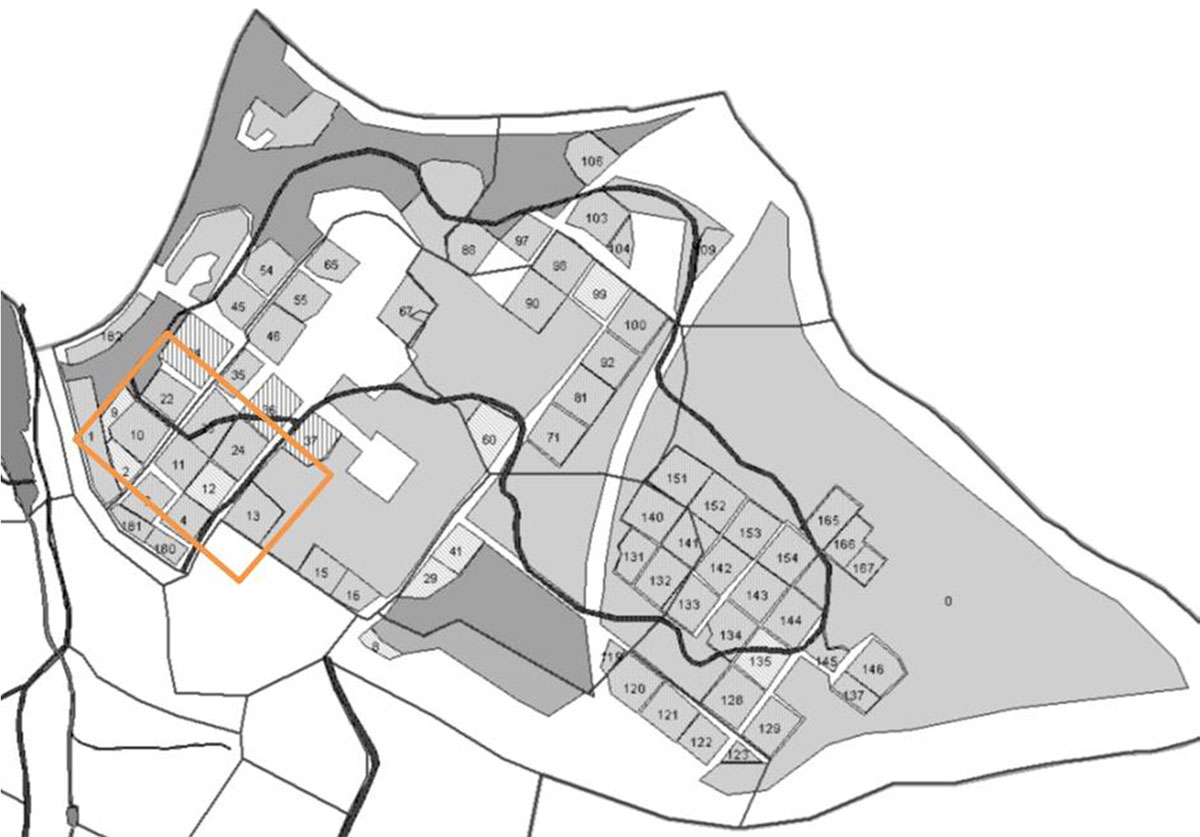
The samples were taken at a species trial in Bedgebury, Kent in the southeast of Britain. Originating from research plots set up by Ovington ([50]) in the late 1930’s the trial is laid out in plots of a quarter of a hectare each (Fig. 1).
Fig. 1 - The species trial in Bedgebury, Kent (51° 04’ N and 0° 27’ East). The oak plots evaluated in this study are all in the north-west corner (orange square) of the plantation and measure 100 m2 each. Number codes are: Q. coccinea (10), Q. petraea (11), Q. robur (13), Q. palustris (23), and Q. frainetto (24). Source: Forestry Commission 2013.
Planting and replanting of different species has occurred over the years and only a hand-full of the original Ovington plots still exist. Heavy losses occurred in the 2nd world war resulting in the need to re-establish the oak plots. The Bedgebury plantation has seen heavy damage due to wind throw in the more recent past (1987, 1991); the oak stands, however, have been sheltered from wind damage due to their location in the north-western area at the lowest point of the slope ([36]). Soils under the oak stands are acidic, permeable loams. Drainage is limited and waterlogging can occur, especially in winter and after heavy rainfall ([36]). The soils are phosphorus-deficient and generally low in other nutrients ([47]). Soil pH ranges from 5 to less than 4 ([50], [51], [52]).
Species selection
The Quercus stands sampled in this study are in close proximity to one another within a 100 x 200 m rectangle. The stands have been thinned regularly and all have a closed canopy structure. The understory vegetation can be dense with some Rhododendron spp. present. Planted in the late 1950’s they were about 45 years at time of sampling. Five different oak species were suitable for coring, namely Q. coccinea, Q. petraea, Q. robur, Q. palustris and Q. frainetto (Tab. 1).
Tab. 1 - General information on the five investigated Quercus species.
| Species | Common name | Natural distribution | Site requirements |
|---|---|---|---|
| Q. coccinea | Scarlet oak | native to eastern and central North America |
acidic, poor, sandy soils on dry sides ([46]) |
| Q. petraea | Sessile oak | native to Europe | prefers clay or sandy soils with humus |
| Q. robur | English oak | native to Europe, northern and western Africa |
moist and fertile well-drained soil preferred, soil pH is not critical, clay soils |
| Q. palustris | Pin oak | native to north-eastern and north-central North America |
moist, fertile acidic, well-drained soils ([46]) |
| Q. frainetto | Hungarian oak | native to south-eastern Europe | Medium to heavy acidic soils, dry and waterlogged tolerated |
Climate data
The location of the site in the southeast of Britain and its close proximity to the sea (between 15 to 30 km to the south and east respectively) results in a very stable climate. Mean temperature in winter (Dec-Feb) is typically around 4 °C with daily average minima around -6 °C during the reference period (1960-1990). Monthly mean maximum temperature in summer (Jun-Aug) is approximately 27 °C. Late ground frost can occur until June with measured grass temperatures below 0 °C. Climate data was obtained at daily resolution from the Bedgebury Pinetum meteorological record which is taken within the plantation on a cleared area. The record starts on the 1st January 1959 and runs over the complete period of investigation.
Sampling and tree-ring width measurement
Sampling took place in spring 2006. Two cores were taken (Suunto increment borers) from opposite directions on the trunk of five dominant trees, avoiding wounds and reaction wood for each species. Cores were prepared according to standard procedures given in Stokes & Smiley ([64]). Individual tree-ring width was measured using a LINTAB measuring table and the software WinTSAP (both Rinntech, Heidelberg, Germany) at 1/1000 mm precision. Cross-dating and chronology building for all respective species was carried out using the same software. Cardinal splines ([28], pp. 156) were used for indexation (trend removal) of the individual and the species specific tree-ring series.
Statistical analysis
Expressed population signal (EPS) and mean inter-series correlation (Rbar) were calculated using the dendrochronological software library in R ([16], [55]). Autocorrelation (AR) was calculated using Durbin-Watson statistics, Kruskal-Wallis one-way analysis of variance on ranks and a pairwise multiple comparison procedure (Tukey Test) were performed for the complete, raw and indexed chronologies in SAS (SAS 9.3, SAS Institute Inc.). Annual sensitivity was calculated after Douglass ([23]) as follows (eqn. 1):
where Sa is the the annual sensitivity of one chronology, x is the tree ring width, and t is the year. Mean sensitivity is calculated as follows (eqn. 2):
where Smean is the mean sensitivity of one chronology and n is the number of years of the chronology. A partitioning analysis was undertaken using annual mean, maximum and minimum temperature and precipitation sums as well as mean wind direction, mean cloud cover and mean sunshine hours (Jump, SAS Institute Inc.). Pointer years were identified for each species using the individually de-trended (exponential spline α = 0.25) chronologies, where increment of 75% of the sample trees deviated by more than one standard deviation from the mean (SAS 9.3, SAS Institute Inc.). Climate-growth correlations were calculated using the CLIMTREG software ([8], [9]). This software uses daily climate variables to calculate climate-growth correlations. Remaining autocorrelation was removed from the indexed series by autoregressive modelling. A common interval analysis was used to detect climate-growth connections. Correlations were calculated using time spans from 21 to 121 days of climate data, starting on the 1st July of the previous year to 31st October of the current year. The deviations of mean temperature and precipitation sums were calculated from the long-term average, correlating the resulting climatic values with the tree-ring index time series ([10]). To verify the results of CLIMTREG, a Pearson’s Product Moment Correlation was used. While not as detailed and based on monthly averaged data, it confirmed the general trends between species and climate on this site.
Results
Environmental conditions
Whilst the soils are typical for lowland area of SE England, they are not optimal for all Quercus species planted. While Q. frainetto prefers these heavy, acidic soils and can tolerate water-logging, Q. palustris and Q. robur would benefit from more fertile soils with better drainage. Q. petraea and especially Q. coccinea are better suited to lighter, sandy soils.
Minimum air temperatures (Fig. 2a) were higher in the period from 1991 to 2005 than in the reference period (1960 to 1990). A general increase in minimum air temperatures is evident over the course of the temperature record which becomes significant (p<0.10) in spring. Grass temperatures (Fig. 2b) decrease (p<0.10) in all but the summer months where a slight increase is observed (not significant). The largest reduction is evident in May and June (p<0.001). A decline in precipitation (Fig. 2c) over the period was significant for January, February and March (p<0.05). A slight increase was found in June, September and October. Year-to-year variation is high for all but grass temperature.
Fig. 2 - Mean temperature (a), grass temperature (b), and precipitation sums (c) for the periods 1960 to 1990 and 1991 to 2005 at the Bedgebury Pinetum.
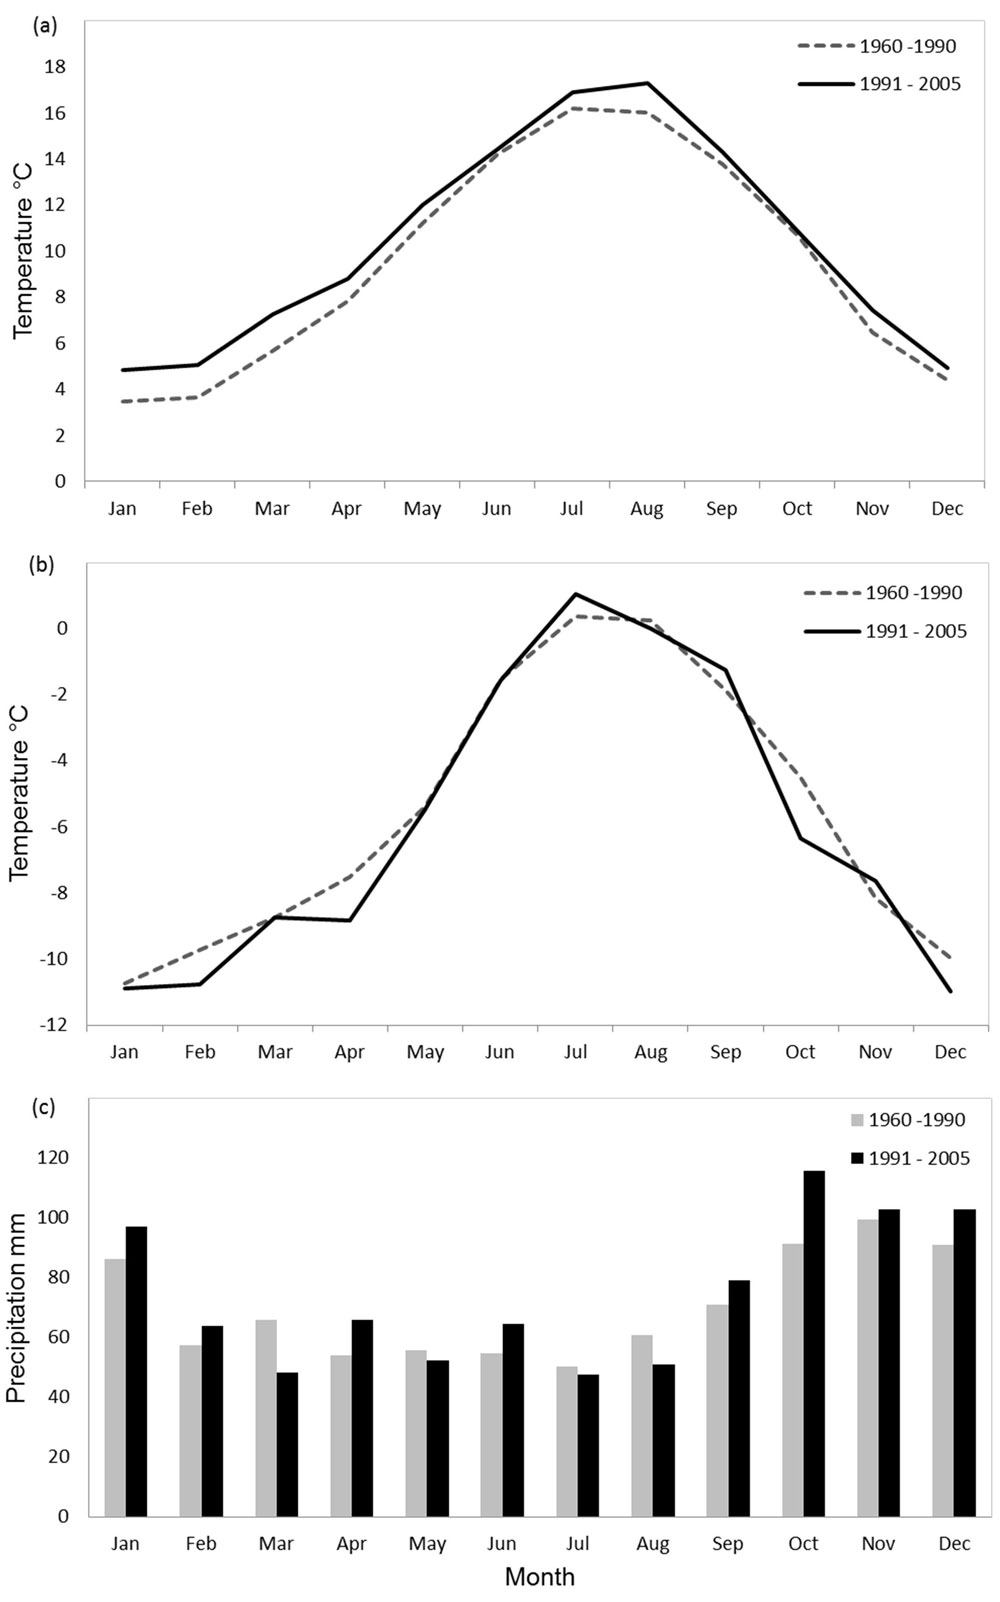
A difference in grass temperature is evident between the two periods (1961-90 and 1991-2005 - Fig. 2b) characterised by colder spring temperatures and warmer autumns in the latter period. Precipitation shows a homogeneous distribution over the years with heavy rainfall occurring in the winters of 1968, 1986, 1998 and 2003. Heavy rainfall in spring was recorded in 2002.
Tree-ring series
The mean segment length is 45 years and average growth rates vary between 2.37 mm and 2.94 mm per year with standard deviations between 0.68 mm and 0.38 mm (Tab. 2).
Tab. 2 - Statistics of tree ring data and chronologies. (MSL): mean segment length; (AGR): average growth rate (mm); (EPS): expressed population signal; (AR): auto correlation (1), Durbin Watson (2); (SNR): signal-to-noise ratio; (MSS): mean signal strength.
| Species | T no |
S no |
Raw data / single trees | Residual chronology | ||||||
|---|---|---|---|---|---|---|---|---|---|---|
| MSL | AGR | Std. dev. | AR (1) |
AR (2) |
Mean sens | EPS | SNR | |||
| Q. coccinea | 5 | 10 | 45 | 2.94 | 0.47 | 0.45* | 0.25 | 0.15 | 0.87 | 6.41 |
| Q. petraea | 5 | 10 | 45 | 2.35 | 0.38 | 0.39* | 0 | 0.12 | 0.84 | 5.4 |
| Q. robur | 5 | 10 | 45 | 2.37 | 0.43 | 0.55* | 0.39* | 0.19 | 0.8 | 4.1 |
| Q. palustris | 5 | 10 | 45 | 2.88 | 0.45 | 0.69* | 0.5* | 0.12 | 0.79 | 2.44 |
| Q. frainetto | 5 | 10 | 45 | 2.83 | 0.68 | 0.62* | 0.5* | 0.15 | 0.81 | 4.27 |
Mean signal strength (MSS) is a measure of uniformity between sampled trees of their annual growth response. MSS varies between 0.32 for Q. frainetto and 0.55 for Q. palustris. The signal-to-noise-ratio (SNR) quantifies the strength of the common signal for all trees in a chronology ([69]) and falls between 2.4 and 6.4 %. The Expressed Population Signal (EPS) for the residual chronology varies between 0.79 and 0.86. EPS provides an estimate of the explained variance of the sample chronology for the site. Autocorrelation (AR) is a measure of the dependency of annual growth rate on the growth rate observed in the previous years. All species show significant autocorrelation, with the previous year, with the previous two years in the case of Q. robur and Q. palustris (Tab. 2), while Q. frainetto and Q.palustris show a significant autocorrelation with the previous three years (not shown).
Annual growth variations and sensitivity
The annual increment patterns (Fig. 3a) show similar long-term trends for all five species, with reduced growth evident in the mid-1970s, mid-1980s, mid-1990s and towards the end of the chronologies in 2005. This is consistent with well-documented summer drought conditions in Britain in 1976, 1984, 1995 and 2003 ([38], [48], [35]). Negative pointer years (i.e., radial growth is less than one standard deviation from the mean for 75% of sample trees) for Q. coccinea occurred in 1956, 1968, 1972 (strongest negative pointer year), 1975-76, 1986, 1995, and 1999; positive pointer years were identified for 1958 (strongest positive pointer year), 1959, 1967, 1969, 1974, 1978, 1994, and 1998. Negative pointer years are evident for Q. petraea in 1989 and 1995. None of the other species show significant pointer years in the period covered by the meteorological data. However, the common reaction to the drought years of 1976 and 1995 is apparent. Recovery is quickest for Q. palustris, Q. frainetto, and Q. robur, while Q. petraea shows the longest growth depression following the drought years. Cumulative diameter increment, used here as an indication of timber volume (Fig. 3b), shows that Q. frainetto experienced suppressed growth in the early 1940s at about 10 years of age, after having the highest juvenile growth rate of the five species.
Fig. 3 - Comparison of raw annual growth series over the common period of 45-years (a) and the cumulative growth values of the five oak species (b).
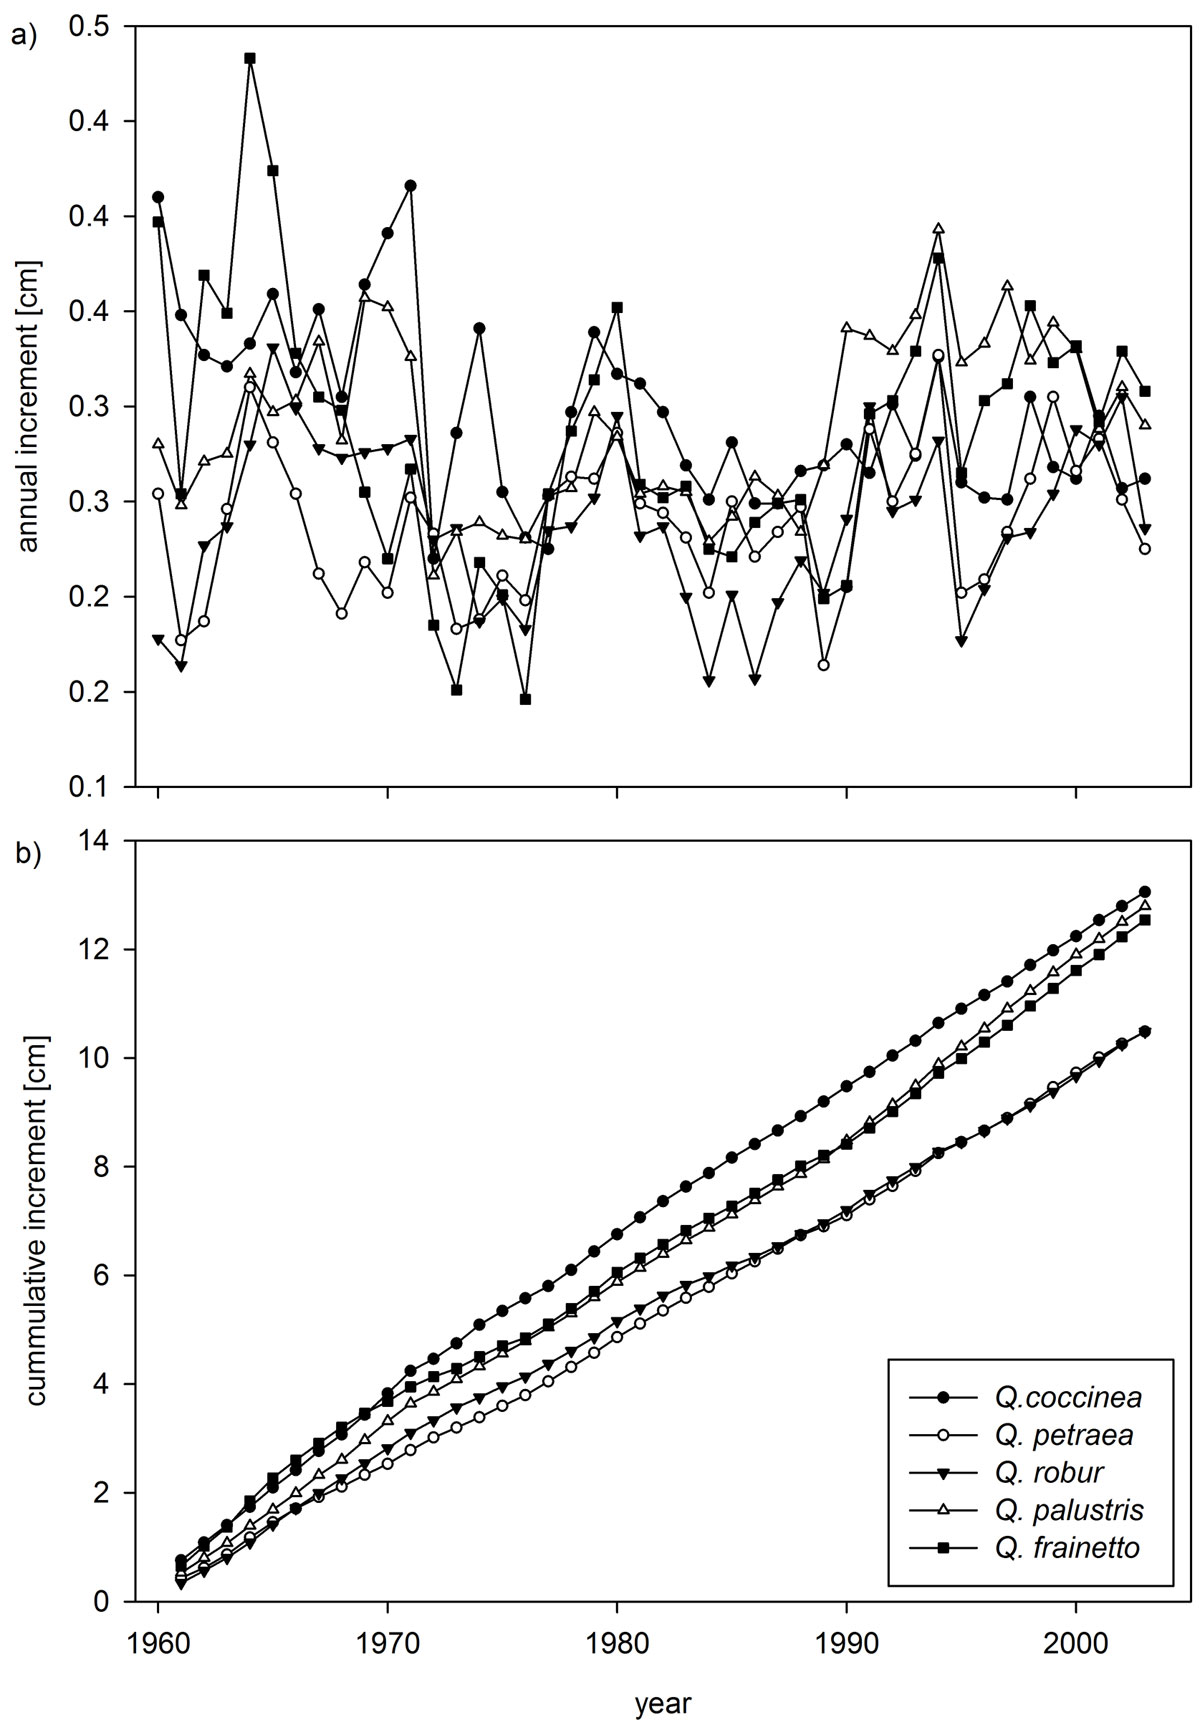
Q. coccinea demonstrates the most consistent growth rate with only a minimal set-back at about 20 years of age. The growth rate of Q. frainetto is less than that of at the beginning of the chronology. However, no period of suppressed growth is evident for Q. coccinea and its cumulative radial growth exceeds that of Q. frainetto at the time of sampling. The growth of Q. palustris is below the two previous species at until about 30 years of age when it excels Q. frainetto. The two species native to the UK, Q. robur and Q. petraea, show lower growth rates at the beginning of the chronology, but attain the same cumulative diameter growth by time of sampling. A small difference is apparent between eight and 28 years of age when the radial growth of Q. robur was greater greater than that of Q. petraea. Subsequently the growth rate of Q. robur declined compared to Q. petraea.
The Kruskal-Wallis one-way analysis of variance on ranks showed a significant (p<0.001) difference in the mean values between the species. To isolate the groups differing the most, multiple comparison was used showing significant differences (p<0.05) between the group of the American and southern European species (Q. coccinea, Q. palustris and Q. frainetto) and the two species native to the UK (and widely across Europe) Q. petraea and Q. robur.
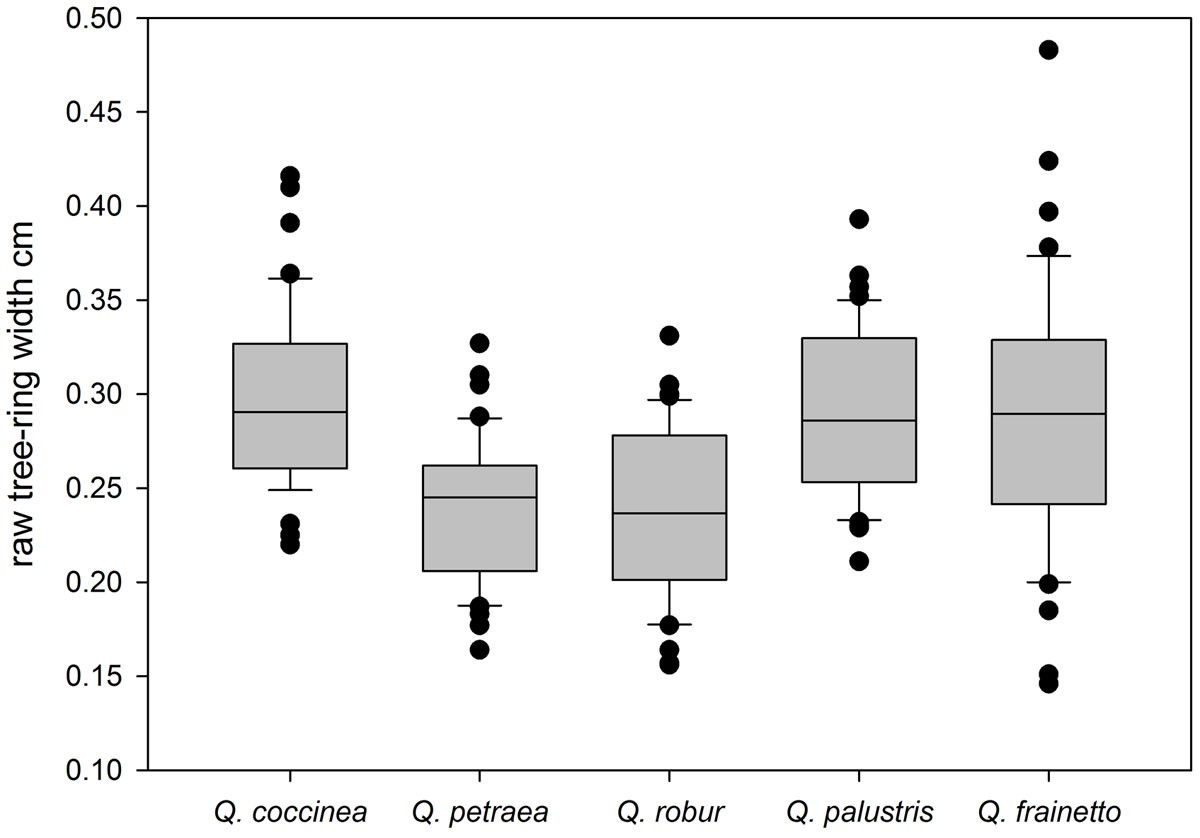
The mean growth over the common period of study shows, however, not only the highest mean growth rates for Q. coccinea but also the high variability for Q. frainetto with Q. coccinea in second place. The two species native to the UK show the least variability in growth rate combined with the smallest mean growth over the period of study (Fig. 4).
Fig. 4 - Box-whisker plots of mean growth over the common growth period with variability data for individual cores shown (black dots).
Mean sensitivity for all species lies between 0.12 and 0.19. The greatest sensitivity to environmental conditions is evident for Q. coccinea, Q. frainetto and Q. palustris (0.41 to 0.62) at the end of the 1950’s and 1970’s. Q. robur has the lowest sensitivity reaching minimum values below 0.1 in the 1960’s.
Climate-growth reactions
Partitioning of climate-growth reactions (Tab. 3) shows a clear separation between the three European oak species (Q. petraea, Q. robur, Q. frainetto) and the two North American species (Q. coccinea, Q. palustris).
Tab. 3 - Results of the partitioning analysis for main climate variables of the vegetation period showing threshold values of reaction and the expected change in tree-ring width when exceeding or undercutting the values.
| Species | Thresholds for positive responses | Thresholds for negative responses | ||||
|---|---|---|---|---|---|---|
| P sum (mm) | max T sum (°C) | min T sum (°C) | P sum (mm) | max T sum (°C) | min T sum (°C) | |
| Q. coccinea | - | - | - | - | - | < 1592 ↓ |
| Q. petraea | > 250 ↑ | < 2874 ↑ | > 1592 ↑ | < 250 ↓ | > 2874 ↓ | - |
| Q. robur | - | - | - | < 247 ↓ | > 2846 ↓ | - |
| Q. palustris | > 314 ↑ | > 2926 ↑ | - | < 314 ↓ | - | - |
| Q. frainetto | > 242 ↑ | - | - | < 242 ↓ | > 2906 ↓ | - |
Q. frainetto, Q. robur and Q. petraea all show a decline in growth below a precipitation sum for May to September of less than than 242, 247 and 250, respectively, while the strongest response of Q. coccinea is to minimum temperatures. Q. palustris shows a positive response to maximum temperatures with tree-ring growth further enhanced when May to September precipitation is above 314 mm; however, the decline in growth below the precipitation threshold is not statistically significant.
The climate-growth correlations using daily data (Fig. 5a-e) show the different responses to climate for the five species grown under the same environmental conditions.
Fig. 5 - Climate-growth correlation between temperature (top) and precipitation (bottom) for Q. coccinea (a), Q. petraea (b), Q. palustris (c), Q. robur (d), and Q. frainetto (e). Significance levels range from +1 (dark blue) to -1 (red) and are additionally provided on the right y-axis for each individual diagram. The width of the columns provides information on the length of persistence of each correlation with the dates given on the top x-axis of each diagram, beginning with the 1st June of the previous year and ending with the 31st October of the current year.
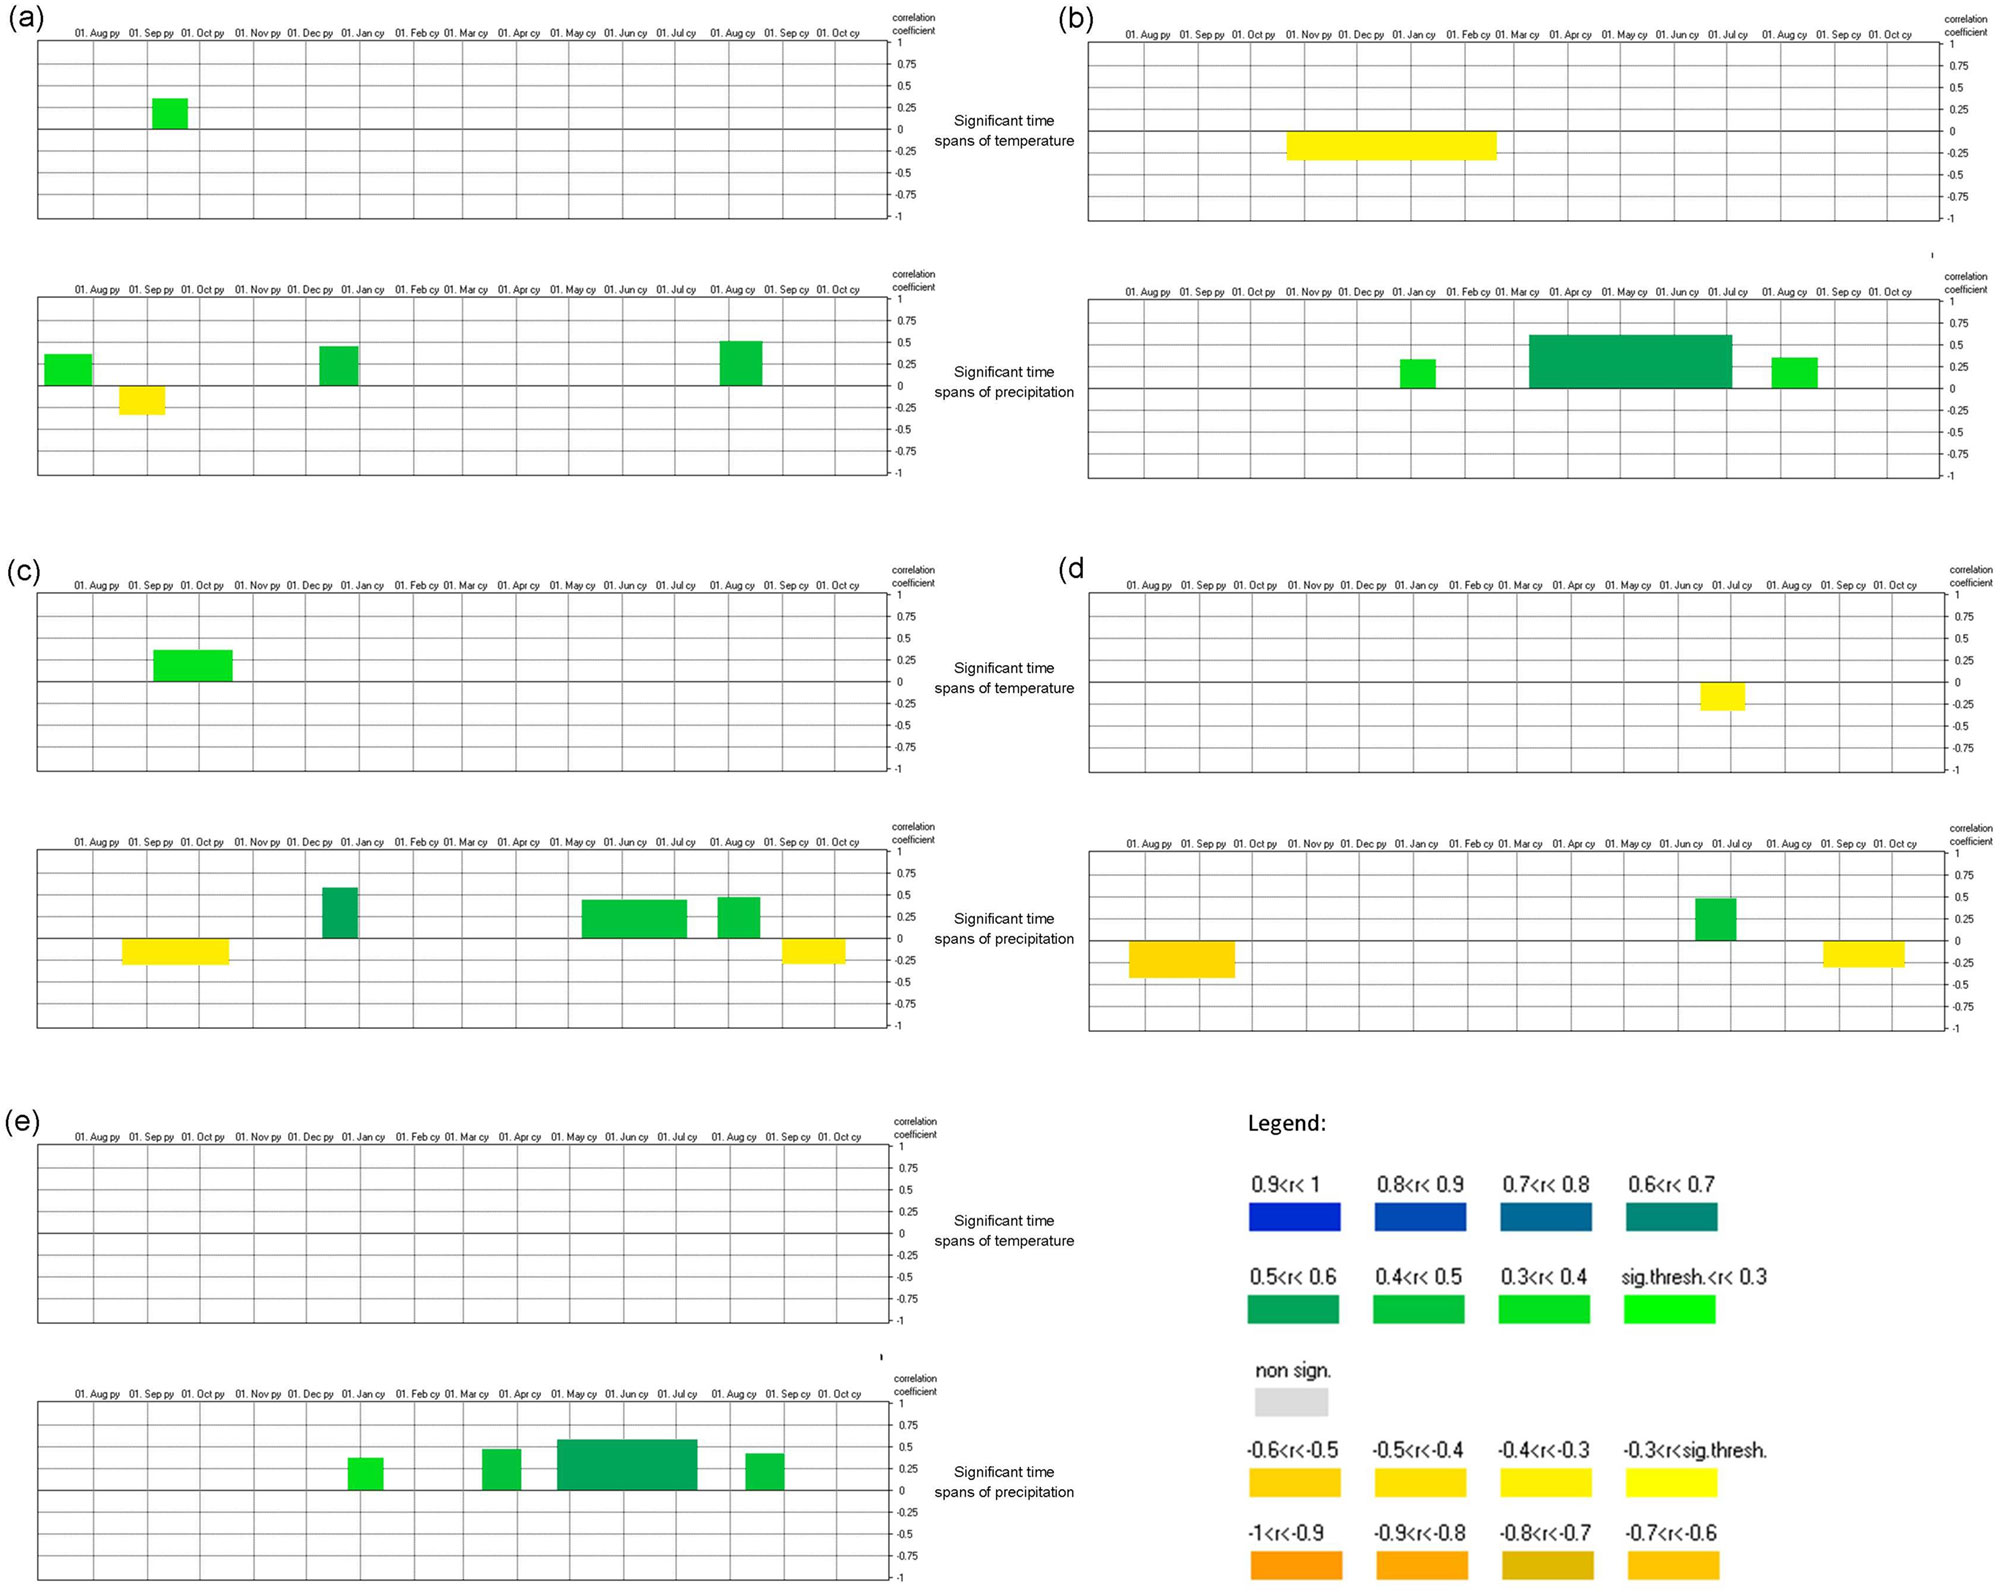
Q. coccinea responds positively to temperature during the the previous autumn. Positive correlations with precipitation are apparent for the previous year’s summer and winter periods, and with summer in the current year. Small negative correlations with precipitation are found from mid-August to mid-September of the previous year. Q. petraea responds negatively to temperature from mid-October all the way through to mid-February (i.e., growth in the current year is higher when conditions were cold in the previous early autumn). Correlations with precipitation are positive and evident at the beginning of January, from the beginning of March to early July and, again, between the end of July to mid-August. Q. palustris displays a positive correlation to temperature in the previous year’s autumn. Positive correlations to precipitation are strongest in December of the previous year. Also significant are positive responses to precipitation from May to July and, again, in August of the current year. Negative reactions to precipitation are found, albeit weaker, in the autumn of both the previous and current years. The correlation to temperature of Q. robur is weakly negative from mid-June to the second week of July. During the same period, a positive correlation with precipitation is apparent. Negative correlations with precipitation are evident in the late summer of both the current and previous years. No significant correlations with temperature are found for Q . frainetto but positive correlations with precipitation occur in mid-winter, mid-March, from the end of April until mid-July and at the end of August.
Using these climate-growth correlations for each species we calculated the explained variance in growth (Fig. 6). For each significant climate-growth correlation, the maximum, mean and minimum tree-ring width is used to produce individual box-plots. The width of the box plots corresponds to the period (in days) of the significant correlations for each species. The mean of the box-plots gives the likely variance in tree-ring width (indexed) caused by a change in climate in the respective periods. The height of the boxes indicates the 25th and 75th percentile respectively as well as absolute maxima and minima (whiskers). Presenting the results in this way allows a comparison to be made between the five species of the strength of the response to these two climate drivers of tree growth. Q. robur and Q. frainetto show the strongest variation in radial increment to temperature and precipitation. Tree-ring width of the other species varies less.
Fig. 6 - Explained variation in tree-ring width to precipitation (dark grey) and temperature (light grey) of Q. coccinea, Q. petraea, Q. palustris, Q. robur, and Q. frainetto from July previous year to November current year; scale indicating 10% variance for the top three species and 15 and 20% for the bottom two, respectively.
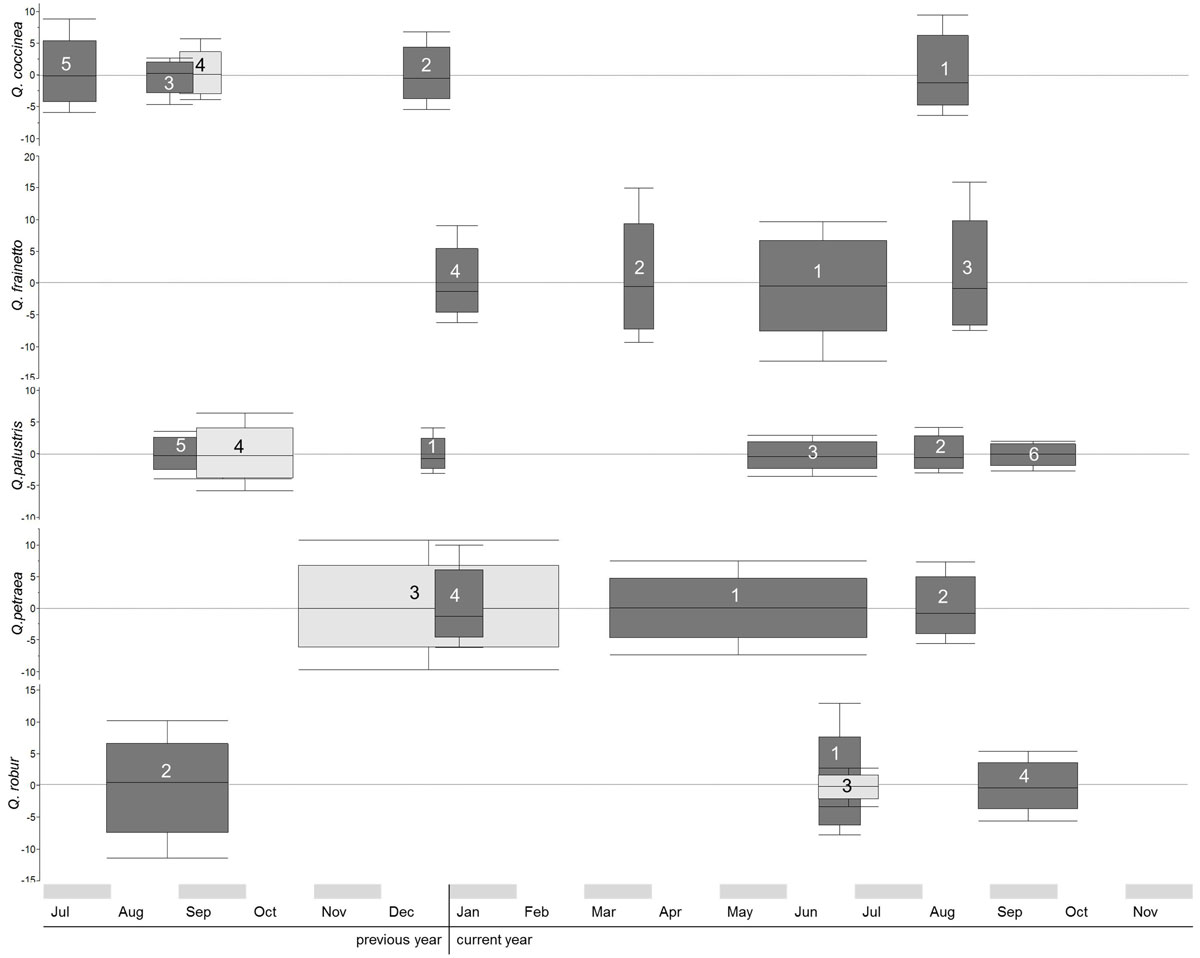
The response of Q. petraea and Q. frainetto are notably to the current year’s conditions, in contrast to the other species where precipitation of the previous year are important (Q. robur and Q. coccinea), and temperature for Q. palustris.
Discussion
Studies on climatic influences on the growth of Q. robur and Q. petraea are extensive (e.g., [4], [30], [6], [45], [44]). The same is true for several controlled experiments ([14], [37], [40]). The situation is similar for Q. coccinea ([1], [2], [39], [62]) but less so for Q. palustris ([56], [41]) in America. For Q. frainetto there is a lack of research ([18]) particularly for climate-growth analysis using tree-rings. Griggs et al. ([33]) reported that Q. petraea, Q. robur and Q. frainetto share a common climate signal at their southern distribution but were unable to distinguish the species due to the historic source of the timber. These findings could not be confirmed in this study, neither for Q. petraea, Q. robur, nor for Q. frainetto at this western edge of its distribution. The sensitivity to the two climate variables investigated in this study was low for all five species, indicating that none of them were close to the edge of their climatic envelope. The low year-to-year variability and the significantly high AR is a sign of stable growth conditions ([9]).
Increment is highest for Q. coccinea, a species known for its rapid growth ([46]) on a variety of soil types in a wide range of climates. However, it is generally found in regions with a relatively moist climate characterised by more than 760 mm annual precipitation; despite this, observations suggest that it is better suited to dry, well-drained soils. In this study its high average increment is accompanied by high inter-annual variability and the highest number of pointer years. Q. coccinea shows a strong negative reaction to summer drought but it also demonstrates the strongest positive response to temperature. This might give the species a competitive advantage under warming conditions in years not characterised by summer drought. Q. palustris on the other hand is, as its common name “Spanish swamp oak” implies, tolerant of moist soil conditions and grows primarily on poorly drained and seasonally (winter) flooded sites. In this study a positive response to summer precipitation was evident, but with low inter-annual variability in increment. However, exposure to declining summer precipitation might change this as the climate changes. Both native oak species would be likely to decline in response to climate projections of rising temperatures and declining summer precipitation; however Q. robur seems to be more able to tolerate an increase in summer temperatures and is slightly less affected by summer drought than Q. petraea, on the basis of responses to climate variables over the chronology covered by this study. The results also suggest that Q. frainetto is likely to experience the severest decline under climate change projections of hotter drier summers. This is consistent with observations from Greece where its distribution is limited by summer drought and soil nutrient availability ([63]). The relative response of the five species to climate variables outlined in the partitioning analysis (Tab. 3) is consistent the results from the climate-growth analysis. While the drought-tolerant species Q. coccinea only shows a growth decline when temperatures in the “vegetation period” are below the threshold sum of 1592 °C, none of the other species show a negative reaction to low temperatures.
The Expressed Population Signal (EPS) is a measure of the strength of the common signal within a chronology, where the threshold is set at 0.85 ([69]); however, this threshold value is not universally applied ([69], [29]). Where there is a strong common signal within a chronology (i.e., high EPS value), this is generally driven by climatic factors pointer years clearly evident. The chronologies for all five species presented in this study show consistent annual growth and high autocorrelation (AR), indicating relatively limited climatic influences on growth rates. While the low EPS values could result from the low sample size, they could also be explained by the low sensitivity to climate and the high AR. This argument is strengthened by the low SNR-values, providing further evidence of the limited effects of climate on the growth of Q. robur, Q. palustris and Q. frainetto during the period of the chronologies ([49]) on the sites for the species. Rozas ([57]) found similar low values for SNR and EPS for young Q. robur growing in Spain, while Pilcher & Baillie ([53]) report low SNR values for a modern oak chronology in Ireland. In Germany EPS-values of less than 0.84 were reported for Q. petraea and Q. robur by [30]. Even lower values have been reported for some other species, including Fagus sylvatica (0.818 - [66]) and Nothofagus (0.77 - [20]). The variability reported here is higher than that reported by Rozas ([57]), possibly due to the younger age of the oak trees sampled.
Q. petraea the slowest growing species over the course of the study was highly sensitive to climatic variables and exhibited the longest period of reduced growth following pointer years. Q. robur represents a more suitable species to plant in the UK as an adaptation measure given projections of hotter, drier summers and its ability to make a more rapid recovery following negative pointer years.
Conclusion
Analysis of growth variability of five species of oak at a southern British site has enabled a comparison of their response to climatic variation over nearly 50 years. This has provided new information on the extent of their reaction and speed of recovery to extreme climatic events, and highlighted that the growth of some species is dependent on antecedent conditions in previous years. The analysis has provided some of the vital background needed to inform current forestry policy, which is establishing appropriate adaptation measures to respond to the threats of climate change (see [54]).
Q. petraea was the slowest growing species over the course of the study, and appeared to be highly sensitive to climatic variables exhibited the longest period of reduced growth following pointer years. Q. robur therefore represents a more suitable species to plant in the UK as an adaptation measure given projections of hotter, drier summers and its more rapid recovery in growth rate following extreme climatic events. The results indicate that the planting of some species of oak, not native to the UK, offers potential as an adaptation measure, either to diversify species choice or to replace native species of oak on very dry sites. Of the three non-native species evaluated in this study, Q. palustris showed the smallest response to changes in climate variables and may therefore have some potential as an alternative species. However, the partitioning analysis indicated that reduced growth rates occurred at a lower precipitation sum than for the two native species, which may be more significant if summer droughts were more intense than those experienced during the course of this study. In terms of overall growth rates Q. coccinea is superior to the other four species investigated in this study, with no negative impacts of drought apparent. It could therefore be a suitable choice as an adaptation measure in dry areas with poor nutrient supply, particularly on sandy soils. The sensitivity of Q. frainetto to summer drought suggests that the species is unlikely to represent an appropriate alternative to native species of oak.
Apart from the evaluation of future climatic suitability presented in this study, a much wider range of factors, including timber quality, needs to be taken into account when considering whether to select alternative, non-native species as a climate change adaptation measure when planting new woodland. Non-native species of oak, particularly those from outside Europe may not support the same biodiversity as native species of oak, while they may also be susceptible to pests and diseases that are endemic to the UK, but not present in their native range. There are also a number of landscape and cultural issues to consider, as the form and appearance of both Q. palustris and Q. coccinea is very different to that of the two native species.
Acknowledgements
Two anonymous reviewers greatly improved an early version of this manuscript with their input. We are grateful to the team of the Forestry Commission at Bedgebury Pinetum and James Pitman for their support on site.
References
CrossRef | Gscholar
Gscholar
Gscholar
Gscholar
Gscholar
Online | Gscholar
Gscholar
Gscholar
Gscholar
Gscholar
Gscholar
Gscholar
Gscholar
Gscholar
Gscholar
Gscholar
Gscholar
Gscholar
Gscholar
Gscholar
Gscholar
Gscholar
Gscholar
Authors’ Info
Authors’ Affiliation
Thünen-Institute of Forest Ecosystems, Alfred-Moeller-Str. 1, D-16225 Eberswalde (Germany)
Institute for Botany and Landscape Ecology, University Greifswald, Grimmer Str. 88, D-17487 Greifswald (Germany)
Mark_SJ Broadmeadow
Formerly Forest Research, Alice Holt Lodge, Wrecclesham, GU10 4LH Farnham (UK)
Forest Services, Forestry Commission England, 620 Bristol Business Park, BS16 1EJ Bristol (UK)
Corresponding author
Paper Info
Citation
Sanders TGM, Pitman R, Broadmeadow MSJ (2014). Species-specific climate response of oaks (Quercus spp.) under identical environmental conditions. iForest 7: 61-69. - doi: 10.3832/ifor0911-007
Academic Editor
Marco Borghetti
Paper history
Received: Nov 20, 2012
Accepted: Oct 17, 2013
First online: Nov 18, 2013
Publication Date: Apr 02, 2014
Publication Time: 1.07 months
Copyright Information
© SISEF - The Italian Society of Silviculture and Forest Ecology 2014
Open Access
This article is distributed under the terms of the Creative Commons Attribution-Non Commercial 4.0 International (https://creativecommons.org/licenses/by-nc/4.0/), which permits unrestricted use, distribution, and reproduction in any medium, provided you give appropriate credit to the original author(s) and the source, provide a link to the Creative Commons license, and indicate if changes were made.

Web Metrics
Breakdown by View Type
Article Usage
Total Article Views: 60672
(from publication date up to now)
Breakdown by View Type
HTML Page Views: 48713
Abstract Page Views: 4589
PDF Downloads: 5508
Citation/Reference Downloads: 58
XML Downloads: 1804
Web Metrics
Days since publication: 4638
Overall contacts: 60672
Avg. contacts per week: 91.57
Article Citations
Article citations are based on data periodically collected from the Clarivate Web of Science web site
(last update: Jul 2026)
Total number of cites (since 2014): 29
Average cites per year: 2.07
Publication Metrics
by Dimensions ©
Articles citing this article
List of the papers citing this article based on CrossRef Cited-by.
Related Contents
iForest Similar Articles
Research Articles
Species-specific responses of wood growth to flooding and climate in floodplain forests in Central Germany
vol. 12, pp. 226-236 (online: 03 May 2019)
Review Papers
Impacts of climate change on the establishment, distribution, growth and mortality of Swiss stone pine (Pinus cembra L.)
vol. 3, pp. 82-85 (online: 15 July 2010)
Research Articles
Is Pinus pinea growth affected by climate change in western Anatolia?
vol. 18, pp. 93-101 (online: 28 April 2025)
Research Articles
Impact of climate change on radial growth of Siberian spruce and Scots pine in North-western Russia
vol. 1, pp. 13-21 (online: 28 February 2008)
Research Articles
Predicting the effect of climate change on tree species abundance and distribution at a regional scale
vol. 1, pp. 132-139 (online: 27 August 2008)
Research Articles
Influence of tree density on climate-growth relationships in a Pinus pinaster Ait. forest in the northern mountains of Sardinia (Italy)
vol. 8, pp. 456-463 (online: 19 October 2014)
Research Articles
Potential impacts of regional climate change on site productivity of Larix olgensis plantations in northeast China
vol. 8, pp. 642-651 (online: 02 March 2015)
Research Articles
Seeing, believing, acting: climate change attitudes and adaptation of Hungarian forest managers
vol. 15, pp. 509-518 (online: 14 December 2022)
Research Articles
Individual-based approach as a useful tool to disentangle the relative importance of tree age, size and inter-tree competition in dendroclimatic studies
vol. 8, pp. 187-194 (online: 21 August 2014)
Research Articles
Model-based assessment of ecological adaptations of three forest tree species growing in Italy and impact on carbon and water balance at national scale under current and future climate scenarios
vol. 5, pp. 235-246 (online: 24 October 2012)
iForest Database Search
Search By Author
Search By Keyword
Google Scholar Search
Citing Articles
Search By Author
Search By Keywords
PubMed Search
Search By Author
Search By Keyword


