
Species-specific responses of wood growth to flooding and climate in floodplain forests in Central Germany
iForest - Biogeosciences and Forestry, Volume 12, Issue 3, Pages 226-236 (2019)
doi: https://doi.org/10.3832/ifor2845-012
Published: May 03, 2019 - Copyright © 2019 SISEF
Research Articles
Abstract
With ongoing climate change, episodes of severe flooding are predicted to become more frequent despite a general trend towards increasing summer drought. We investigated how wood growth of adult trees of two species characteristic of floodplain forests in Central Germany (Fraxinus excelsior L., Quercus robur L.) and two less-typical species (Acer pseudoplatanus L., Carpinus betulus L.) responded to both maximum stream water level and climate, with a special focus on the effects of the extraordinary flood of the Saale River in June 2013 and the extreme drought in summer 1976. Tree-ring widths were measured on wood cores, and standardized ARSTAN tree-ring chronologies were produced. Using variance partitioning as well as linear mixed-effects models, we compared the effects of monthly values for maximum water level, temperature and precipitation sum on tree-ring width. Further, we calculated resistance, resilience and recovery of the tree species to the extreme events of flooding in 2013 and drought in 1976. Wood growth of all species studied, and particularly of F. excelsior, responded positively to the extraordinary flooding in June 2013. However, in the best models for the characteristic floodplain forest species (F. excelsior and Q. robur), mainly precipitation (F. excelsior) or a combination of precipitation and wood growth of the previous year (Q. robur) acted as drivers of wood growth of the current year. In contrast, growth of the less habitat-specific species (A. pseudoplatanus) mainly showed a significant response to the combination of temperature and wood growth of the previous year. C. betulus was the only species studied that benefited from the extreme drought in 1976. However, two years afterwards, only the wood growth of A. pseudoplatanus was still reduced, while F. excelsior and Q. robur fully recovered. In comparison to other regions in Central Europe, the moderate flood regime of the Saale River seems to have the potential to mitigate effects of summer drought in this region, which is one of the driest in Germany. Thus, increased flooding frequency might, to some degree, reduce drought effects brought about by climate change as well.
Keywords
Tree-ring Width, Floodplain Forest, Flooding, Drought, Dendroecology, Fraxinus excelsior, Quercus robur, Acer pseudoplatanus
Introduction
The permanent variation of the stream water level is an important site factor for plant growth in riparian forests ([44], [45]). Streamflow causes sedimentation and erosion of organic and inorganic compounds, minerals and soil, and, thus, is a source of fertilization ([20], [37]). As a consequence, riparian forests are characterized by nutrient-rich soils ([20], [5]). In contrast, flood and high streamflow are also stress factors for plants, resulting in waterlogging and physical damage ([3], [46], [11]).
Flood tolerance varies widely among plant growth forms and also among riparian forest species. Flood tolerance is associated with both morphological and physiological adaptations. Morphological adaptations, especially of trees, include hypertrophied lenticels, aerenchyma tissues and adventitious roots to increase the uptake of oxygen (for a review see [19]). Additionally, flooding tolerance depends on the developmental stage of trees and shrubs. Adult trees tolerate flooding better than saplings and seedlings ([49], [27], [22]). For instance, experimental stem flooding of four-year-old Quercus robur L. saplings inhibited earlywood vessel development in flooded stem parts ([10]). After four weeks, flooded saplings showed a significant root dieback and mean radial growth was reduced.
Flooding and water retention are causing anoxic conditions in plant roots. Under anoxic conditions, alcoholic fermentation takes place and toxic amounts of ethanol are produced in the roots ([28]). Tree species can prevent the accumulation of toxic ethanol in roots by transporting root-derived ethanol to the shoots and leaves via the transpiration stream. This phenomenon has not been reported in herbaceous species and might be a tree-specific trait involved in flooding tolerance ([28]). Bourtsoukidis et al. ([4]) confirmed in an experiment that most volatile organic compounds (for instance ethanol, methanol, acetaldehyde) increased with flooding. However, the volatile organic compound emission behaviour and photosynthetic quantum yield showed that seedlings of Quercus robur, a flood-resistant species, tolerated flooding much better than those of Prunus serotina Ehrh., a species not typical of floodplain forests. Hence, the tolerance to flooding seems to be highly species-specific ([15], [29]). Ferner et al. ([15]) showed that Q. robur maintained or increased root carbohydrate levels during flooding in order to maintain energy metabolism, while Fagus sylvatica L., a flood-sensitive species, depleted carbohydrates with negative consequences for energy-demanding processes.
The species’ responses also strongly depend on the time within the year when flooding occurs. Chhin et al. ([7]) analysed the wood growth of Pinus strobus L. along the banks of the Red Cedar River in Michigan (USA). Growth was favoured through high water levels during summer, while flooding in early winter resulted in reduced growth ([7]). Likewise, in a riparian forest of Slovenia with a sub-pannonian continental climate, Quercus robur displayed a positive relationship of tree-ring width and latewood width with the amount of summer but not winter flow ([21]).
A major difficulty in studying flooding responses is that tree growth also strongly depends on site conditions and micro- or macro-climate. Fritts ([17]) reported that the effects of many factors are often cumulative. Hence, growth responses to climate can vary with or might even be masked by the water level (or vice versa). For instance, in the study by Dudek et al. ([14]) a negative effect of June temperature on growth of Juglans nigra L. was only detected at an elevated site, but not at a site close to the river. Also Chhin et al. ([7]) found that the negative effect of flooding in winter was more pronounced in floodway compared to terrace sites, but that summer moisture stress lasted longer into later summer at terrace sites. Such interactions between flooding and climate are particularly relevant in drought-prone areas. However, in Central Europe field observations of adult tree and shrub species have been carried out mainly on the large rivers Rhine, Elbe, Danube, Oder and Rhône (see references in [19]), with a focus on the effects of flooding and much less attention to the interaction between effects of flooding and climate, especially drought. Over one third of the global land surface is predicted to experience climatic conditions without historical analogues by 2100 ([2]). In Central Europe, there is not only a general trend towards drier summer conditions but also to more frequent severe flooding events ([8]). Tumajer & Treml ([47]) showed for Quercus robur at Elbe River that wood growth of typical floodplain forest species is highly drought limited outside the floodplain. In the drought year 1976 they found the most abrupt reduction in tree-ring width of trees outside the floodplain and a significantly weaker negative response of trees within floodplain forests, because of sufficient water availability. Mikac et al. ([34]) reported that Q. robur has physiological flexibility to adapt to drought events with declining levels of groundwater in floodplain forests. In contrast, Fraxinus angustifolia Vahl was more sensitive in its response to drought in the floodplain forests in Southeastern Europe than Q. robur ([34]).
In our study we aim to disentangle the interacting effects of maximum stream water levels and climate on tree growth in floodplain forests. We chose the Saale River in the Halle region in Central Germany, which is located in a drought prone area (see Appendix 1 in Supplementary material for local references). Species-rich near-natural floodplain forests are growing on several islands in the Saale River and were given a nature protection status (see Appendix 1). We were particularly interested in the effects of the extraordinary flood of the Saale River in June 2013 and of the severe summer drought and heat in 1976 on wood growth of typical (Fraxinus excelsior L., Quercus robur) and less habitat-specific (Acer pseudoplatanus L., Carpinus betulus L.) tree species in the floodplain forest.
Following the great Rhine flood of June 1999, Hauschild & Hein ([22]) examined the mortality risk for F. excelsior and found high threshold values in flooding duration and flooding depth for this species. Younger ash with 15 cm diameter at chest height showed mortality at the earliest after 41 days of flooding. The prognoses of Hauschild & Hein ([22]) explained that the risk of mortality of ash is very low at a flooding duration under 30 days. According to the flooding tolerance classes of Glenz et al. ([19]), A. pseudoplatanus belongs to the group with the lowest flooding tolerance and suffers from flooding. The study of Kramer et al. ([27]) showed a significant increase in mortality of A. pseudoplatanus with increasing duration of the flooding. The model proposed by Hauschild & Hein ([22]) predicts for younger A. pseudoplatanus trees with a 10 cm diameter at chest height mortality after 15 days of flooding and a flooding depth of 200 cm. In the classification of Glenz et al. ([19]) C. betulus belongs to the group between A. pseudoplatanus and the two more flood-tolerant species (F. excelsior and Q. robur).
In our study, we tested the following hypotheses: (i) for all studied species, maximum monthly water level of the river has a stronger influence on wood growth than macroclimatic factors, such as monthly temperature and precipitation; (ii) for all studied species, maximum monthly water level has a negative effect on wood growth; (iii) typical floodplain tree species (F. excelsior and Q. robur) are more tolerant to extreme flooding events than less habitat-specific species (A. pseudoplatanus and C. betulus). On the contrary, typical floodplain tree species show higher sensitivity to extreme drought years.
Material and methods
Study sites
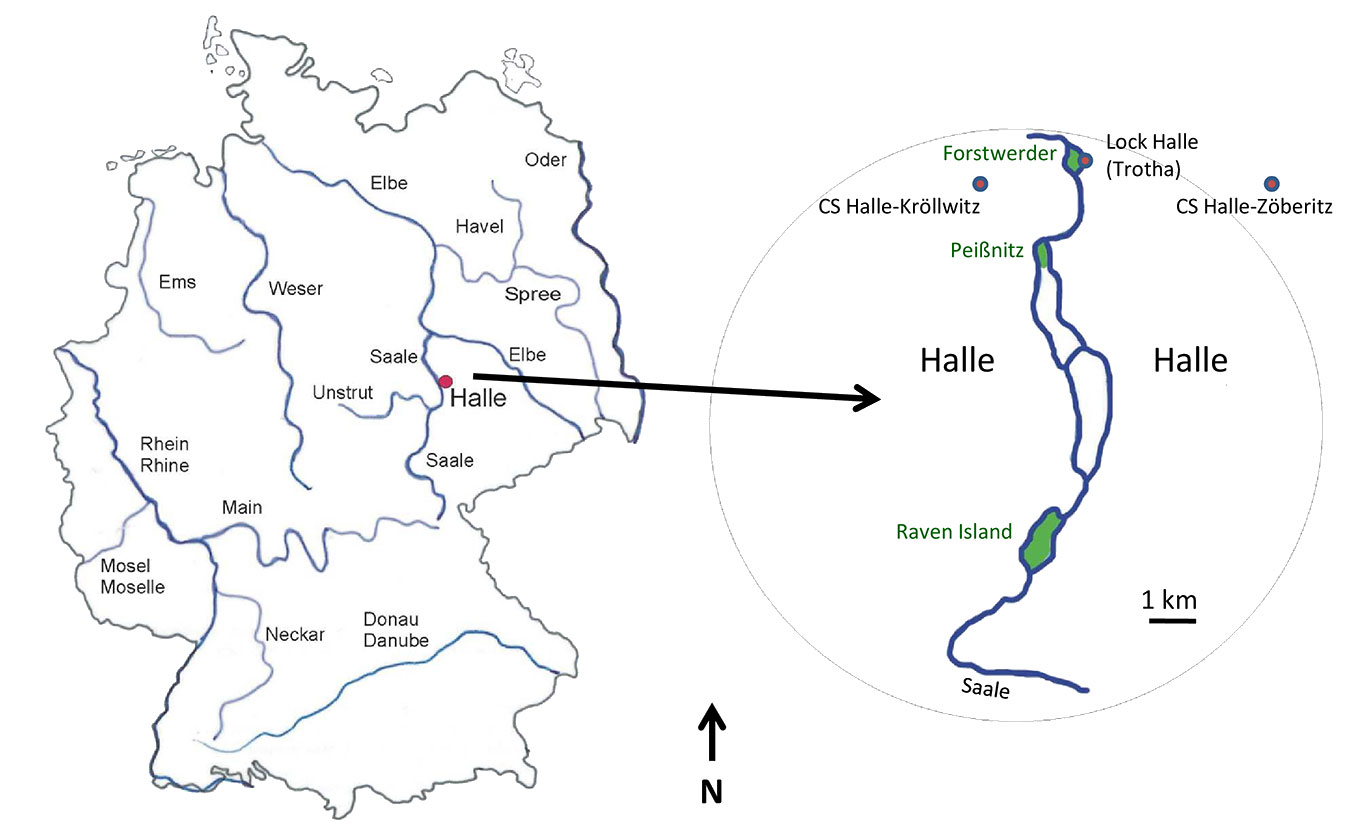
The Saale River has a catchment basin of 23.719 km² (see Appendix 1 for local references), a length of 413 km and originates in the Bavarian Fichtelgebirge (728 m a.s.l.). It flows through Upper Franconia (Bavaria), Thuringia and Saxony-Anhalt and finally joins the Elbe River close to the town Barby. The study was conducted on three islands in the area of the town of Halle (Fig. 1), Saxony-Anhalt, in Central Germany. The island Rabeninsel, “Raven Island” (51° 27′ 48″ N, 11° 56′ 38″ E), is an island of 41 ha in the Saale River in the South of Halle. Raven Island is surrounded by two river arms, the wild Saale and the navigable Saale. The island is grown with a partly near-natural floodplain forest with Ulmus minor Mill., Ulmus glabra Huds., Alnus glutinosa (L.) Gaertn., Fraxinus excelsior L., Quercus robur L., Corylus avellana L. and Prunus padus L. There is some human impact, visible in some atypical trees, e.g., Robinia pseudoacacia L., Aesculus hippocastanum L., Crataegus laevigata (Poir.) DC., Tilia cordata Mill., Carpinus betulus L. and Acer pseudoplatanus L., planted in the first part of the 20th century. In 1996, Raven Island became a nature reserve. The second study site was located on “Peißnitz Island” (51° 30′ 00″ N, 11° 56′ 48″ E), near the town centre of Halle at a distance of 5 km downstream from Raven Island (Fig. 1). In the northern area of this island, a nature reserve (11.6 ha) harbours a near-natural floodplain forest with some less-typical tree and shrub species, e.g., C. betulus L. and Acer campestre L. All samples from Peißnitz Island were taken within the nature reserve. The third Saale island “Forstwerder” (Fig. 1) is in the north of Halle, approximately 1.8 km downstream from “Peißnitz Island” (51° 30′ 55″ N, 11° 57′ 10″ E). Its area of eight hectares is enclosed from navigable Saale and a small millstream. Parallel to the millstream, the lock ship canal “Halle (Trotha)” is running (Fig. 1). A protected typical floodplain forest has developed on this island with partly more than 200 years old hardwoods of Fraxinus excelsior and Quercus robur as well as younger woods of Acer campestre L., Acer platanoides L. and Tilia cordata Mill.
Fig. 1 - Study sites. On left-hand side, the position of largest rivers in Germany and of the investigation area Halle (Saale). On right-hand side, the location of study sites Raven Island, Peißnitz Island and Forstwerder Island in Halle. The remnant floodplain forests in Halle are highlighted in green (CS: climate station).
Climate data and water levels of the Saale River
Halle and the surrounding area is characterised by a relatively continental climate in the rain shadow of the Harz Mountains with below 500 mm of mean annual precipitation sum: 472 mm for Halle-Zöberitz (in the eastern area of Halle) in the period from 1955 to 2004, and 493 mm for Halle-Kröllwitz in the period from 1851 to 2014 (see Appendix 1 in Supplementary material). From the German Meteorological Service in Offenbach we acquired mean monthly temperature and monthly precipitation sums from the climate station Halle-Kröllwitz for the period from 1851 to 2014 (mean annual temperature = 9.1 °C; Tjan = +0.2 °C; TJul = +18.6 °C). Due to the closure of this station in March of 2015, we had to take the mean monthly temperatures of the Airport Leipzig/Halle (30 km east of Halle) and the monthly sums of precipitation at the station Halle-Döllnitz for the years 2015 and 2016 (see Fig. S1 in Supplementary material for inter- and intra-annual variation of monthly mean temperature and monthly precipitation sums). The summer drought and heat wave in 1976 was most severe in wide parts of Europe, which is also reflected in an annual precipitation of 287.3 mm for our study site.
The water level data for the Saale River were available for the lock in Halle (Trotha) for the years 1960 to 2015 (provided by the Department of Water and Navigation, Magdeburg). The water level data from 1945 to 1959 were extracted from the periodical Deutsches Gewässerkundliches Jahrbuch (see Appendix 1 and Fig. S1 for inter- and intra-annual variation of monthly maximum water level). We used the maximum water depths of each month measured at the lock exit downstream (hereafter “water level”). Frequency and duration of flooding and flooding depth of the Saale River in Halle are commonly moderate. However, in June 2013, in the lowland area around the town of Halle, large parts of the riparian meadows and floodplain forests were totally flooded during two or more weeks. On 5th of June 2013 the water level of the Saale River reached 816 cm at the lock of Halle (Trotha), compared to the normal water level of around 200 cm. Since the year 1500 only three floods were higher in the entire history of the town - with a water level of >1000 cm (in March 1595, February 1799 and November 1890; see Appendix S1 in Supplementary material for local references). In the period from 1945 to 2018, the Saale River had the highest annual water level in Halle most often in spring (March, April) or in winter (January, February - Fig. 2, Fig. 3). The month of June only ranked fifth with respect to highest annual water level during the period 1945-2018.
Fig. 2 - Annual maximum water depths (in cm) of Saale River, measured downstream at the lock exit in Halle (Trotha) in the years 1945-2018. Maximum water levels in June are highlighted in green.
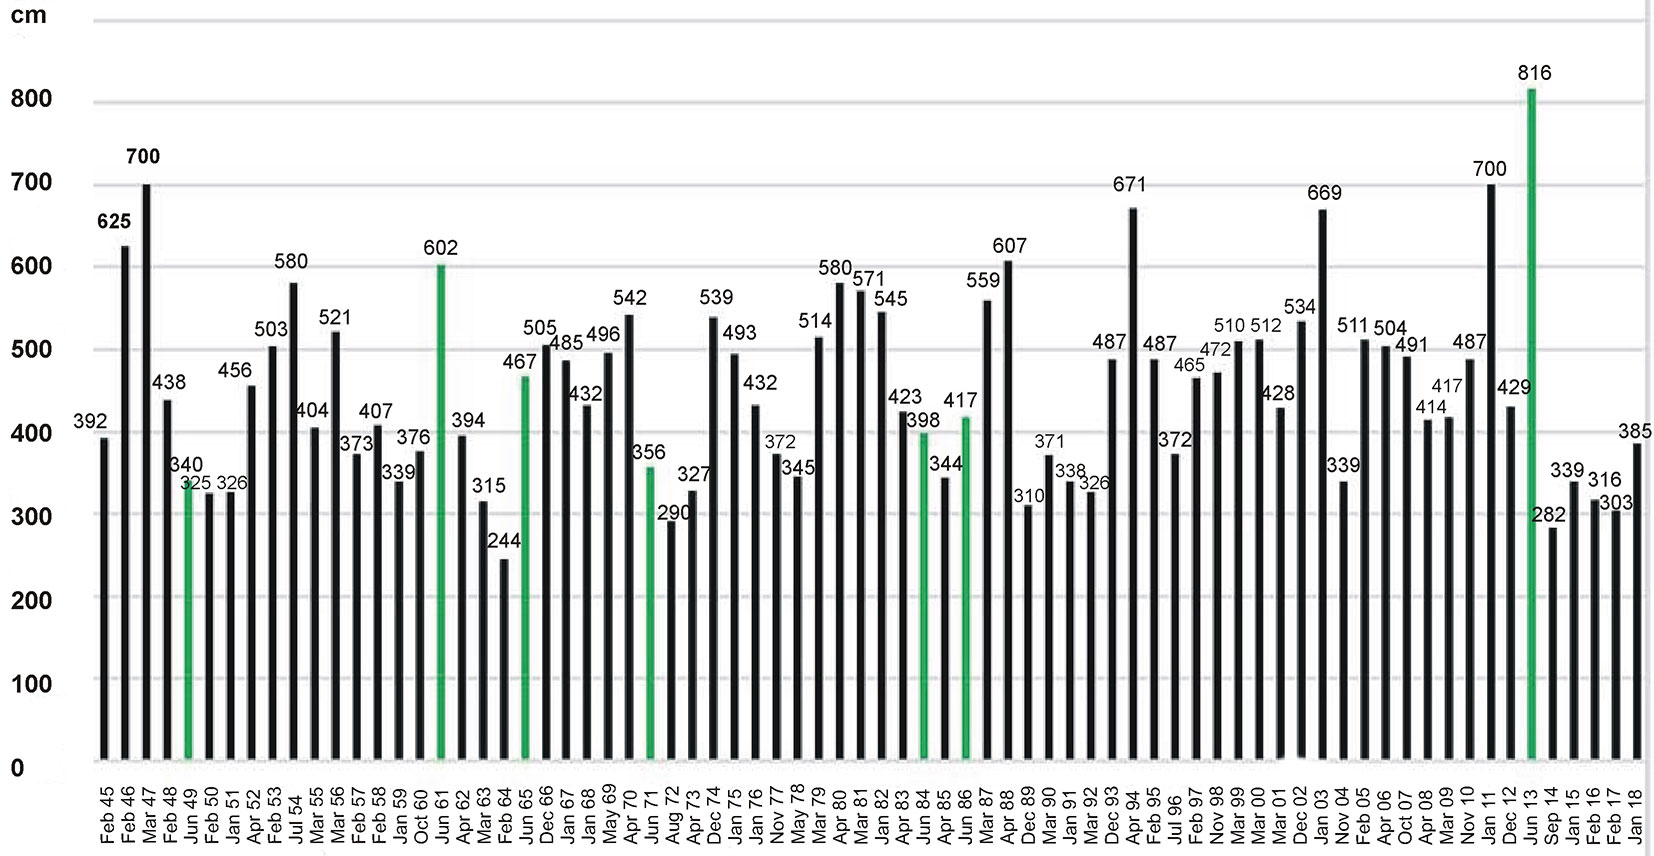
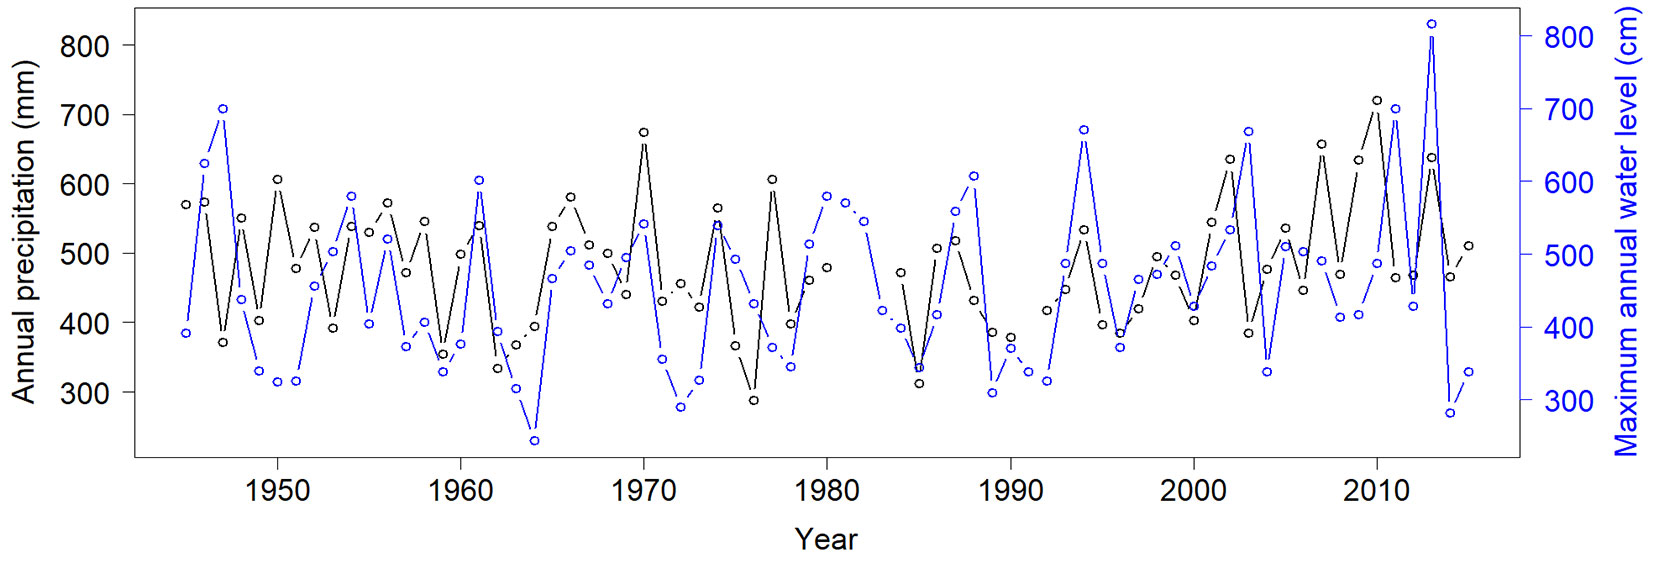
Fig. 3 - Annual precipitation (black line) and annual maximum water depths of the Saale River (blue line) measured downstream at the lock exit in Halle (Trotha) in the years 1945-2015. Both variables showed a significant positive correlation (F=6.28, p=0.015).
Studied species and field sampling
For our study, we chose two typical floodplain forest species (Fraxinus excelsior and Quercus robur, both ring-porous) and two less habitat-specific species (Acer pseudoplatanus and Carpinus betulus, both diffuse-porous). F. excelsior prefers damp and base-rich soils and is typical for floodplain forests in Central Europe (see Appendix 1). Q. robur tolerates waterlogging and is also a typical hardwood tree in the floodplain forests of Central Europe. Q. robur has a different root system than F. excelsior. Sánchez-Pérez et al. ([42]) showed that the roots of Q. robur occupied the soil to a depth of 1-4 m. In comparison to F. excelsior, the root density of Q. robur was five times higher ([42]). The highest root density of Q. robur was at a depth of 20 to 60 cm, whereas the roots of F. excelsior were mainly restricted to the surface horizon between 0 and 30 cm ([42]). Rooting more superficially may be an advantage of F. excelsior over Q. robur with regard to extreme waterlogging stress.
The less flood-tolerant A. pseudoplatanus occurs in the sub-oceanic and temperate regions in Europe and in the mountains of South and Southeast Europe. Usually, this tree species avoids habitats with waterlogging in soils and periodic flooding. C. betulus occurs in temperate Central Europe and in the more continental parts of East and Southeast Europe. The species prefers warm habitats with periodically moist soils that are rich in nutrients.
From November 2013 to November 2016, we sampled tree cores from the four study species on the three islands in the Saale River described above. However, since the two less habitat-specific species (A. pseudoplatanus and C. betulus) occurred only sporadically, they could be sampled only on Raven Island (A. pseudoplatanus) or on Raven Island and Peißnitz Island (C. betulus - Tab. 1). Most cores were taken at randomly chosen coordinates. Only in the case of C. betulus on Raven Island, the number of tree individuals was limited and trees clustered in the northern part of the island. All tree cores were taken at chest height (ca. 1.30 m), by using the increment borers Djos, Sweden (40 cm) and Suunto, Finland (30 cm). The number of tree-rings of all sampled trees for the species studied is listed in Tab. 1.
Tab. 1 - Statistics of chronologies. Species: (FE) Fraxinus excelsior; (QR) Quercus robur; (AP) Acer pseudoplatanus; (CB) Carpinus betulus. Sites: (RA) Raven Island; (PE) Peißnitz Island; (FW) Forstwerder Island. (rbar): correlation between individual series (average value); (EPS): expressed population signal (average value); (SD): standard deviation. Please note, the EPS and rbar values for Carpinus betulus were not calculated. (n.a.): not applicable; for details see Material and methods section.
| Species | Site | Time of sampling |
Number of tree-rings |
Mean number of tree-rings (± SD) |
Number of wood cores available after cross-dating |
rbar | EPS | Period for EPS and rbar |
|---|---|---|---|---|---|---|---|---|
| FE | RA | Nov 2013-Nov 2014 | 31 - 140 | 83.25 ± 33.94 | 21 out of 30 | 0.267 | 0.768 | 1960-2014 |
| PE | Nov 2015 | 39 - 165 | 98.06 ± 42.96 | 17 out of 20 | 0.371 | 0.858 | 1900-2015 | |
| FW | Nov 2016 | 28 - 134 | 58.20 ± 38.90 | 11 out of 20 | 0.370 | 0.755 | 1930-2016 | |
| QR | RA | Nov 2013-Nov 2014 | 20 - 190 | 126.49 ± 48.90 | 13 out of 30 | 0.353 | 0.773 | 1910-2015 |
| PE | Nov 2015 | 84 - 184 | 136.85 ± 41.69 | 13 out of 20 | 0.365 | 0.845 | 1920-2015 | |
| FW | Nov 2016 | 41 - 127 | 86.60 ± 36.90 | 11 out of 20 | 0.407 | 0.841 | 1950-2016 | |
| AP | RA | Feb 2016 | 29 - 69 | 41.50 ± 13.67 | 8 out of 20 | 0.433 | 0.849 | 1960-2016 |
| CB | RA | Feb 2016 | 28 - 62 | 42.20 ± 13.03 | 5 out of 20 | n.a. | n.a. | n.a. |
| PE | Feb 2016 | 42 - 86 | 65.50 ± 20.43 | 5 out of 20 | n.a. | n.a. | n.a. |
Tree-ring measurement and cross-dating
All tree cores were mounted and sanded up to grit 400 using a grinding machine. Tree-ring widths were measured up to 0.01 mm with a LINTAB 6® measuring table (Rinntech, Heidelberg, Germany), equipped with a binocular Stemi 2000® (Zeiss, Oberkochen, Germany) and connected to the program TSAP-Win® Professional v. 4.69b (Rinntech). Samples were cross-dated visually. The quality of cross-dating was checked with the software COFECHA v. 6.6 ([23]). Wood cores that could not be crossdated were excluded from the statistical analyses. Altogether, we examined 49 tree cores of F. excelsior, 37 of Q. robur, 8 of A. pseudoplatanus and 10 of C. betulus (Tab. 1). The reason for the poor cross-dating is likely to result from the large variability of the individual trees due to different micro-site conditions in floodplain forests ([48]). Additionally, there were problems with visibility of tree-ring boundaries for C. betulus and A. pseudoplatanus.
Tree-ring analysis
The data from the tree-ring widths were analysed using the program ARSTAN v. 44 ([9]). It produces chronologies from tree-ring measurement series (i.e., each core results in one series) by detrending and standardizing the series. Detrending was performed by fitting cubic smoothing splines with 50% frequency cut-off at 32 years for each series to remove biological age trends. The annual increments measured in each core were then divided by the trend curve values to produce dimensionless ring-width index curves. Autocorrelation was removed by autoregressive modelling. Chronologies were built by averaging the series using a bi-weight robust mean which gives less weight to extreme values caused by other influences ([9]). We used the ARSTAN chronology, which is the method that contains the strongest environmental signal possible ([9]). For every species we obtained one chronology per site per sampling (three sites for F. excelsior, Q. robur, two sites for C. betulus - Raven Island and Peißnitz Island - and one site for A. pseudoplatanus - Raven Island) with dimensionless tree-ring widths for all years. Wigley et al. ([51]) developed a theory to answer the question, how well a given N-series chronology estimates the population chronology, by introducing the EPS (Expressed population signal). In the best climate reconstruction based on the tree-ring width, the variance explained by climate is of order 50%. While many authors claim that EPS values above 0.85 are required for a satisfactory chronology, the original paper of Wigley et al. ([51]) mentioned this value only as an example. EPS values of e.g. 0.75 still represent chronologies which reduce the “ideal” climate correlations by only 25%. Wigley et al. ([51]) also underline that in any particular case the chosen EPS threshold will depend on the user’s subjective evaluation of accuracy needs. Since in our case both mean pairwise sample correlations as well as sample size are rather small, EPS values above 0.75 still indicate a sufficient quality of the chronology (Tab. 1). However, due to the lower inter-series correlation of tree cores for C. betulus, which as a less habitat-specific species for floodplain forests had only a scattered occurrence in the study sites, we did not calculate EPS values. The species was excluded from all analyses using the standardized values of the ARSTAN chronology, and we only used the dimensionless tree-ring width index values of the individual cores to test the third hypothesis.
Data analyses
All statistical analyses were done using R ([39]). To determine for each species the joint and exclusive amount of variation in tree-ring width explained by water level, temperature and precipitation, we subjected 36 predictor variables to variance partitioning, using the “varpart” function of the “vegan” package ([36]). The predictors were mean monthly temperatures, monthly sums of precipitation and monthly maximum water levels, averaged over the period 1945 to 2016 for F. excelsior and Q. robur, and 1960 to 2015 for A. pseudoplatanus. Time periods differed because of the different numbers of tree-rings of the species studied (Tab. 1). Since cambial activity and thus tree-ring formation finishes in autumn, we used the monthly values from the current year only for January to September and the monthly values for October to December from the previous year.
Using linear mixed-effects models (lmer function in the “lmerTest” package, [30]), we regressed standardized values of the ARSTAN chronology on each of the 36 explanatory variables (monthly values for water level, temperature and precipitation sum - see above for details), resulting in a total of 36 regressions per species. In each of the models for F. excelsior and Q. robur, site (Raven Island, Peißnitz Island and Forstwerder) was included as random effect. For A. pseudoplatanus the tree cores were all sampled at the same site, and thus, we used simple linear regressions without random effect for this species. For mixed-effects models, model statistics were taken from type III sum of squares with Satterthwaite approximation to estimate the denominator degrees of freedom.
As a second step, for each species, we used all 36 predictor variables simultaneously in a multiple regression framework to identify the most parsimonious model. Since tree-ring width of the previous year might influence tree growth in the current year, we added the ARSTAN value of the previous year. Site was again included as random factor, except for A. pseudoplatanus. We used the step function for backward elimination of non-significant variables. We further simplified the model until we found the three models with the lowest AIC (Akaike’s Information Criterion).
To quantify the tree-ring width response to episodic stress we calculated the values for resistance, recovery and resilience. As stress events we selected the extraordinary flooding in 2013 and the extraordinary drought in 1976. To define and calculate resistance, recovery and resilience we used the approach of Lloret et al. ([32]) and Pretzsch et al. ([38]). PreSTR is the mean wood growth in the two years before the stress event, STR is wood growth in the year of the stress event, and PostSTR is the mean wood growth in the two years after the stress event. Resistance = STR / PreSTR, corresponding to the ratio of mean wood growth in the drought year 1976 to mean growth during the pre-drought period (1974-1975) as well as in the flood year 2013 to the pre-flood period (2011-2012). Recovery = PostSTR / STR, corresponding in our study to the ratio of the mean post-drought wood growth (1977-1978) to mean growth during the drought year 1976, and to the ratio of mean post-flood wood growth (2014-2015) to mean wood growth during to the flood year 2013. Resilience = PostSTR / PreSTR, corresponding to the ratio between the mean wood growth after and before the stress event. For the calculations, we used the dimensionless tree-ring width index values of individual trees (i.e., each core results in one series), and thus we included also the species C. betulus. Only tree cores that covered both 1974-1978 (drought analysis) and 2011-2015 (flood analysis) were included in the analysis.
Results
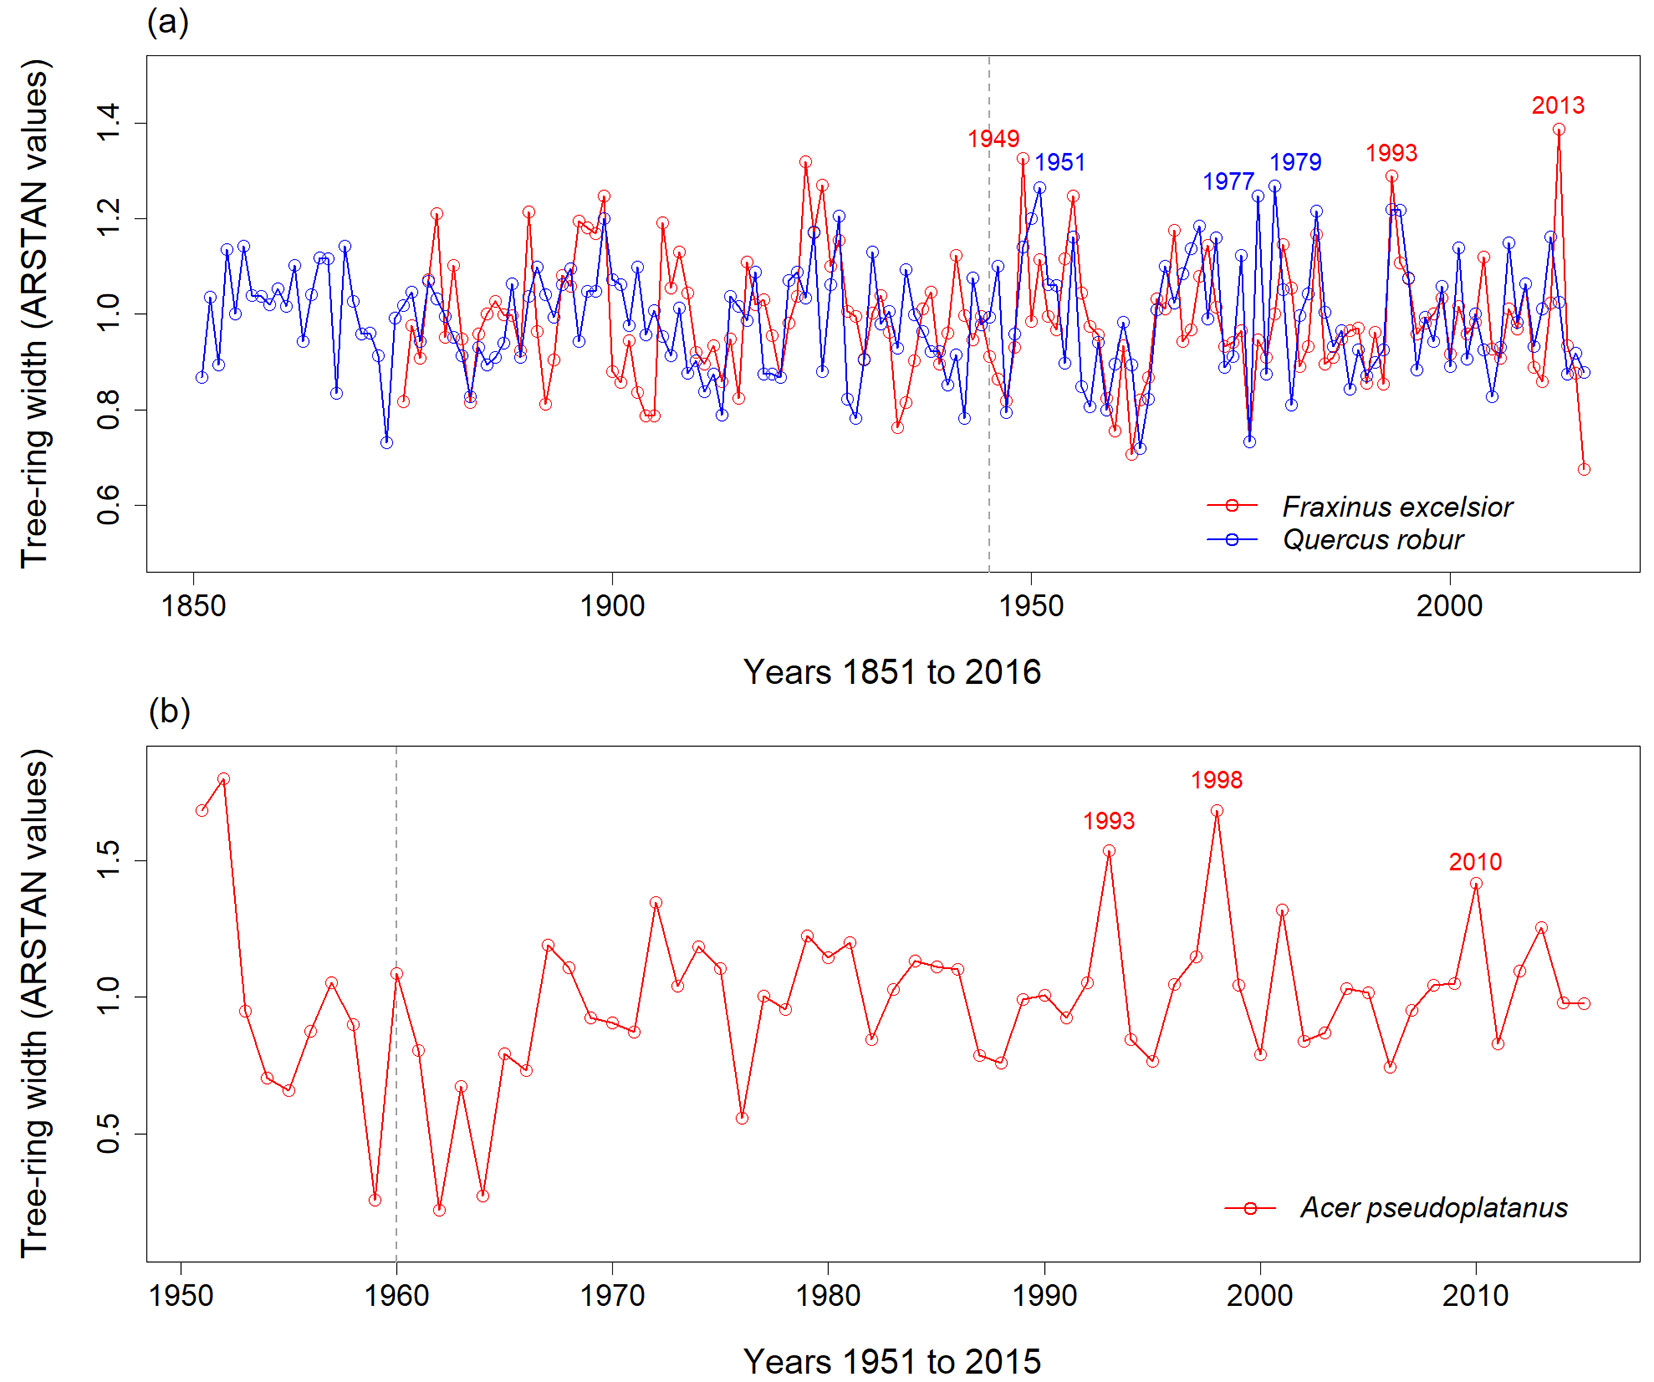
Based on the chronologies from 1945 to 2016 (F. excelsior and Q. robur) and from 1960 to 2015 (A. pseudoplatanus) the tree-ring width for the flood year 2013 ranked highest in F. excelsior, while this year ranked 6th for A. pseudoplatanus and 27th for Q. robur (Fig. 4, Tab. 2).
Fig. 4 - The chronology of relative tree-ring widths of (a) Fraxinus excelsior, Quercus robur and (b) Acer pseudoplatanus in floodplain forests at Saale River in Central Germany. Each chronology represents the mean values of chronologies from different sites. For sampling details see Tab. 1. The years with the three largest tree-ring widths are indicated for each species (see also Tab. 2). For F. excelsior and Q. robur the ranking was done for the period from 1945 to 2016 (dashed grey line), which corresponds to the years for which information about water levels were available. For A. pseudoplatanus, ranking started in the year 1960 because these trees were younger. Number of tree cores included in the chronology: 49 of F. excelsior, 37 of Q. robur and 8 of A. pseudoplatanus.
Tab. 2 - Years with the five largest relative tree-ring widths in the period from 1945 to 2016 for Fraxinus excelsior (FE) and Quercus robur (QR), and in the period from 1960 to 2015 for Acer pseudoplatanus (AP). The mean of ARSTAN values from different site chronologies for each species (see Tab. 1) were calculated for each year.
| Ranking of the ARSTAN values |
ARSTAN chronologies 1945-2016 |
ARSTAN chronology 1960-2015 | |
|---|---|---|---|
| FE | QR | AP | |
| 1. | 2013 | 1979 | 1998 |
| 2. | 1949 | 1951 | 1993 |
| 3. | 1993 | 1977 | 2010 |
| 4. | 1955 | 1993 | 1972 |
| 5. | 1967 | 1994 | 2001 |
| Place for the year 2013 | 1. | 27. | 6. |
Variance partitioning
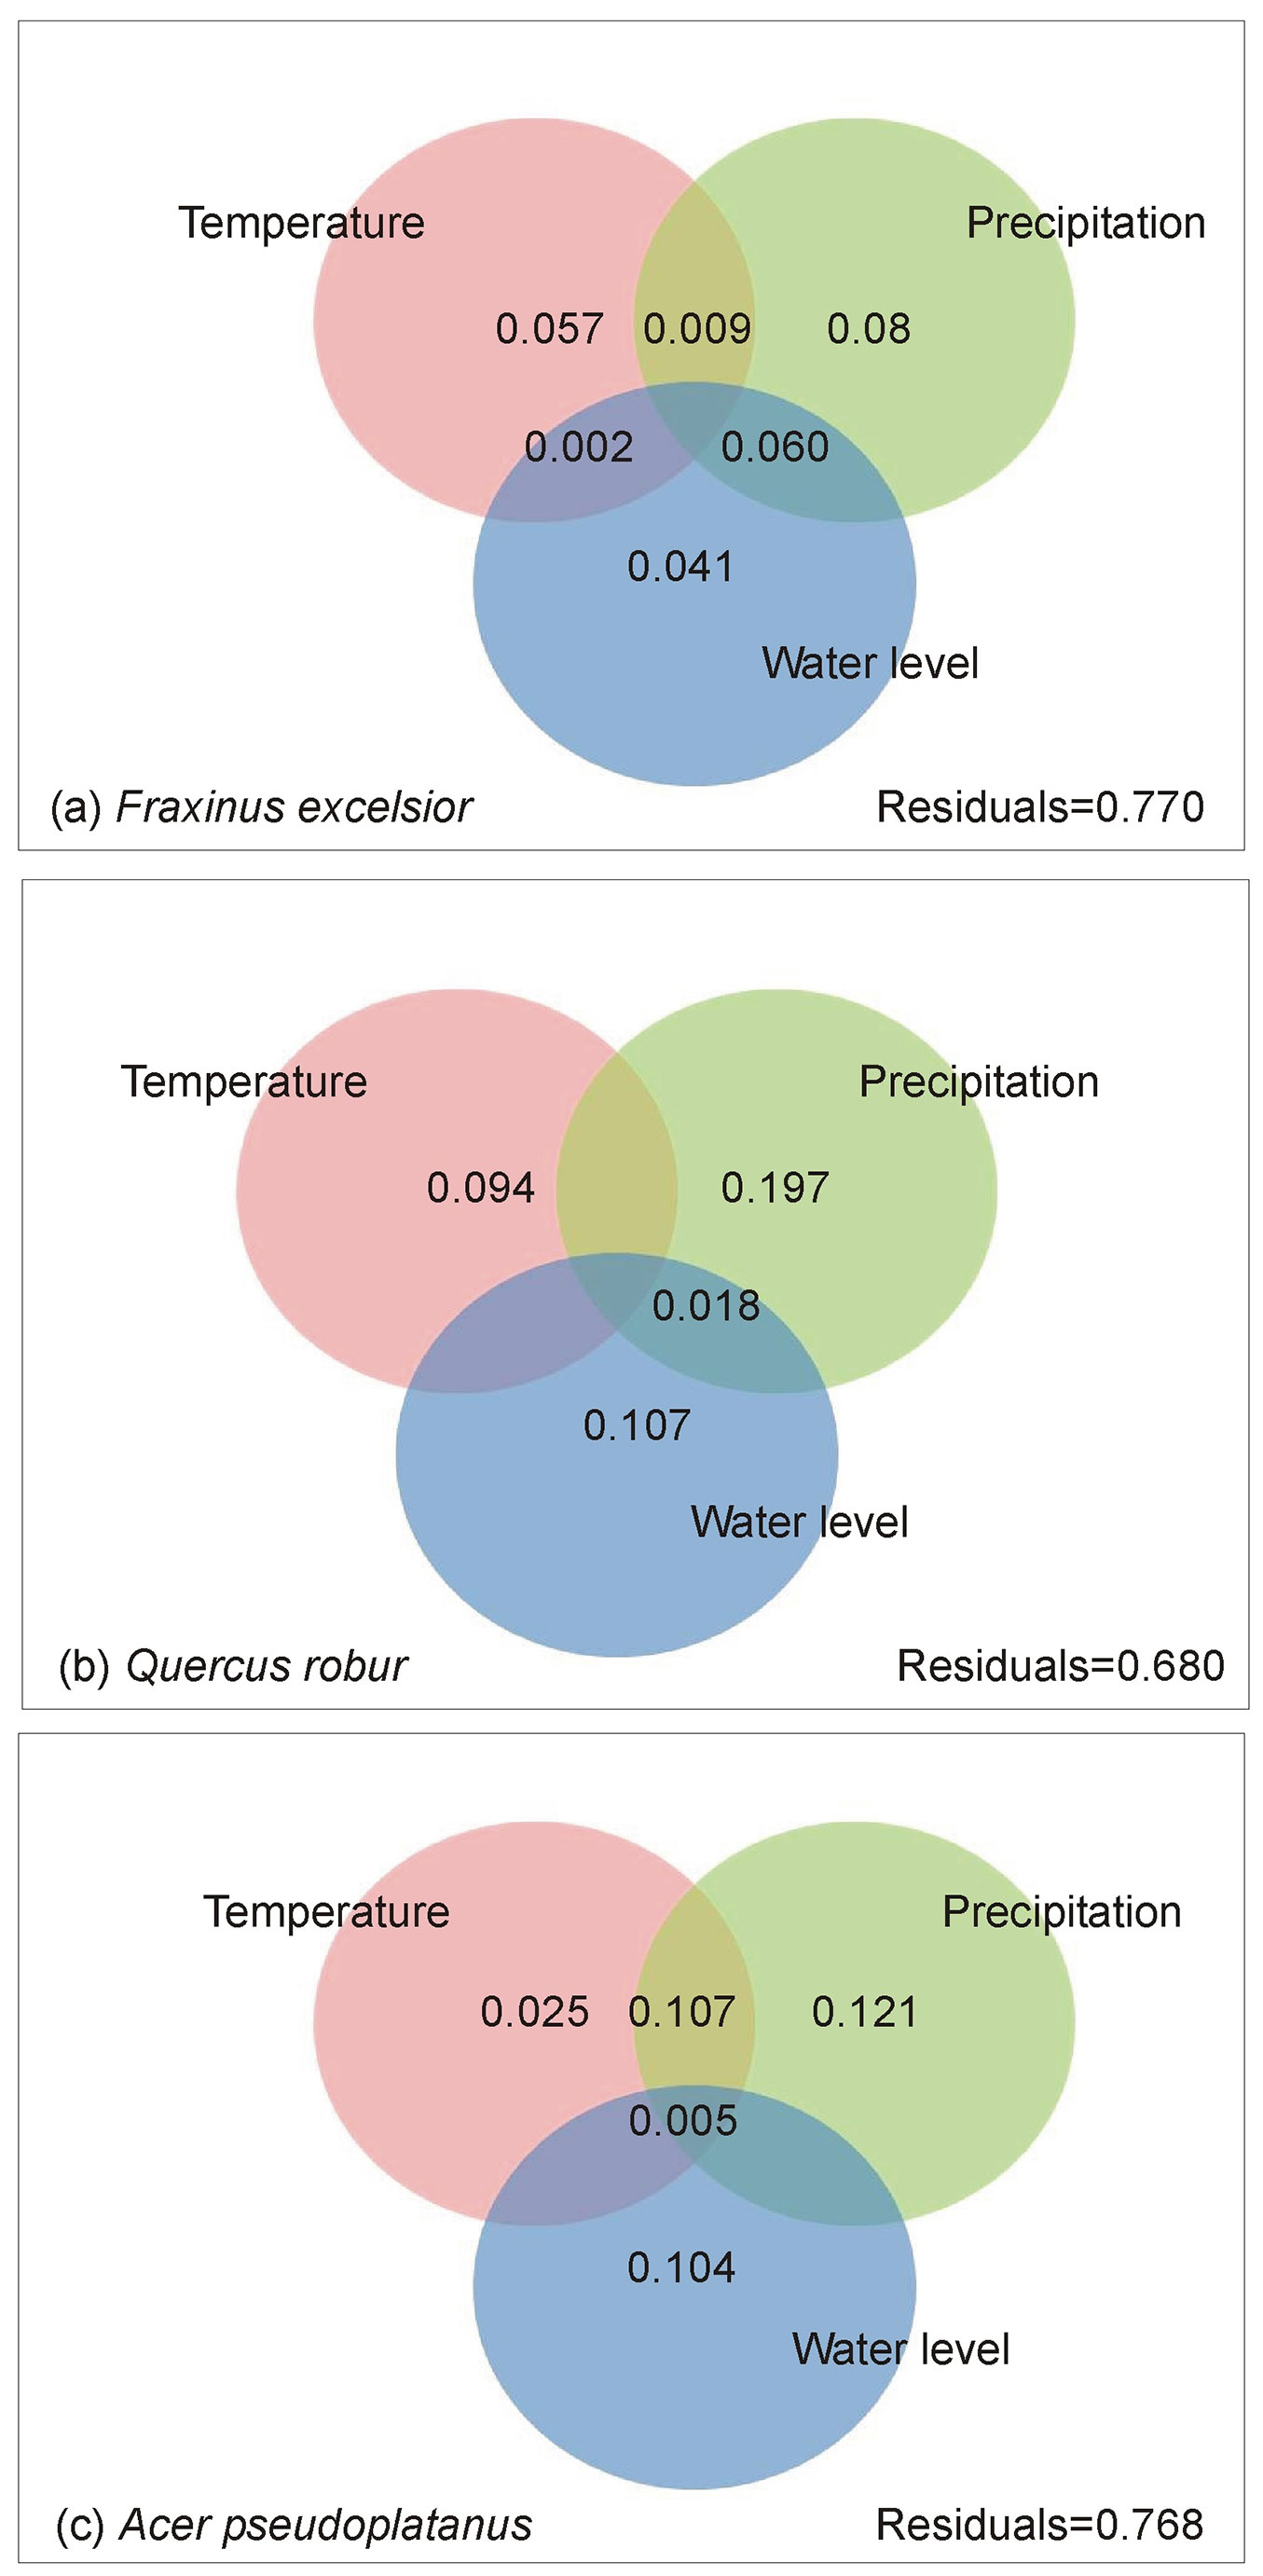
The results of variance partitioning showed differences between the typical (Q. robur, F. excelsior - Fig. 5a, Fig. 5b) and less habitat-specific (A. pseudoplatanus - Fig. 5c) tree species of the floodplain forests. In none of the study species, water level alone explained more variation than either temperature or precipitation. Although water level exclusively explained 4.1% and 10.7% of variation in tree-ring growth in the typical floodplain forest species F. excelsior and Q. robur, precipitation was a more important predictor in these two species, accounting for each 8% and 19.7% exclusively explained variation. In total, these two moisture-related variables explained 18.1% (F. excelsior) and 32.2% (Q. robur) of variation in tree-ring growth, while temperature explained only 5.7% (F. excelsior) and 9.4% (Q. robur). The results of variance partitioning of the less-typical species of floodplain forests A. pseudoplatanus had similarities with that of Q. robur. The variance explained by precipitation (12.1%) was larger than the variance explained by water level (10.4%) and both were larger than variance explained by temperature (2.5% - Fig. 5c).
Fig. 5 - Explained variance of relative tree-ring width (ARSTAN values) by mean monthly temperature, monthly sum of precipitation and monthly maximum water level of the Saale River. Numbers in overlapping areas of the circles indicate joint effects of the predictor groups. Residuals indicate the unexplained part of the variance. Due to covariation between the variables included in the variance partitioning analysis, the sum of explained variation can also be larger than one.
Linear regressions and most parsimonious models
F. excelsior and Q. robur were the species for which the values of ARSTAN chronologies of tree-ring widths showed significant correlations with all three variable groups (temperature, precipitation and water level - Tab. 3a, Tab. 3b). For A. pseudoplatanus, there was no correlation of relative tree-ring widths with monthly precipitation and water level (Tab. 3c). The significant correlations between tree-ring width and monthly mean temperatures were mostly negative, with the exception of F. excelsior and December temperature of the previous year. Contrarily, significant correlations with water level and precipitation were in all cases positive (Tab. 3).
Tab. 3 - Results of the linear mixed-effects models to explain tree-ring widths of (a) Fraxinus excelsior, (b) Quercus robur and (c) Acer pseudoplatanus with 36 different environmental variables (monthly values of mean temperature, °C; monthly sum of precipitation, mm; monthly maximum water level, cm). Please note, the values of climatic parameter and water level for October, November and December are the values of the respective previous year (Oct-1, Nov-1, Dec-1). In all models numerator degrees of freedom was 1.
| Species | Month | Temperature | Precipitation | Water level | ||||||
|---|---|---|---|---|---|---|---|---|---|---|
| Estimate | F | p | Estimate | F | p | Estimate | F | p | ||
| (a) Fraxinus excelsior | Jan | 0.00307 | 0.66 | 0.416 | 0.00041 | 0.20 | 0.655 | 0.00001 | 0.01 | 0.910 |
| Feb | 0.00110 | 0.11 | 0.735 | 0.00006 | 0.01 | 0.924 | 0.00000 | 0.00 | 0.977 | |
| Mar | -0.00944 | 3.51 | 0.062 | -0.00038 | 0.47 | 0.491 | -0.00010 | 0.91 | 0.340 | |
| Apr | -0.00356 | 0.31 | 0.581 | 0.00176 | 8.85 | 0.003 | 0.00012 | 1.44 | 0.232 | |
| May | -0.00808 | 1.09 | 0.298 | 0.00129 | 11.70 | 0.001 | 0.00051 | 15.17 | <0.001 | |
| Jun | -0.03175 | 15.65 | <0.001 | 0.00074 | 3.31 | 0.070 | 0.00041 | 18.60 | <0.001 | |
| Jul | -0.00511 | 0.60 | 0.439 | 0.00099 | 9.39 | 0.002 | 0.00037 | 8.85 | 0.003 | |
| Aug | 0.00231 | 0.08 | 0.781 | -0.00007 | 0.04 | 0.851 | 0.00045 | 7.15 | 0.008 | |
| Sep | -0.00251 | 0.13 | 0.723 | 0.00035 | 0.63 | 0.429 | 0.00034 | 3.42 | 0.066 | |
| Oct-1 | -0.01130 | 2.57 | 0.110 | -0.00006 | 0.01 | 0.906 | -0.00002 | 0.03 | 0.864 | |
| Nov-1 | 0.00302 | 0.19 | 0.661 | -0.00106 | 3.78 | 0.053 | -0.00004 | 0.07 | 0.797 | |
| Dec-1 | 0.00926 | 4.34 | 0.038 | 0.00069 | 1.06 | 0.304 | 0.00017 | 2.41 | 0.122 | |
| (b) Quercus robur | Jan | 0.00439 | 1.64 | 0.201 | 0.00186 | 5.08 | 0.025 | 0.00012 | 1.67 | 0.198 |
| Feb | 0.00470 | 2.56 | 0.111 | 0.00185 | 9.60 | 0.002 | 0.00012 | 1.43 | 0.233 | |
| Mar | 0.00004 | 0.00 | 0.993 | 0.00114 | 5.25 | 0.023 | -0.00003 | 0.12 | 0.727 | |
| Apr | 0.00013 | 0.00 | 0.983 | 0.00155 | 8.33 | 0.004 | 0.00017 | 3.43 | 0.065 | |
| May | -0.00299 | 0.18 | 0.673 | 0.00104 | 9.11 | 0.003 | 0.00032 | 7.16 | 0.008 | |
| Jun | -0.01775 | 5.69 | 0.018 | 0.00150 | 17.24 | <0.001 | 0.00023 | 6.66 | 0.010 | |
| Jul | -0.00685 | 1.30 | 0.255 | 0.00022 | 0.55 | 0.460 | 0.00002 | 0.04 | 0.834 | |
| Aug | 0.00431 | 0.33 | 0.569 | 0.00025 | 0.56 | 0.454 | 0.00040 | 6.61 | 0.011 | |
| Sep | -0.00668 | 1.08 | 0.301 | 0.00012 | 0.08 | 0.771 | 0.00056 | 11.89 | 0.001 | |
| Oct-1 | -0.00009 | 0.00 | 0.988 | 0.00018 | 0.14 | 0.704 | 0.00018 | 1.96 | 0.163 | |
| Nov-1 | 0.00027 | 0.00 | 0.966 | -0.00046 | 0.86 | 0.354 | -0.00006 | 0.20 | 0.655 | |
| Dec-1 | 0.00586 | 2.09 | 0.150 | 0.00086 | 1.98 | 0.161 | 0.00013 | 1.75 | 0.188 | |
| (c) Acer pseudoplatanus | Jan | 0.01074 | 1.84 | 0.178 | -0.00225 | 1.44 | 0.233 | -0.00033 | 2.49 | 0.117 |
| Feb | 0.00447 | 0.40 | 0.530 | -0.00220 | 1.53 | 0.218 | -0.00036 | 2.11 | 0.149 | |
| Mar | 0.01181 | 1.29 | 0.259 | 0.00182 | 2.66 | 0.106 | -0.00022 | 0.86 | 0.357 | |
| Apr | 0.00920 | 0.40 | 0.527 | -0.00123 | 0.92 | 0.338 | -0.00009 | 0.20 | 0.659 | |
| May | 0.00715 | 0.17 | 0.677 | 0.00123 | 2.34 | 0.129 | -0.00002 | 0.01 | 0.937 | |
| Jun | -0.04653 | 6.74 | 0.011 | 0.00131 | 1.86 | 0.176 | -0.00005 | 0.07 | 0.791 | |
| Jul | -0.00828 | 0.35 | 0.553 | 0.00007 | 0.01 | 0.918 | -0.00042 | 2.68 | 0.104 | |
| Aug | 0.02082 | 1.42 | 0.236 | -0.00110 | 1.75 | 0.188 | -0.00065 | 3.44 | 0.066 | |
| Sep | -0.05215 | 10.02 | 0.002 | 0.00105 | 1.27 | 0.263 | -0.00015 | 0.16 | 0.694 | |
| Oct-1 | -0.01999 | 1.75 | 0.189 | 0.00066 | 0.35 | 0.553 | 0.00012 | 0.16 | 0.688 | |
| Nov-1 | 0.01045 | 0.55 | 0.461 | -0.00176 | 2.51 | 0.116 | -0.00002 | 0.00 | 0.956 | |
| Dec-1 | 0.01237 | 1.70 | 0.194 | -0.00175 | 1.55 | 0.216 | -0.00013 | 0.32 | 0.572 | |
For F. excelsior and Q. robur, the best models (lowest AIC) were dominated by precipitation variables (May and July precipitation for F. excelsior, and March and June precipitation for Q. robur - Tab. 4). For Q. robur, but also for A. pseudoplatanus, tree-ring width of the previous year was included in the best models. For F. excelsior and A. pseudoplatanus also temperature variables were represented in the best models (June and September, respectively).
Tab. 4 - Most parsimonious models resulting from backward simplification of multiple regression models using linear mixed-effects models to explain the values of tree-ring width with 36 environmental variables (monthly values of mean temperature, monthly sum of precipitation, and monthly maximum water level) and the relative wood growth of the previous year for each species studied. Please note, the values of climatic parameter and water level for October, November and December are the values of the respective previous year. (Ars-1): relative tree-ring width of the previous year; (PR): precipitation; (T): temperature; (AIC): Akaike’s Information Criterion.
| Species | Predictor variables | Estimate | p-value | AIC |
|---|---|---|---|---|
| Fraxinus excelsior | JunT | -0.02726 | <0.001 | -141.159 |
| MayPR | 0.00150 | <0.001 | ||
| JulPR | 0.00126 | <0.001 | ||
| MayPR | 0.00166 | <0.001 | -138.873 | |
| JulPR | 0.00001 | <0.001 | ||
| MayPR | 0.00129 | <0.001 | -138.500 | |
| Quercus robur | Ars-1 | 0.20060 | <0.001 | -197.923 |
| JunPR | 0.00158 | <0.001 | ||
| Ars-1 | 0.23370 | <0.001 | -196.429 | |
| MarPR | 0.00181 | <0.001 | ||
| JunPR | 0.00182 | <0.001 | ||
| Ars-1 | 0.18387 | 0.003 | -194.893 | |
| Acer pseudoplatanus | Ars-1 | 0.24905 | 0.003 | 18.842 |
| SepT | -0.05324 | 0.001 | ||
| Ars-1 | 0.24436 | 0.004 | 21.230 | |
| SepT | -0.05226 | 0.002 | 22.747 |
Wood growth in the immediate aftermath of stress events
Tree-ring width reaction to flooding in 2013
In the short-period analysis of tree-ring widths from 2011 to 2015, the resistance value of three species studied (F. excelsior, A. pseudoplatanus and C. betulus) was higher than one. This means, that the mean index value of tree-ring width in the flood year 2013 was higher than in the two years before (Tab. 5a), indicating a positive effect of the flood 2013 on wood growth. For Q. robur, the resistance value was close to one. Thus, the mean index value of tree-ring width of Q. robur was only slightly lower in the flood year than in the two years before. F. excelsior showed the greatest increase in tree-ring width. All recovery values were smaller than 1, because tree-ring width after the flood event 2013 decreased again, reflecting the positive effect of high water levels in 2013. The resilience value was also lower than one for all studied species, which means, two years after the flood event all species studied had smaller tree-ring widths compared to the years 2011-2012 (Tab. 5a).
Tab. 5 - Calculation of resistance, recovery and resilience for (a) the flood event 2013 (FL) and (b) the dry vegetation period in 1976 (DR). Calculations were based on dimensionless tree-ring widths (index values separately for each wood core). Species: (FE) Fraxinus excelsior; (QR) Quercus robur; (AP) Acer pseudoplatanus; (CB) Carpinus betulus. Sites: (RA) Raven Island; (PE) Peißnitz Island; (FW) Forstwerder Island. Please note, because of the different timing of sampling (Tab. 1) we could not include the wood cores for the site Raven Island for all species. (Pre): 2 years before the extreme event; (Post): 2 years after the extreme event.
| Event | Species | No. of wood cores |
Site | Resistance (FL/PreFL) | Recovery (PostFL/FL) | Resilience (PostFL/PreFL) | |||
|---|---|---|---|---|---|---|---|---|---|
| Mean | SD | Mean | SD | Mean | SD | ||||
| (a) Flood event 2013 (FL) |
FE | 26 | PE+FW | 1.319 | 0.396 | 0.778 | 0.396 | 0.864 | 0.208 |
| QR | 24 | PE+FW | 0.974 | 0.203 | 0.915 | 0.274 | 0.849 | 0.134 | |
| AP | 8 | RA | 1.251 | 0.433 | 0.846 | 0.368 | 0.967 | 0.262 | |
| CB | 7 | RA+PE | 1.199 | 0.383 | 0.736 | 0.206 | 0.839 | 0.225 | |
| (b) Drought event 1976 (DR) |
FE | 26 | PE+FW | 0.788 | 0.281 | 1.363 | 0.638 | 1.041 | 0.538 |
| QR | 24 | PE+FW | 0.704 | 0.169 | 1.588 | 0.542 | 1.070 | 0.264 | |
| AP | 8 | RA | 0.542 | 0.241 | 1.698 | 0.892 | 0.805 | 0.336 | |
| CB | 7 | RA+PE | 1.173 | 0.481 | 1.068 | 0.219 | 1.178 | 0.300 | |
Tree-ring width reaction to drought stress in 1976
Each species studied responded differently to the drought year 1976. While the resistance value for C. betulus was higher than one and thus reflected an increase of mean tree-ring width from the pre-drought to the drought period, all other species showed smaller mean tree-ring width indices in the drought year (resistance value <1 - Tab. 5b). The resistance value of A. pseudoplatanus was the lowest of all species, indicating that this species reacted most sensitive to drought. However, A. pseudoplatanus also showed the greatest recovery. The resilience values, indicating the capacity to reach pre-stress wood growth, were higher than 1 for F. excelsior, Q. robur and C. betulus, and only smaller than one for A. pseudoplatanus. This means, with the exception of A. pseudoplatanus, a full recovery or even an increase in mean wood growth after the episodic drought in 1976.
Discussion
In our study of tree species occurring in the floodplain forest at the Saale River, we found that maximum water level of the river was not the dominant factor for tree growth. Instead, and contrary to our first hypothesis, temperature and precipitation, but also tree-ring width of the previous year acted as the main drivers for tree growth.
Nevertheless, we found tree growth responses to the river’s maximum water level, and taken together, water availability (represented by monthly precipitation sums and water levels) accounted for a higher amount of variation in tree-ring width compared to mean monthly temperatures. This might partly be explained by the consistent correlation between precipitation and water level of the following month (Fig. 3 - see Fig. S2 in Supplementary material for correlations between the monthly maximum water level and the precipitation sum of each previous month). Also Koprowski et al. ([26]) concluded from their study in the floodplains of Warta River (Central Poland) that site humidity is the most important driver for tree growth. Our best models for relative tree-ring growth of F. excelsior and Q. robur contained the positive effects of precipitation in May and July, and March and June, respectively. Similarly, Koprowski et al. ([26]) found that especially June precipitation had a positive effect on tree-ring width of F. excelsior. The positive correlation for Q. robur between tree-ring widths and June precipitation was found not only in floodplain forests ([6], [35]), but also in other habitats across its natural range ([40], [18], [16], [33]).
F. excelsior responded negatively to June temperature, which was also reported by Koprowski et al. ([26]), and goes in line with the general assumption that the species is only moderately tolerant to high temperatures ([31], [26]). A. pseudoplatanus responded sensitively and negatively to higher temperatures for September. This corresponds to the finding of Walentowski et al. ([50]) that under future climate change scenarios, A. pseudoplatanus will be among the first common forest species reaching their climatic threshold.
In our study, we could also show that additionally the previous years’ tree-ring width is important for wood growth of Q. robur and A. pseudoplatanus in the current year. This is likely to be associated with wood characteristics of these species; specifically, Q. robur has conspicuous wide rays in the cross section with a high amount of storage tissue and additionally apotracheal parenchyma in latewood ([43]). This allows the species to store carbohydrates at the end of a year, which favour growth in the following season.
Across our species studied, we did not find any negative response to water level, neither to the extraordinary flood in 2013 nor to monthly maximum water levels in the period of 1945-2016. On the contrary, in all cases where water level had a significant effect on tree-ring growth, this was a positive one. Moreover, the relative tree-ring width of F. excelsior had the highest value in the year 2013 and the second highest value in the year 1949, when also the maximum water level was reached in June. Also the mean growth of A. pseudoplatanus was higher in the year of flood than in the two preceding and the two following years, respectively. Q. robur showed only a minor response to the flood event in 2013 and to maximum water level in general, which goes in line with the results from Tumajer & Treml ([47]) who did not observe any direct response in wood growth and wood anatomy of Q. robur to flood events in floodplain forests of the Elbe River (Czech Republic). Thus, we must reject our second hypothesis that flooding has a negative effect on tree growth.
In accordance with our findings, Doffo et al. ([13]) did not find a negative effect of six weeks of flooding on Salix seedlings, and study plants did not reduce growth compared to control plants without flooding treatment. Also Koprowski et al. ([26]) reported positive effects of maximum river flow on the growth of F. excelsior.
Effects of flooding strongly depend on the duration of flooding, flood depth, time of flooding, frequency of flooding and the quality of floodwater ([19]). The flooding duration in the study area in June 2013 (ca. 14 days) was below the critical value of 30 days reported for instance by Dobrowolska et al. ([12]) for F. excelsior. Additionally, the month of June 2013 was relatively dry (June precipitation 47.4 mm in 2013) and mild (TJun 2013= 16.8 °C) in Halle, which supported water table evaporation. Despite being considered as species with low flooding tolerance ([19]), also C. betulus and A. pseudoplatanus responded positively to the flood in 2013. Within the limitation of the small sample size of these species, this result tends to support our assumption that flood events might counterbalance low precipitation, and thus adult flood-sensitive species in floodplain forests might not generally be threatened by a single flood event. However, according to Janik et al. ([25]), C. betulus and Acer campestre are the most rapidly expanding species in alluvial hardwood forests in Central Europe in ongoing absence of regular floods during the year. For the alluvial forests at the confluence of Morava and Dyje in Czech Republic, Janik et al. ([25]) even hypothesized that due to the increasing absence of regular floods, the resident and ecologically similar species Fraxinus angustifolia might come into direct competition with C. betulus and A. campestre.
In contrast to our expectation, we could not confirm that the typical floodplain species F. excelsior and Q. robur are more tolerant to extreme flooding events than the less habitat-specific species. Surprisingly, we found differences between the two more flood-tolerant species. The biological characteristics of F. excelsior, e.g., the degree of physiological adaptations to waterlogging stress, the shallow root system and the relatively low root density ([42], [45]) support the idea that this species is flood-tolerant and able to resist anoxia. However, Q. robur is also considered flood-tolerant but benefited much less from higher water levels in 2013. This is recognizable in the long-term chronology of wood growth. The tree-ring width of Q. robur ranked only 27th in the chronology from 1945 to 2016. These different responses might result from the fact that Q. robur has a deeper root system compared to F. excelsior ([42]). Relatively high precipitation in spring and early summer in 2013 (particularly in May with 124.6 mm) in addition to the flooding in June 2013 were probably too moist for Q. robur. Due to the long-lasting deprivation of oxygen in the rhizosphere that reduced photosynthetic rates and induced carbon starvation ([41]), the degree of flood-adaptation of Q. robur was not enough to overcome the anaerobic stress. Likewise, Mikac et al. ([34]) concluded that Q. robur and F. angustifolia in floodplain forests of the Sava River (Croatia, Southeast Europe) differ in their sensitivity to climate and hydrological parameters to which F. angustifolia was more sensitive. In our study, we could not detect a conspicuous difference in the response to drought between typical and less habitat-specific floodplain species. C. betulus individuals did not suffer from the extreme drought in 1976, while the other three species studied reduced their growth. Given the short time period included in the analysis, this result is difficult to explain despite the thermophilic character of this species. Possibly, C. betulus benefited from warm temperatures in September 1975 and its early burst of buds in spring. Together with the missing negative effect of flood events on tree growth as described above, this highlights again the potential of C. betulus to become more frequent in usually moist habitats under climate change ([25]). In the more continental part of Central Europe, C. betulus is mainly distributed in clusters at alluvial sites and prefers places with lower flooding intensity and duration, i.e., sites with higher elevation inside the riparian forests ([24]), which might at the micro-scale also be true for our study sites.
However, consistently with our results for Q. robur, F. excelsior and A. pseudoplatanus, Allen et al. ([1]) found that drought is an important controlling factor for tree growth, even in humid floodplains. In the two years after the drought in 1976 only the wood growth of A. pseudoplatanus was still reduced compared to the two years before the drought event, while F. excelsior and Q. robur fully recovered. We therefore hypothesize that stream water level and precipitation might mitigate drought effects, so that even drought-sensitive tree species (in our study the more hydrophilic species F. excelsior) did not strongly suffer from the severe drought 1976. For Q. robur, Tumajer & Treml ([47]) could show this effect of drought limitation in the comparison of tree-ring widths between trees in floodplain forests and on reference sites outside the flood area. This goes also in line with the results of an experiment conducted by Doffo et al. ([13]), who found for two Salix clones that a drought period followed by one of flooding was less stressful than the opposite situation.
Conclusion
With our study that included typical and less-typical species of floodplain forests, we contributed to a more general understanding of the effects of extreme flooding and drought events, and on the combined effects of maximum water levels and climate conditions on tree growth. The wood growth of adult individuals of hardwood species in the studied floodplain forests at the Saale River in Central Germany was mostly influenced by moisture conditions (precipitation and water levels), and to a smaller extent by temperature. However, we found no dominant impact of water levels alone. Contrary to our expectations, monthly maximum water levels as well as an extraordinary flooding in June 2013 positively affected wood growth of typical as well as of less-typical adult tree species. Overall, water level affected tree-ring widths of different tree species differently, with no obvious differences between the putative flood-tolerant and flood-sensitive species. This might be attributed to the local continental climate and the moderate flooding regime of Saale River that support the colonization and the relatively undisturbed development of less habitat-specific species in the riparian forest. Hence, a moderate flooding regime might also be related to higher soil water saturation during or after drought periods and might thus stabilize floodplain forests even under climate change. However, the predicted reduction of regular flooding throughout the year in favour of an increase of extraordinary floods could threaten especially the existence of the typical floodplain species F. excelsior in riparian forests under the relatively continental climate of this region.
Acknowledgments
We thank all students who helped with taking the tree cores, specifically Johannes Dittmann (Halle) for his studies of Acer pseudoplatanus and Carpinus betulus in his Bachelor thesis in 2016. We further thank Alison E. Martin (Reading, UK) for revising the language of this paper. We are grateful to Hans-Günter Fuhrmann (Halle) for his help in the field and Detlef Wagner (Halle) of the Lower Nature Conservation Authority of the city of Halle for the permit to sample in the nature reserves. We further thank an anonymous reviewer for valuable comments.
References
Gscholar
Gscholar
CrossRef | Gscholar
Authors’ Info
Authors’ Affiliation
Helge Bruelheide 0000-0003-3135-0356
Gunnar Seidler
Sylvia Haider 0000-0002-2966-0534
Martin Luther University Halle-Wittenberg, Institute of Biology / Geobotany and Botanical Garden, Am Kirchtor 1, 06108 Halle (Germany)
Friedrich Schiller University Jena, Institute of Ecology, Dornburger Str. 159, 07743 Jena (Germany)
Sylvia Haider 0000-0002-2966-0534
German Centre for Integrative Biodiversity Research (iDiv) Halle-Jena-Leipzig, Deutscher Platz 5e, 04103 Leipzig (Germany)
Corresponding author
Paper Info
Citation
Heklau H, Jetschke G, Bruelheide H, Seidler G, Haider S (2019). Species-specific responses of wood growth to flooding and climate in floodplain forests in Central Germany. iForest 12: 226-236. - doi: 10.3832/ifor2845-012
Academic Editor
Jesus Julio Camarero
Paper history
Received: May 08, 2018
Accepted: Mar 10, 2019
First online: May 03, 2019
Publication Date: Jun 30, 2019
Publication Time: 1.80 months
Copyright Information
© SISEF - The Italian Society of Silviculture and Forest Ecology 2019
Open Access
This article is distributed under the terms of the Creative Commons Attribution-Non Commercial 4.0 International (https://creativecommons.org/licenses/by-nc/4.0/), which permits unrestricted use, distribution, and reproduction in any medium, provided you give appropriate credit to the original author(s) and the source, provide a link to the Creative Commons license, and indicate if changes were made.

Web Metrics
Breakdown by View Type
Article Usage
Total Article Views: 48225
(from publication date up to now)
Breakdown by View Type
HTML Page Views: 38709
Abstract Page Views: 4640
PDF Downloads: 3945
Citation/Reference Downloads: 8
XML Downloads: 923
Web Metrics
Days since publication: 2609
Overall contacts: 48225
Avg. contacts per week: 129.39
Article Citations
Article citations are based on data periodically collected from the Clarivate Web of Science web site
(last update: Mar 2025)
Total number of cites (since 2019): 15
Average cites per year: 2.14
Publication Metrics
by Dimensions ©
Articles citing this article
List of the papers citing this article based on CrossRef Cited-by.
Related Contents
iForest Similar Articles
Research Articles
A resource capture efficiency index to compare differences in early growth of four tree species in northern England
vol. 10, pp. 397-405 (online: 24 March 2017)
Research Articles
Effect of cadmium (Cd) and lead (Pb) soil contamination on the development of Hymenoscyphus fraxineus on Fraxinus excelsior and F. angustifolia seedlings
vol. 16, pp. 307-313 (online: 09 November 2023)
Short Communications
Effect of intensive planting density on tree growth, wood density and fiber properties of maple (Acer velutinum Boiss.)
vol. 9, pp. 325-329 (online: 22 October 2015)
Research Articles
Earlywood vessel features in Quercus faginea: relationship between ring width and wood density at two sites in Portugal
vol. 8, pp. 866-873 (online: 27 April 2015)
Research Articles
Growth-climate relations and the enhancement of drought signals in pedunculate oak (Quercus robur L.) tree-ring chronology in Eastern Hungary
vol. 11, pp. 267-274 (online: 29 March 2018)
Research Articles
The effects of fire on Pinus sylvestris L. as determined by dendroecological analysis (Sierra de Gredos, Spain)
vol. 15, pp. 171-178 (online: 09 May 2022)
Research Articles
Individual-based approach as a useful tool to disentangle the relative importance of tree age, size and inter-tree competition in dendroclimatic studies
vol. 8, pp. 187-194 (online: 21 August 2014)
Research Articles
Climatic fluctuations trigger false ring occurrence and radial-growth variation in teak (Tectona grandis L.f.)
vol. 9, pp. 286-293 (online: 28 September 2015)
Research Articles
Effects of mixture and management on growth dynamics and responses to climate of Quercus robur L. in a restored opencast lignite mine
vol. 15, pp. 391-400 (online: 05 October 2022)
Research Articles
Effect of soil-applied lead on mineral contents and biomass in Acer cappadocicum, Fraxinus excelsior and Platycladus orientalis seedlings
vol. 10, pp. 722-728 (online: 27 July 2017)
iForest Database Search
Search By Author
Search By Keyword
Google Scholar Search
Citing Articles
Search By Author
Search By Keywords
PubMed Search
Search By Author
Search By Keyword


