
Is Pinus pinea growth affected by climate change in western Anatolia?
iForest - Biogeosciences and Forestry, Volume 18, Issue 2, Pages 93-101 (2025)
doi: https://doi.org/10.3832/ifor4641-018
Published: Apr 28, 2025 - Copyright © 2025 SISEF
Research Articles
Abstract
Pinus pinea L. (Stone pine) is an important tree species in the Mediterranean basin, particularly in coastal regions characterized by a subtropical Mediterranean climate with dry summers. It is widely cultivated for its pine nuts and aesthetic appearance. The recent decrease in pine nut production in the Aegean Region has prompted us to investigate whether the growth of stone pine trees is affected by climate change. We collected 60 cores from 30 trees at two sites representing lower and higher elevations. Using standard dendrochronological analysis, two site chronologies were constructed for the lower and higher altitudes. Linear and non-linear analyses were performed to determine the climate-growth relationship of sampled trees. Furthermore, we calculated growth resilience to drought, including resistance and recovery components. We also examined the climatic trends in the study area to enhance our understanding of the climate-growth relationship. The air temperature time series analyzed in this study has shown a recent shift towards higher average temperatures, observed around the late 1980s and early 1990s. We observed a positive correlation between residual chronologies and total precipitation from December to July. Adequate precipitation in early autumn is essential for latewood formation. The positive correlation between tree-ring growth and winter temperatures indicates that milder winters extend the vegetation period and affects the radial growth of pines. Moreover, moving correlation analysis revealed a notable shift, with the limiting effect of drought significantly increasing and the limiting impact of winter cold diminishing in the early 1990s. Generalized additive mixed model (GAMM) analysis described thresholds for additional increment based on the non-linear relationship with precipitation and weakly non-linear relationship with temperature. Stone pine trees showed relatively low resistance, high recovery, and a general low resilience to drought.
Keywords
Resilience, Stone Pine, Tree-ring Growth, Climate Change, Severe Drought
Introduction
Pinus pinea L. is an important Mediterranean species with commercial significance for its seeds and wood. Due to the historical importance of its seeds, images of its cones were widely used in stone statues during the Roman and Byzantine periods ([50]). Also, its seeds and cones were found in the Yenikapi excavation area ([32]), along with the wood used in Byzantine ships ([3]). Today, this pine species is extensively cultivated across the Mediterranean Turkish regions, covering approximately 175,378 ha ([31]).
P. pinea has a limited distribution in western and southern Turkish forest ecosystems, which are considered pine cone production areas. One of these forests is in Izmir’s Bergama-Kozak biogeographical district and plays a significant role in its economy.
The recent decline in stone pine production has prompted us to focus on this species. Previous research highlights factors such as insects (Leptoglossus occidentalis Heidemann, 1910), mining, air pollution, and climate change as potential causes of the decline in pine nut production ([33]). Calama et al. ([8]) attributed the decrease observed in Spain since 2012 to biotic factors in extremely dry years. Drought not only has adverse effects on nut production but is also an important climatic driver of tree radial growth. Dendroclimatological studies on P. pinea have investigated the tree growth-climate relationship across the Mediterranean basin ([9], [35], [29], [30]). In recent years, the species showed greater sensitivity due to the growing aridity driven by climate change in South Iberia ([30]). The positive moisture balance in the late spring-summer of the year of growth is the most critical climatic driver that enhances the radial growth of P. pinea in coastline populations in the mid-Tyrrhenian area ([35]). In Turkey, only two studies have focused on the climate’s effect on the radial growth of this species, one from northwestern sites and the other from northeastern regions. Research has shown that stone pines in Istanbul (northwest Turkey) experience growth limitations due to inadequate rainfall rather than temperature, with trees requiring precipitation, especially during April-May and July-August ([2]). In the Hatila Valley in the northeast, where precipitation is abundant, growth limitations for stone pines are linked to low rainfall and high temperatures in May-June, and the limiting effect of rainfall decreases over time ([27]). Although Martin-Benito et al. ([27]) assessed the impact of climate change by examining the variability of the climate-growth relationship over time for populations in the northeast, a substantial research gap concerning the economically significant southern populations remains. In the species’ eastern distribution, notably the Kozak Plateau, tree dieback poses a challenge to nut production, and the resilience of trees to dry conditions remains uncertain. The increasing occurrence of major disturbances due to climate change, such as forest fires, dieback, outbreaks of pests, and diseases, is anticipated to reduce tree-ring growth and tree resilience ([24]). DeSoto et al. ([14]) emphasized that low resilience to drought heightens the risk of tree mortality.
This study aims to analyze the climatic factors that influence the radial growth of P. pinea, with the goal of understanding how these factors contribute to its resilience to dry conditions in coastal west Anatolia, particularly in the Aegean Region of Turkey, within the context of climate change.
Material and methods
Study area
The study area, Kozak Plateau, is located in Bergama district of Izmir (Fig. 1 - see also Fig. S1 in Supplementary material). The highest peak in the region is Maya Tepe, reaching 1343 m a.s.l., while the stone pine trees typically grow at elevations ranging from 200 to 900 meters. Kozak Plateau has been shaped by the erosion of small hills in the area ([40]) becoming a high basin ([15]). The primary rock formations in the basin consist of magmatic rocks like granite and andesite. Sandy soils with low water content and poor water retention are found in these rock formations ([41]). The predominant soil material in a substantial portion of the central Kozak Plateau is granite. This may ignite a more effective and severe annual and perennial water deficit, especially in the soils of stone pine areas where quartz sandy regolith and soil parent material (which decomposes such as granite) are dominant.
Fig. 1 - Location of the sampling sites (yellow dots - map source: ESRI World Imagery). The red rectangle indicates the grid representing the climatic data we used in the analysis.
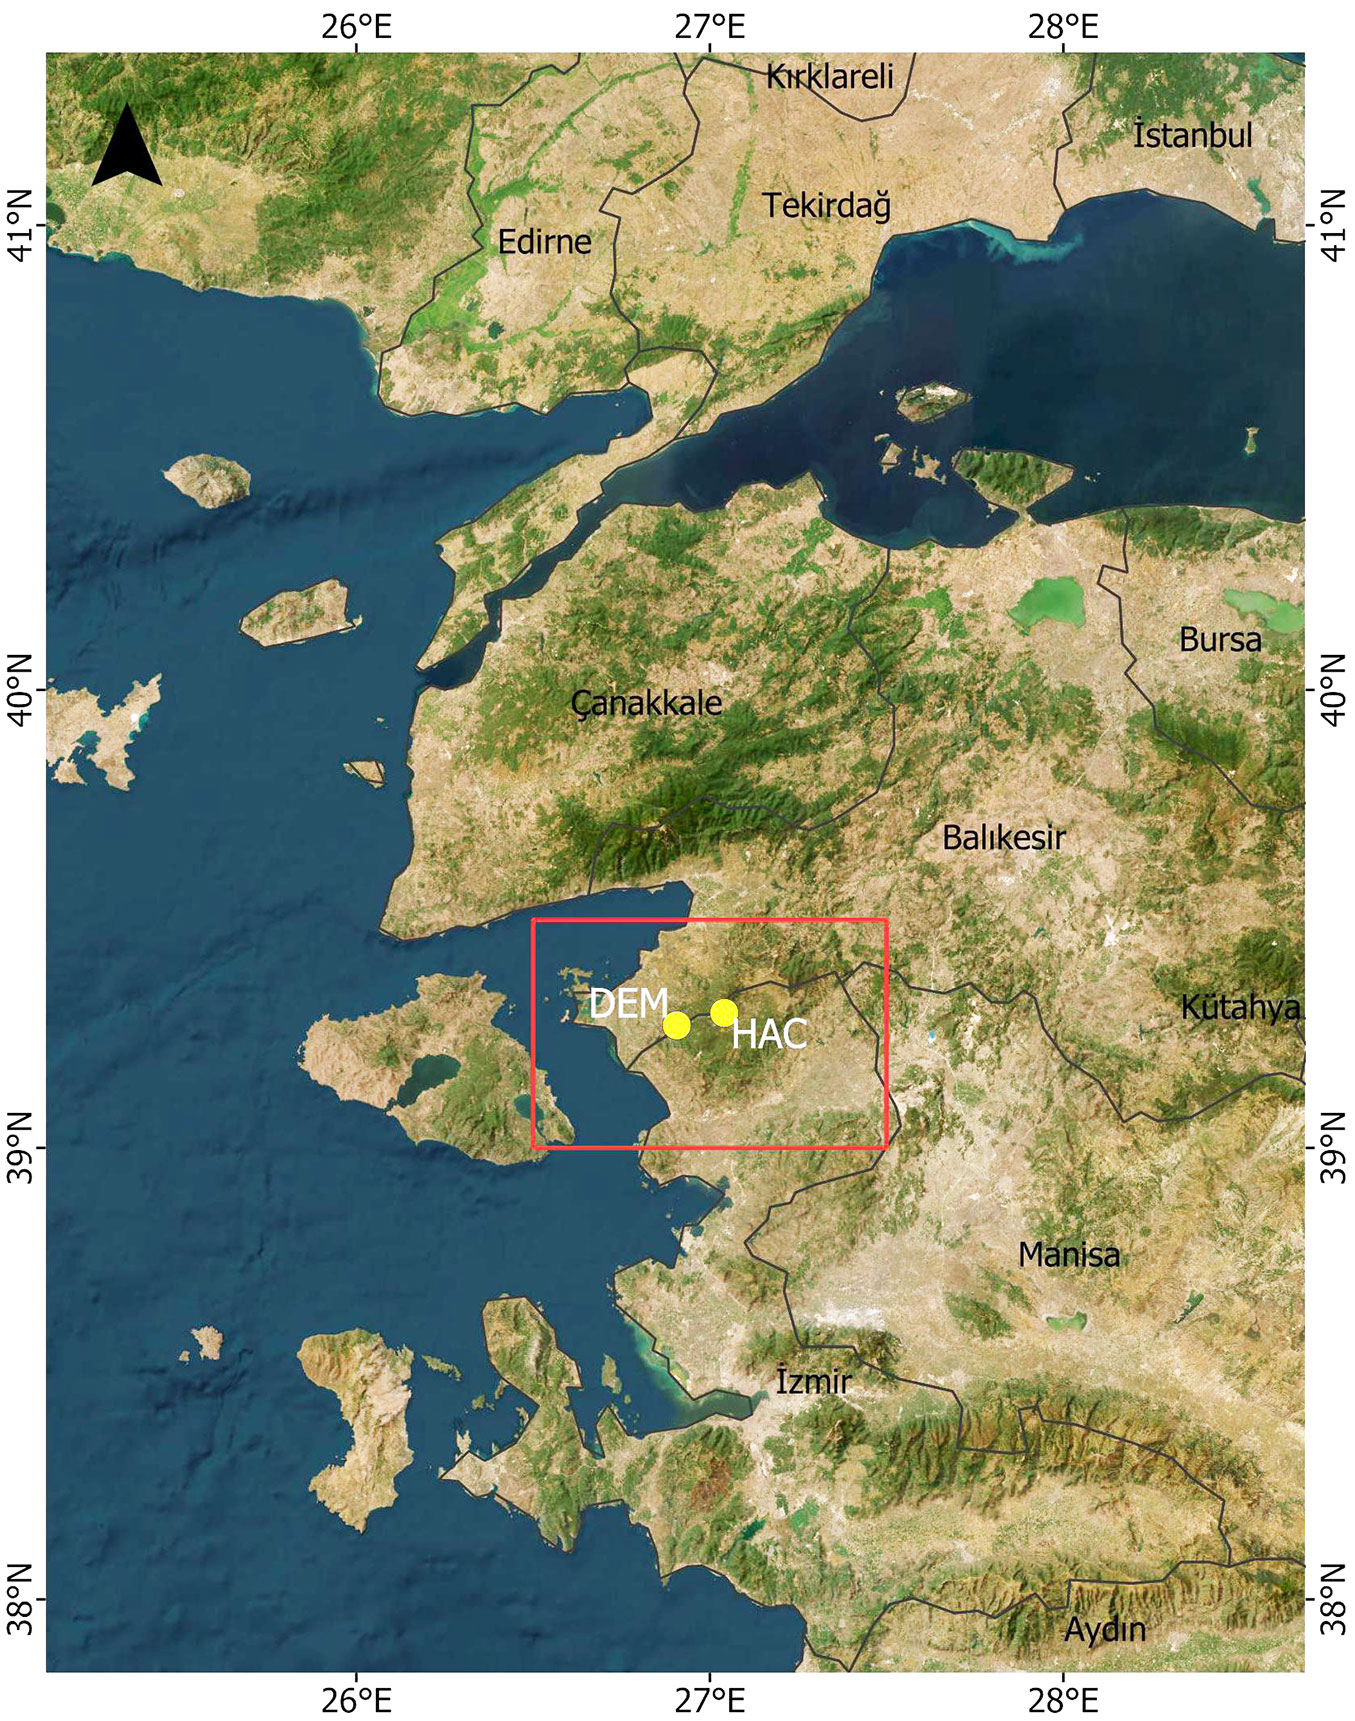
The Kozak Plateau is characterized by a semi-humid and somewhat humid-temperate highland climate within the dry-summer and wet-winter subtropical Mediterranean macro climate region of Turkey ([44], [45]). Two Automatic Weather Observation Stations (AWOS) best represent the climate of the mid-high and high parts of the Kozak Plateau, where stone pine plantations are most dense and widespread. These are the Çamavlu Village AWOS station, operated by the Turkish Meteorological Service (TMS) at an altitude of 572 m a.s.l., and the Bergama Incecikler Forest AWOS station, operated by the General Directorate of Forestry (GDF) within the forest area at 746 m. According to the climatological data recorded at these two representative AWOS stations, the annual average precipitation amount varies between 746 mm at Çamavlu Village AWOS and 954 mm at Bergama Incecikler Forest AWOS. Annual mean, average minimum, and average maximum air temperatures are between 14.2-13.5 °C, 9.6-9.2 °C, and 19.9-19.2 °C, respectively.
The precipitation profile of the Kozak Plateau differs from that of other coastal Mediterranean climate regions of Türkiye, including the coastal Aegean sub-region. This difference is due to factors like elevation, maritime effect, and the geographical position and exposure of the plateau. The higher peaks of the plateau are affected by precipitation brought by mid-latitude and Mediterranean-origin cyclonic weather systems and orographic precipitation mechanisms.
Previous analysis of meteorological data from four stations on the Kozak Plateau, utilizing the Aridity Index, Erinç’s Precipitation Intensity Index, and Thornthwaite’s water balance (for methodology, see [44], [45]), revealed that highlands above 500 m in elevation exhibit semi-humid and humid climate types (maps and figures are not included here).
High seasonality, a dominant characteristic of the Mediterranean climate, is also evident in the temperature and particularly in the precipitation seasonality, affecting the climatic water budget of the study area. For instance, according to the Thornthwaite’s water balance, a six-month water (soil moisture) deficit from May to October with about 300 to 500 mm is recorded by the stations over the Kozak plateau , while cold season months from December to April are characterized by about 350 to 550 mm water surplus.
Tree-ring sampling, measurements, and chronology building
Pine nuts have been harvested from naturally grown stone pine trees and cultivated ones in the Kozak Plateau. We sampled mature dominant trees to evaluate their relationship with climate over an extended time frame. Within the study area, two sampling sites at different altitudes were selected. We took 30 cores from 15 trees in each site and 60 cores from 30 trees in total, using Haglöf increment borers (Tab. 1).
Tab. 1 - Site characteristics of the sampled populations.
| Characteristic | Demircidere (DEM) |
Hacihamzalar (HAC) |
|---|---|---|
| Latitude N | 39° 16′ 08.83″ | 39°17′ 46.40″ |
| Longitude E | 26° 54′ 23.39″ | 27°02′ 27.45″ |
| Elevation (m a.s.l.) | 224 | 548 |
| Aspect | W | S |
| Number of trees/cores | 15/30 | 15/30 |
The increment cores were air-dried for a week and then mounted on wooden core mounts. Transversal sections of the cores were sanded to enhance the visibility of ring boundaries. Tree-ring (TR) width measurements were conducted using the LINTAB-TSAP Measurement System (RinnTech, Germany) with a precision of 0.01 mm. Additionally, we measured the width of earlywood (EW) and latewood (LW) to examine the influence of seasonal climatic conditions ([34]). The COFECHA Program was employed to validate the accuracy of the measurements ([20]). We built EW, LW, and TR chronologies of each site using the dplR package ([7]) in R ([37]). Firstly, individual measurement series were detrended using the linear or negative exponential curves to eliminate non-climatic trends ([13]). Next, autocorrelation in the detrended series was removed ([5]). Finally, pre-whitened series were combined via bi-weight robust means to generate residual site chronologies for EW, LW, and TR measurements ([12]).
Determination of climatic trends
The primary climate parameters investigated in this research included monthly mean, monthly average minimum and maximum air temperatures, and monthly total precipitation values. The Bergama Meteorology Station, which is the station closest to the sites, was not used in the analysis due to the limited period of available data (1964-2019). Instead, we employed gridded CRU TS4.02 data with 0.5° × 0.5° resolution provided by KNMI Climate Explorer (⇒ https://climexp.knmi.nl/). Climate data for the grid encompassing the sampling sites (26.5°-27.5° E, 39.0°-39.5° N) were downloaded. The period from 1930 to 2019 was chosen to maximize the inclusion of meteorological stations in Turkey.
Analysis of drought indices
In this study, we calculated 1, 3, 6, and 12-month Standardized Precipitation Evapotranspiration Index (SPEI) values to test and reveal whether the year-to-year variability of several time-scale drought events influences (or does not) annual tree growth and its year-to-year variability in general.
The multi-scalar drought index known as the SPEI, developed by Vicente-Serrano et al. ([47]) and Beguería et al. ([4]), meets the criteria for an effective drought index. Its multi-scalar nature allows it to be utilized across various scientific disciplines for the detection, monitoring, and analysis of drought events ([46]). Similar to the Self-Calibrated Palmer Drought Severity Index (sc-PDSI) and the Standardized Precipitation Index (SPI), the SPEI can measure drought severity according to its intensity and duration, along with the onset and end of drought episodes. One significant advantage of the Standardized Precipitation-Evapotranspiration Index (SPEI) compared to other drought indices is its incorporation of potential evapotranspiration (PET) in assessing drought severity. Additionally, its multi-scalar nature allows for the identification of various types of droughts and their impacts, particularly in the context of a warming climate. Shortly, the SPEI identifies the severe droughts associated with a marked temperature increase in a region or globally by considering the role of increased temperatures in reinforcing drought conditions ([46]). Moreover, SPEI provides a stronger correlation with radial growth than SPI ([34]).
We used the SPEI R library to calculate the SPEI series through the SPEI Calculator software created by Beguería et al. ([4]).
Climatic time-series analysis
The non-parametric Mann-Kendall (M-K) rank correlation test u(t) was used to detect any long-term non-linear trend in the series of climatological observations and to test whether these trends are statistically significant. The methodologic details of the M-K test can be found in Sneyers ([39]) and Türkes et al. ([43]). The M-K u(t) is a test statistic showing the magnitude and direction of the trend in a series. When the value of u(t) is significant at the selected level of significance (e.g., 0.05, 0.01, etc.), it can be determined whether it is a decreasing (downward) or an increasing (upward) trend depending on whether on u(t) > 0 or u(t) < 0. Here, 0.10, 0.05, 0.01, and 0.001 levels of significance were assessed. Using a two-tailed test of the normal distribution, “the null hypothesis of the absence of any monotonic trend in the climatic time series” is rejected for large values of u(t).
The least-squares linear regression (LSLR) equations were computed to detect possible long-term linear trends in the series, with the climatological values as the dependent variable and time as the independent variable. The statistical significance of each estimated β coefficient (slope) was tested using the Student’s t-test with n - 2 degrees of freedom. With the use of a two-tailed test of the Student’s t-distribution, “the null hypothesis of the absence of any linear trend in the climatic time-series” is rejected based on large t-test values ([43]).
In addition to the non-parametric and parametric statistical tests mentioned above, the magnitude of climatic trends was evaluated by a simple non-parametric technique of the Sen’s Slope Estimation developed by Sen ([38]). Sen’s estimator of slope (Q) is advantageous over the regression slope because it is less affected by data errors and outliers. The Sen’s slope is estimated as the median of all pairwise slopes between each pair of points in the data set. In the study, Sen’s estimator Q for the true slope of the linear trend was calculated, revealing air temperature change per year (°C year-1) or a hundred years (°C 100 years-1). Q > 0 indicates an increasing trend in a time series, while Q < 0 indicates a decreasing trend over time.
A nine-point Gaussian filter was used as a lowpass filter to visually investigate characteristics of the long-period fluctuations in the series ([48], [42]). This gives a general idea of long-term fluctuations along with wetter and drier (or warmer and colder) periods in the series. Previous experiences suggest that the use of the nine-point Gaussian filter superimposed over the long-term average (or median) of a series indicates a change point or a starting point of the trend ([43]).
Tree ring - climate relationships
Linear relationship between ring width and climate parameters
Climatic factors controlling EW, latewood LW, and annual ring TR formation were determined using the Pearson’s correlation coefficients (r) between the monthly climate data from the previous October to the current October of the ring formation year (biological year). Significant correlations were used to identify limiting factors. Then, we performed a moving window correlation analysis in a 30-year window with a 5-year offset to reveal the effect of changing climate over time by running the “treeclim” package ver. 2.0.5.1 ([51]) in the R environment ([37]). Similar analyses were also performed on 1, 3, 6, and 12 months SPEI values.
Non-linear relationship between ring width and climate parameters
We applied a generalized additive mixed model (GAMM) to assess the non-linearity and determine the thresholds for limiting factors. This approach aids in understanding the adaptability of P. pinea to climate change ([25], [10], [19], [6], [28]). GAMM was conducted using the “mgcv” package ([49]) in R ([37]). Site chronologies were employed as response variables, and limiting factors (PPTpDec-July: total precipitation from previous December to current July; drought: SPEI12 from March to October, and minimum mean and maximum temperatures during the winter) as predictors, and year and sites as nested random effects ([49]). Non-linearity was classified based on the effective degree of freedom (edf) as follows: (i) linear relationship (edf = 1); (ii) weakly non-linear relationship (1 < edf ≤ 2); and (iii) highly non-linear relationship (edf > 2) ([21]).
Tree resilience to climate change
We calculated the following indices to assess the growth resilience of the trees ([24]):
- Resistance = Dr/PreDr,
- Recovery = PostDr/Dr,
- Resilience = PostDr/PreDr = Resistance × Recovery
where PreDr is the mean Tree Ring Width (TRW) of the 4-year period before the drought; Dr is the TRW of the drought year; PostDr is the mean TRW of the 4-year period after the drought.
Resilience, recovery, and resistance index values were calculated for the years when the formation of narrow ring occurred, which was attributed to drought induced by high temperatures and low precipitation. These particular years were identified based on criteria involving SPEI, precipitation levels, and the presence of very narrow ring formations. The indices were calculated individually for each tree, and the average values were aggregated for the sites and visualized as box plots. These analyses were done using the “pointRes” package ([26]) within the R environment ([37]). Threshold values recommended by Fang & Zhang ([16]) were applied for the resistance and recovery indices: resistance index >0.75 indicates high-resistance trees, and recovery index >1.25 indicates trees having high recovery.
Results and discussion
Chronology building and characteristics
In this study, we presented two EW, LW, and RW chronologies of stone pine trees from the Kozak plateau (Tab. 2, see also Fig. S2 in Supplementary material). High mean inter-series correlations within and between trees were calculated for both site chronologies, although human effects, such as pruning, were present. Mean sensitivity (MS), a metric indicating the year-to-year variations in ring width attributed to varying environmental conditions ([17]), was higher in stone pine trees in the HAC site compared to those in the DEM site. In both sites, LW chronologies exhibited greater MS values than EW and RW. Similar results have been obtained in stone pine trees from Italy and Portugal, suggesting that LW rings are more sensitive to climate variations than EW and TR ([9]). Moreover, EPS values enabled us to extend the climate-growth analysis back to 1930 for the HAC region, while a narrower timeframe (1952-2019) was obtained for the relatively younger DEM site.
Tab. 2 - Chronology statistics from two different sites. (Rbar.wt): mean interseries correlation within-trees; (Rbar.bt): mean interseries correlation between-trees; (EPS cut): Expressed Population Signal>0.85; (SNR): Signal to noise ratio.
| Statistic | HAC | HACEW | HACLW | DEM | DEMEW | DEMLW |
|---|---|---|---|---|---|---|
| Number of trees/cores | 14/25 | 15/27 | ||||
| Chronology time span | 1910-2009 | 1931-2019 | ||||
| Time length | 100 years | 89 years | ||||
| EPS cut | 1917 | 1917 | 1922 | 1952 | 1952 | 1952 |
| Mean sensitivity | 0.32 | 0.32 | 0.4 | 0.22 | 0.21 | 0.36 |
| Rbar.wt | 0.7 | 0.57 | 0.56 | 0.56 | 0.52 | 0.53 |
| Rbar.bt | 0.44 | 0.36 | 0.36 | 0.42 | 0.37 | 0.41 |
| SNR | 11.2 | 8.6 | 8.75 | 10.77 | 8.22 | 9.87 |
Determination of climatic trends
We observed nonlinear apparent increases in the annual, spring, and summer mean air temperature series and the warming trends were statistically significant (p<0.001 - Tab. S1 in Supplementary material). The warming trends observed in autumn and winter mean air temperatures were statistically significant at the 0.05 and 0.10 levels, respectively.
Maximum air temperature time series were also generally characterized by an increasing trend (Tab. S1). In this respect, annual, spring, and summer average maximum air temperatures tend to increase significantly (p<0.01) in accordance with the M-K rank correlation test, with a small difference in magnitude (p<0.001) for the LSLR trend in the annual average maximum air temperature series. In contrast, the maximum air temperature series for winter and autumn did not indicate any significant trend.
For the annual and seasonal average minimum air temperatures, the minimum air temperature series showed similar warming trends compared with the mean air temperatures in terms of the nature and magnitude of the long-term trends (Tab. S1 in Supplementary material). Annual, spring, and summer average minimum air temperatures depicted statistically significant increasing trends (p<0.001). On the other hand, winter and autumn average maximum air temperatures indicated statistically significant trends at the 0.10 and 0.01 levels, respectively (Tab. S1).
Air temperature series were generally characterized by the latest change point towards a warmer average period in the late 1980s or in the early 1990s (e.g., at year of 1994 - Fig. 2a, Fig. S3). For instance, the winter air temperature series, which may help explain some of the variability in the annual tree rings, had a change point in the year 1994 towards the sequential warmer years, or short warmer years of the period over the long-term average (Fig. 2a, Fig. S3).
Fig. 2 - Inter-annual variations and long-term linear trends in (a) winter (Dec to Feb) mean air temperature and (b) 12-month SPEI (March to October) for the Kozak district. In both graphs, the solid red line shows the 9-point low-pass Gaussian filter, while the dotted red line shows the linear regression fitted to the seasonal air temperature series in (a) and the drought indices in (b). The dotted black lines in (b) indicate the ± 0.5 standardized lower and upper limits of the normal precipitation conditions.
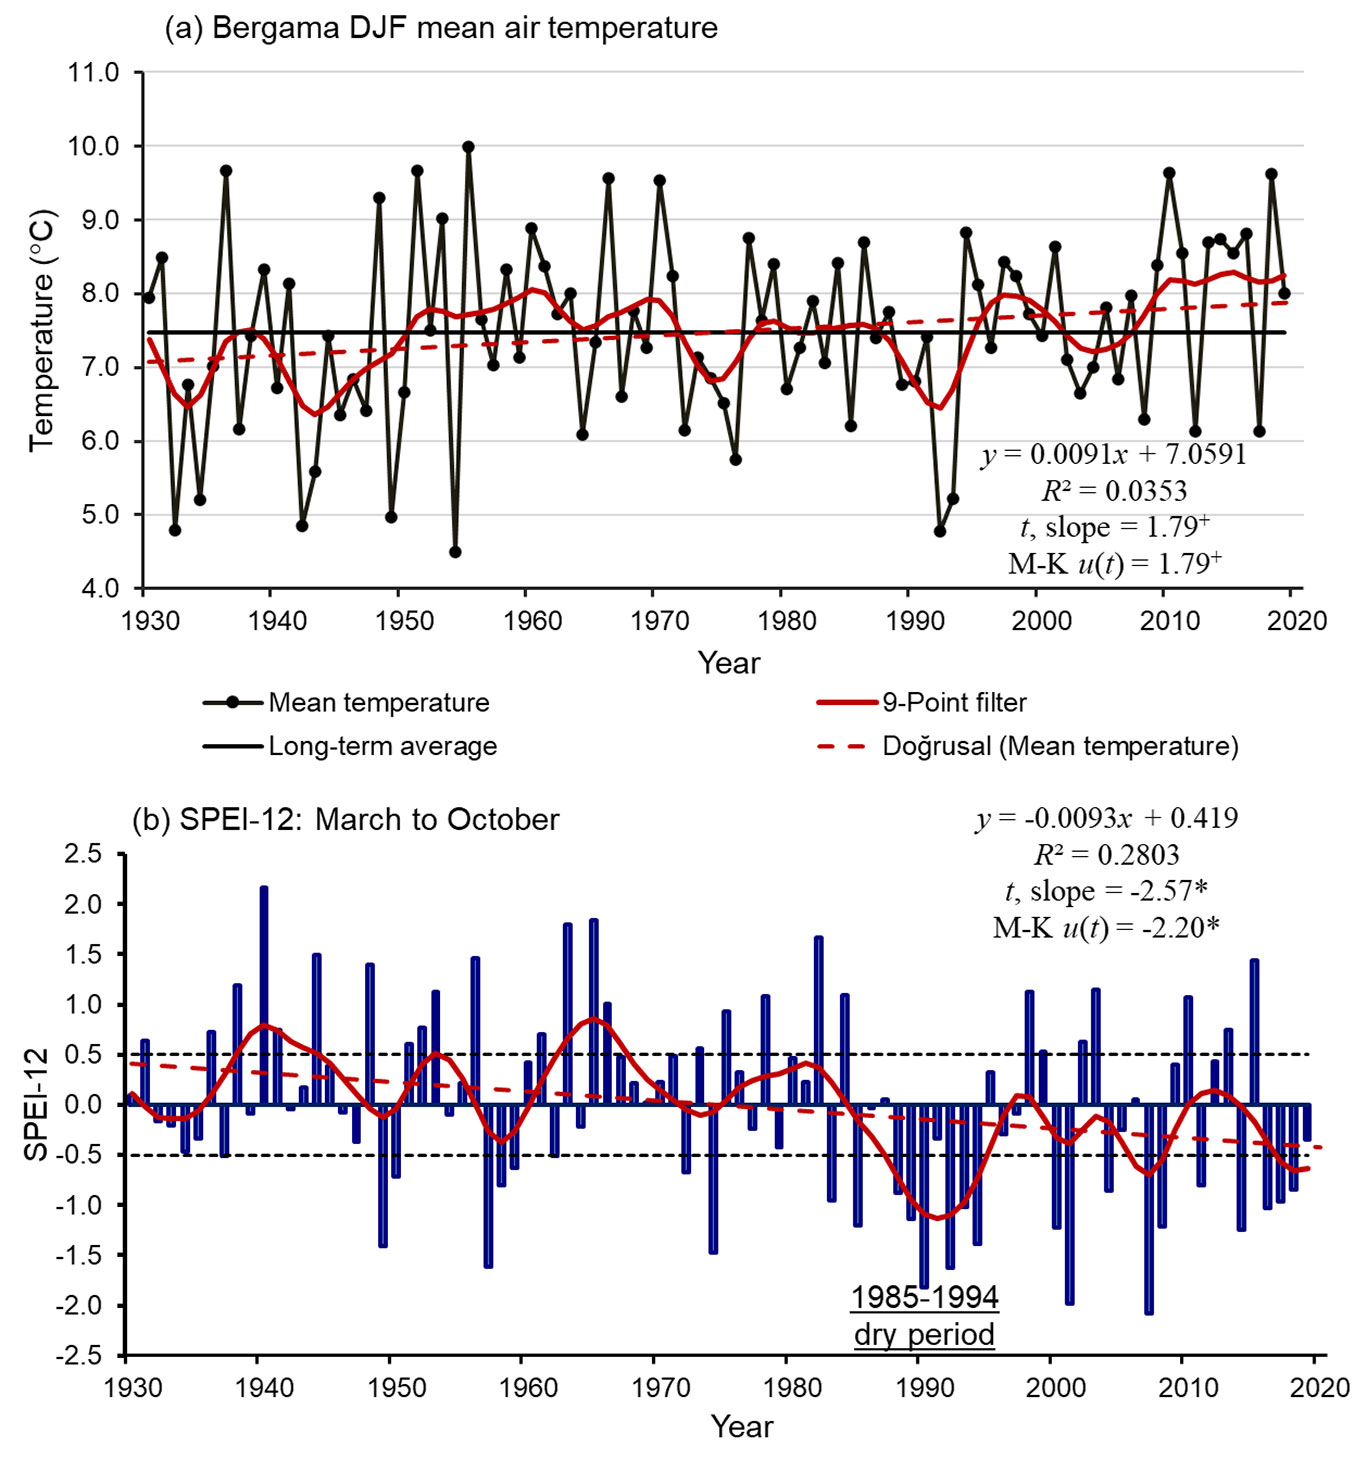
We provided a long-term non-linear trend of the SPEI12 series from March to October (Fig. 2b), which is found to be important in explaining annual tree-ring variations (Fig. 3). A statistically significant decreasing trend was determined in the SPEI12 series (March to October - Fig. 2b, see also Tab. S2 in Supplementary material). The SPEI12 exhibits a marked low-frequency fluctuation with a relatively high-frequency year-to-year variability above the long-term average (zero in the standardized series) with an overall decreasing trend (Fig. 2b). This is in line with the increasing trend observed in air temperatures in the 1980s, since the SPEI index also includes evaporation information as a function of air temperature. Also, the long-term linear trend indicates severe drought conditions compared to the long-term average for the period 1985-1994.
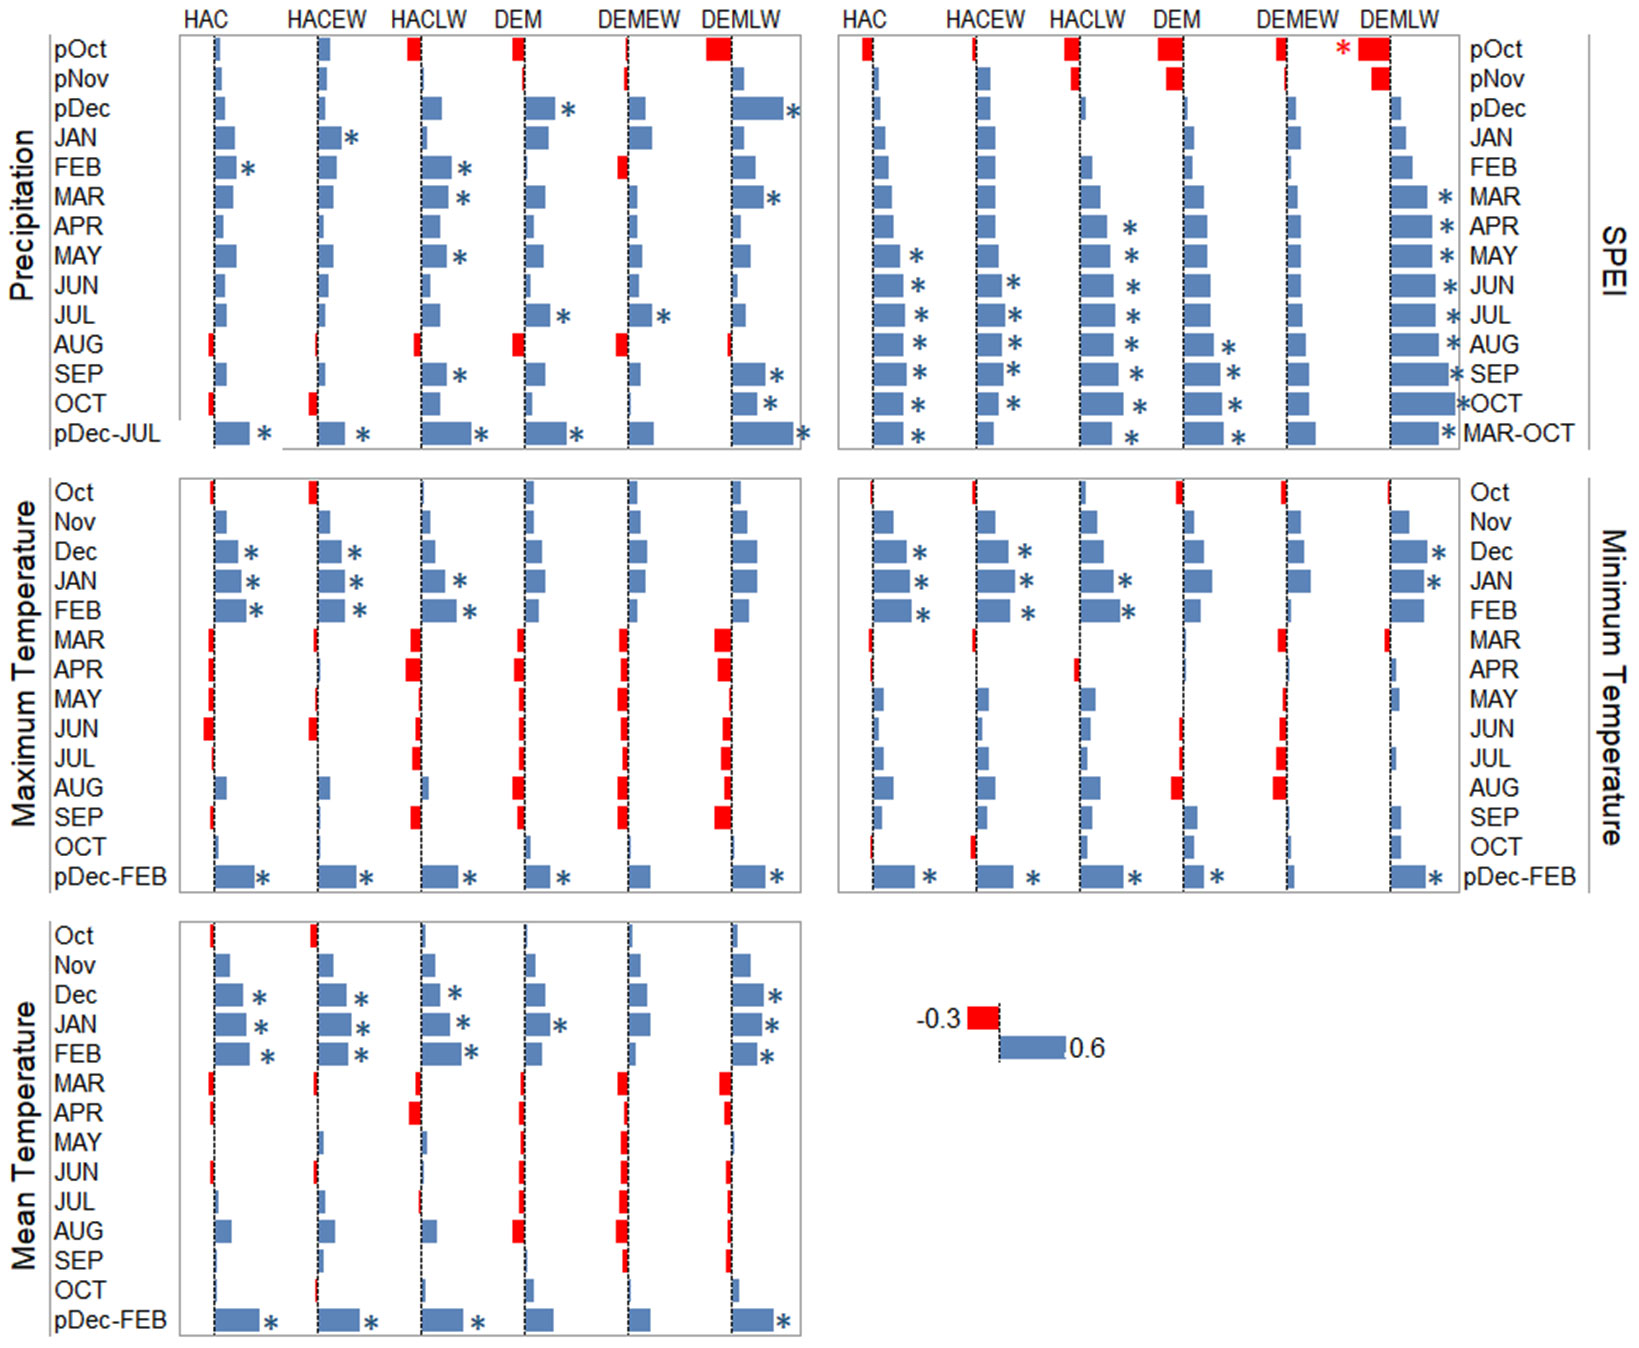
Fig. 3 - Pearson’s correlation coefficients between radial growth (RW, EW, and LW) and climate parameters (monthly total precipitation, SPEI12, average maximum, average minimum, and mean air temperatures). The time periods 1930-2019 for HAC and 1952-2019 for DEM chronologies were considered in the analysis. (*): p < 0.05.
Tree ring-climate relationships
Linear relationship between ring width and climate parameters
The total precipitation from the previous December to the current July (PPTpDec-July) was found positively correlated with RW, EW and LW in both the regions considered(Fig. 3). This is consistent with previous studies from Portugal and Spain reporting stone pine radial growth’s dependency on rainfall ([9], [30]). Higher precipitation during September and October is prominent for LW formation in the Kozak plateau, unlike EW formation. Indeed, rainy autumns following dry summers increase photosynthetic activity in pine species ([34]), leading to the formation of larger LW.
We examined the drought-growth relationship by focusing on SPEI12 (Fig. S4). We found that Pearson’s correlation coefficients with SPEI12 were strong and mostly statistically significant from March to October, corresponding to the vegetation period (Fig. 3). Drought limitations were higher on LW formation than EW in both sites and stronger at the DEM site located at a lower altitude. These results confirm the findings from previous research on Mediterranean low-elevation pine species, as dry conditions during summer lead to narrow EW and also result in narrow LW formation ([34]). A tree-ring study conducted on Pinus pinea in Albania ([34]) allowed us to compare our findings regarding drought indices. The P. pinea trees in the Kozak Plateau exhibited statistically significant responses during the growing season, suggesting they are more vulnerable to drought stress than the Albanian P. pinea trees.
We found positive correlations between tree-ring parameters and winter air temperatures (from the previous December to the current February), indicating a cold limitation on radial growth of P. pinea in the Kozak plateau (Fig. 3). Higher temperatures during the winter can extend the vegetation period ([1]) and lead to the formation of wider annual rings. Winter cold limitation was stronger for the trees growing at higher elevations (HAC) than those located at lower elevations (DEM), where the temperature is relatively milder.
Pearson’s correlation coefficient analysis revealed the following primary factors limiting the radial growth of stone pines in the Kozak plateau: (i) low precipitation amount from previous December to current July (PPTpDec-July); (ii) drought (as reflected by SPEI12) during the vegetation period from March to October (SPEIMarch-Oct); and (iii) low air temperatures during the winter. The limiting effect of these factors is more pronounced on the LW formation of trees in both sites.
Moving window correlation analysis showed that the impact of these limiting factors varied over time (Fig. 4a). The temporal instability was more evident in HAC site time series with longer intervals. The positive effect of PPTpDec-July was not significant until 1960-1989 on LW and RW formation and until 1965-1994 on EW formation in the HAC site. A similar pattern was observed in the DEM site, with gradually increasing and becoming significant correlations after 1960-1989 for RW and after 1970-1999 for EW, except for the last period. The effect of drought during the vegetation period (SPEIMarch-Oct) showed a similar pattern across time in both sites, except for the EW chronology at DEM. Significant drought limitations, indicated by PPTpDec-July and SPEIMarch-Oct (Fig. 4a), closely aligned with severe drought conditions from 1985 to 1994 (Fig. 2b).
Fig. 4 - (a) Moving window of Pearson’s correlation coefficients between radial growth (RW, EW, and LW) and limiting factors (PPTpDec-July: total precipitation from previous December to current July; T(MIN | MP | MX)pDec-Feb: air temperature from previous December to current February: SPEIMar-Oct: drought during vegetation period, from March to October). The time periods 1930-2019 for HAC and 1952-2019 for DEM chronologies were analyzed in a 30-year window with a 5-year offset. (b) The estimated smoothing splines of radial growth to limiting climatic factors, PPTpDec-July and TMINpDec-Feb during 1952-2019. Gray shades indicate 95% confidence intervals. (*): p < 0.05.
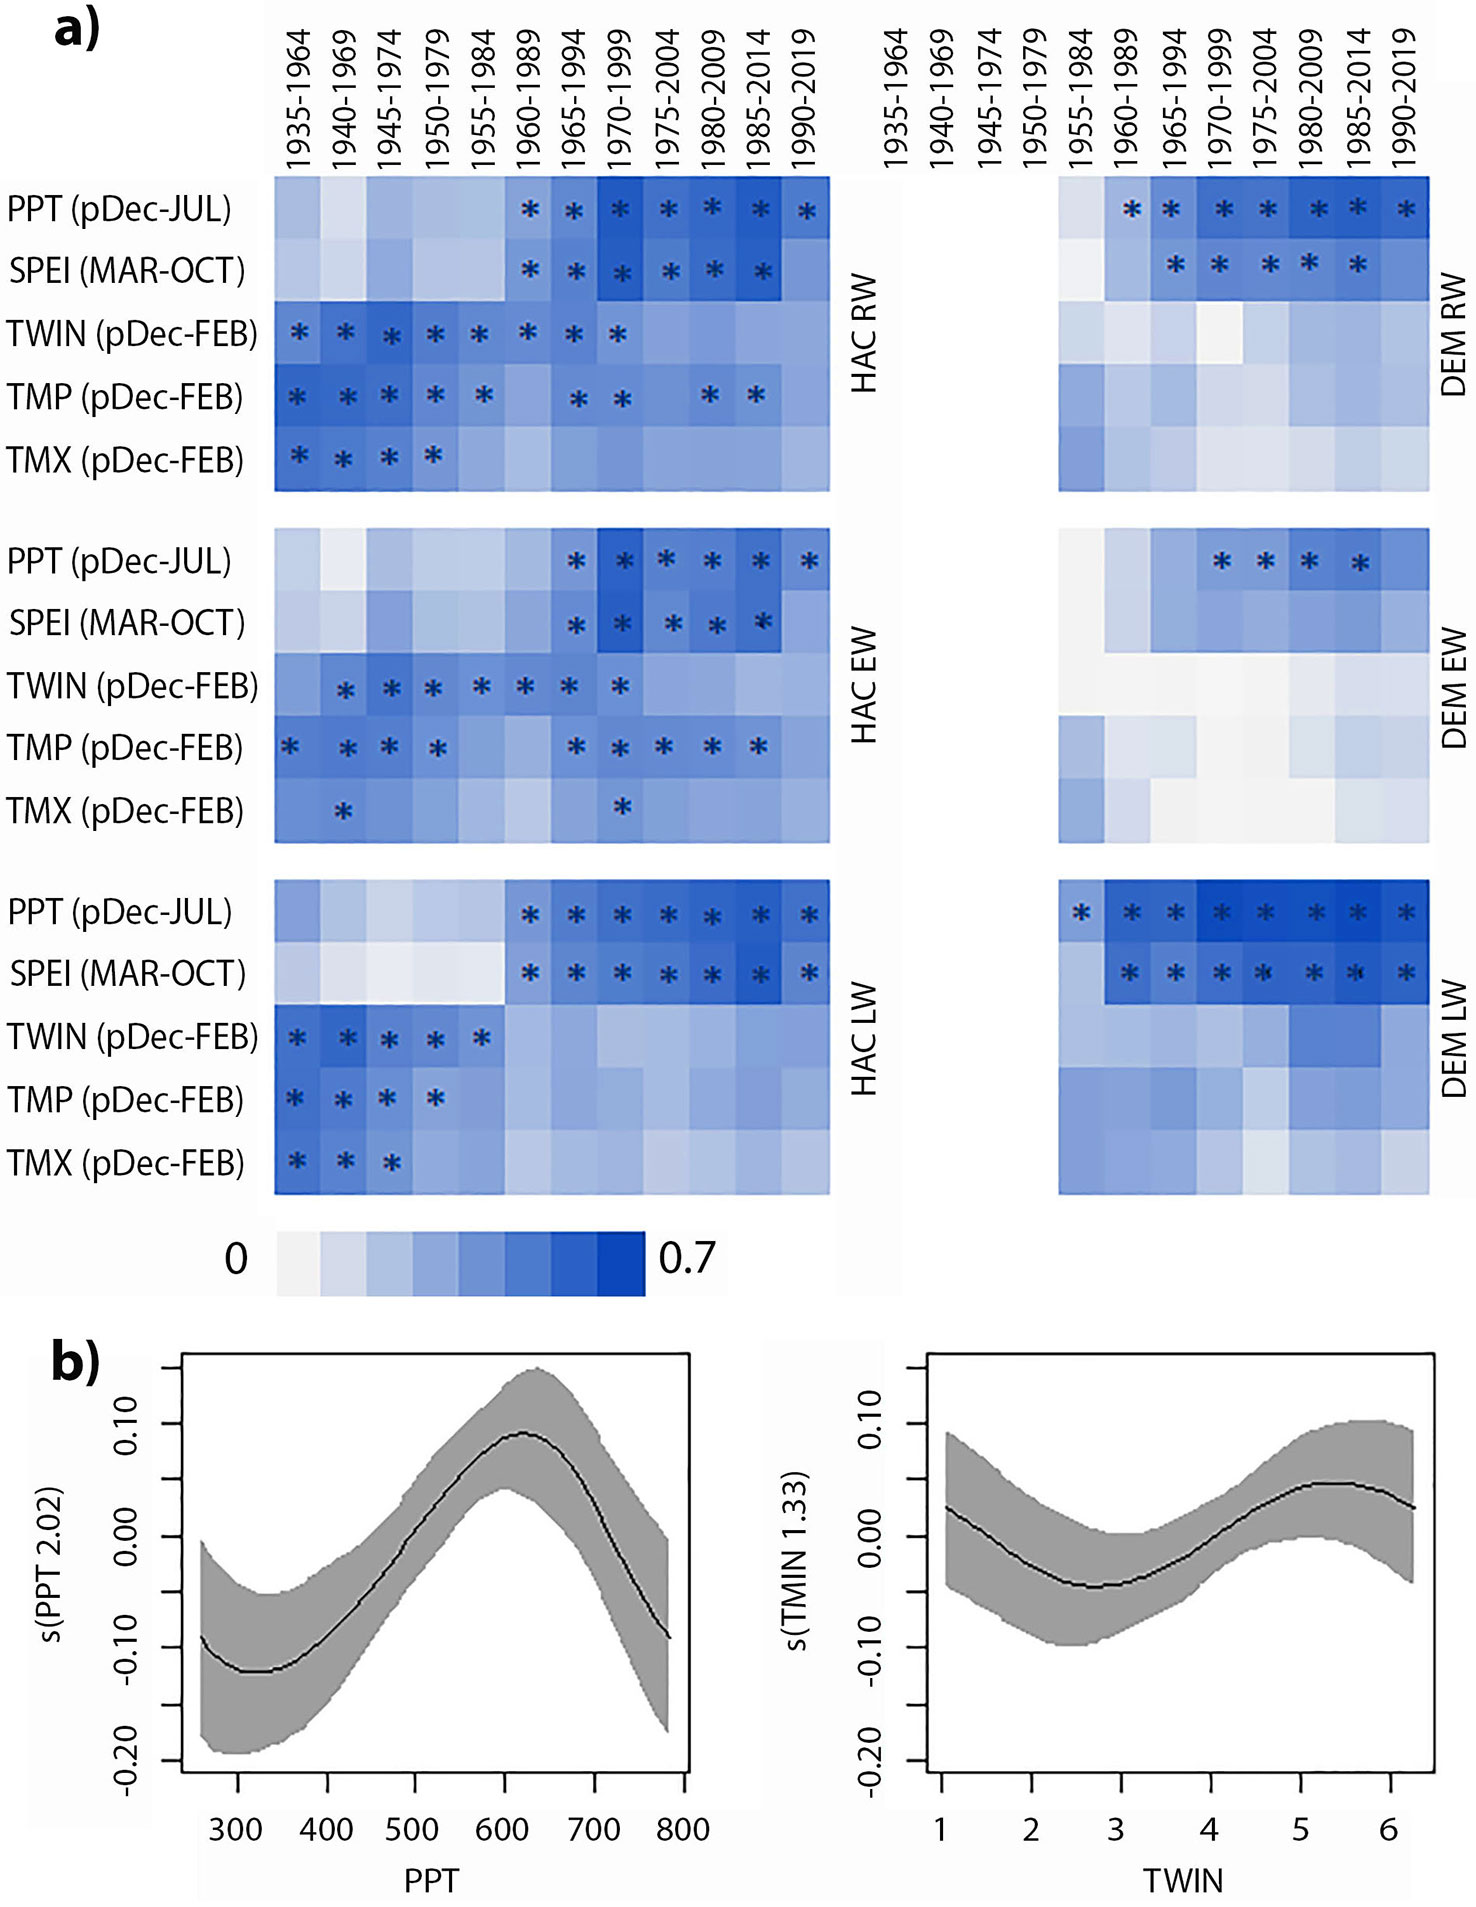
The cold limitation on radial growth gradually decreased in both sites, with a clear trend in the long time series of the HAC site located at a higher altitude. The limiting effect of minimum winter temperatures became negligible after 1975-2004 for RW and EW, and after 1960-1989 for LW. The gradually decreased effect of winter mean temperature retained its significance in some periods for RW and EW, while it sharply decreased and became insignificant after 1955-1984 for LW. The positive and significant effect of winter maximum temperatures became insignificant after 1955-1984 for RW and 1950-1979 for LW, with a weaker effect on EW formation. Due to the shorter DEM site chronologies, a test of the temporal stability of the climate-growth relationship could not be performed (Fig. 4a). Also, the gradual disappearance of the limiting effect of low winter temperatures is due to the clear warming trend in the region (Fig. 2a, Fig. S3 in Supplementary material).
The effect of the increasingly arid conditions was more evident in the LW chronologies of stone pine trees in the Kozak plateau (Fig. 4a, Fig. S5), as indicated by by the higher MS value of the LW chronologies. In Mediterranean ecosystems, trees have two main stress factors, namely, winter cold and summer drought ([11]). In this study, the results of the linear analysis showed that drought stress on the stone pines in the Kozak plateau increased due to climate change, while winter cold stress decreased. Although fluctuations in moving correlations through time may be attributed to age-related changes in sensitivity ([23]), we observed similar responses in relatively older and younger sites (Fig. S2 in Supplementary material), suggesting that these are more likely a result of climate change rather than age.
Non-linear relationship between ring width and limiting factors
We conducted a GAMM analysis using the identified limiting factors as predictors and subsequently refining our model to include only the significant predictors related to precipitation and temperature, namely, PPTpDec-July and TMINpDec-Feb, respectively (Tab. 3, Fig. 4b). The GAMM model showed satisfactory results, with an adjusted-R2 of 0.49. The effect of PPTpDec-July on the high-frequency variation of radial growth was characterized by a non-linear relationship (edf > 2). On the other hand, the effect of TMINpDec-Feb exhibited a weakly non-linear relationship with calculated edf falling between 1 and 2 ([21]). Indeed, the total precipitation from the previous December to July (PPTpDec-July) had the most significant effect, as indicated by the highest F-value. Precipitation levels between approximately 500-710 mm of PPTpDec-July resulted in a positive additional increment in tree radial growth, while values < 500 mm and > 710 mm led to a lesser increment. The effect of minimum temperature during winter displayed some fluctuations, showing a local minimum at 2.5 °C and a local maximum at about 5.5 °C. TMINpDec-Feb values above approximately 5.5 °C caused a slight decrease in the relative additional increment. Correlation coefficients representing the linear relationship between growth and winter temperatures showed that the constraining effect of cold conditions diminished over time (Fig. 4a). This trend is consistent with the findings reported by Martin-Benito et al. ([27]) for Picea orientalis in the Caucasus and by Bozkurt et al. ([6]) for Pinus sylvestris at the lower elevation in the western Turkish range. This may lead to a reduced tree growth in the region. However, non-linear relationships suggest that this reduction might not be permanent (Fig. 4b). Nonetheless, trend analyses indicate that winter temperatures and summer dry conditions in the region are increasing, and this may descrease P. pinea growth under a changing climate.
Tab. 3 - Summary statistics of GAMM. (df): degrees of freedom.
| Parameter | Smoothing term (Limiting factors) |
|
|---|---|---|
| PPTpDec-July | TMINpDec-Feb | |
| Effective df | 2.02 | 1.33 |
| F-value | 108.48 | 22.15 |
| p-value | < 0.001 | < 0.05 |
Tree resilience to climate change
We calculated the resistance, recovery, and resilience indices for the years 1974, 1999, 2001, and 2007, when the drought was severe and caused narrow annual ring formation (Fig. S6 in Supplementary material). In these years, PPTpDec-July values were two standard deviations (std) below the average (except for 1974, which was 1 std below), and SPEIMarch-Oct values were 1 std below the average. In the Kozak Plateau, the tree rings of P. pinea revealed distinct patterns related to resistance, recovery, and resilience indices, providing valuable insights into the ecological performance of trees impacted by severe drought conditions (Fig. 5). Both sites exhibited relatively low resistance to severe droughts (see Tab. S3 in Supplementary material). The percentage of high-resistant trees was below or around 40% in both sites, except for 2007 in the HPP (67%) and 2001 in the DEM (60%) sites. This may be due to the relative aridity of our study area. The lower resistance to drought in the northern hemisphere is associated with lower latitude and soil moisture levels ([18]). The mean recovery index is higher for the trees in the DEM site, located at a lower elevation. The percentage of high-recovery trees is more than 67% in the DEM site (except in 2001), while this rate is below 50% at the HPP site. Interestingly, none of the trees exhibited high recovery in 2001 at the DEM site. Gazol et al. ([18]) examined the effects of drought on forests in the northern hemisphere, noting that trees in drier regions typically exhibit higher recovery, which is attributed to a pronounced xylem plasticity affecting the hydraulic conductivity. Similarly, we found a greater recovery capacity of P. pinea trees in the DEM region, which experience relatively drier conditions due to the lower elevation.
Fig. 5 - Box plots of resistance, resilience, and recovery indices of trees from HAC and DEM sites for the years 1974, 1990, 2001, and 2007. Horizontal lines represent the median.
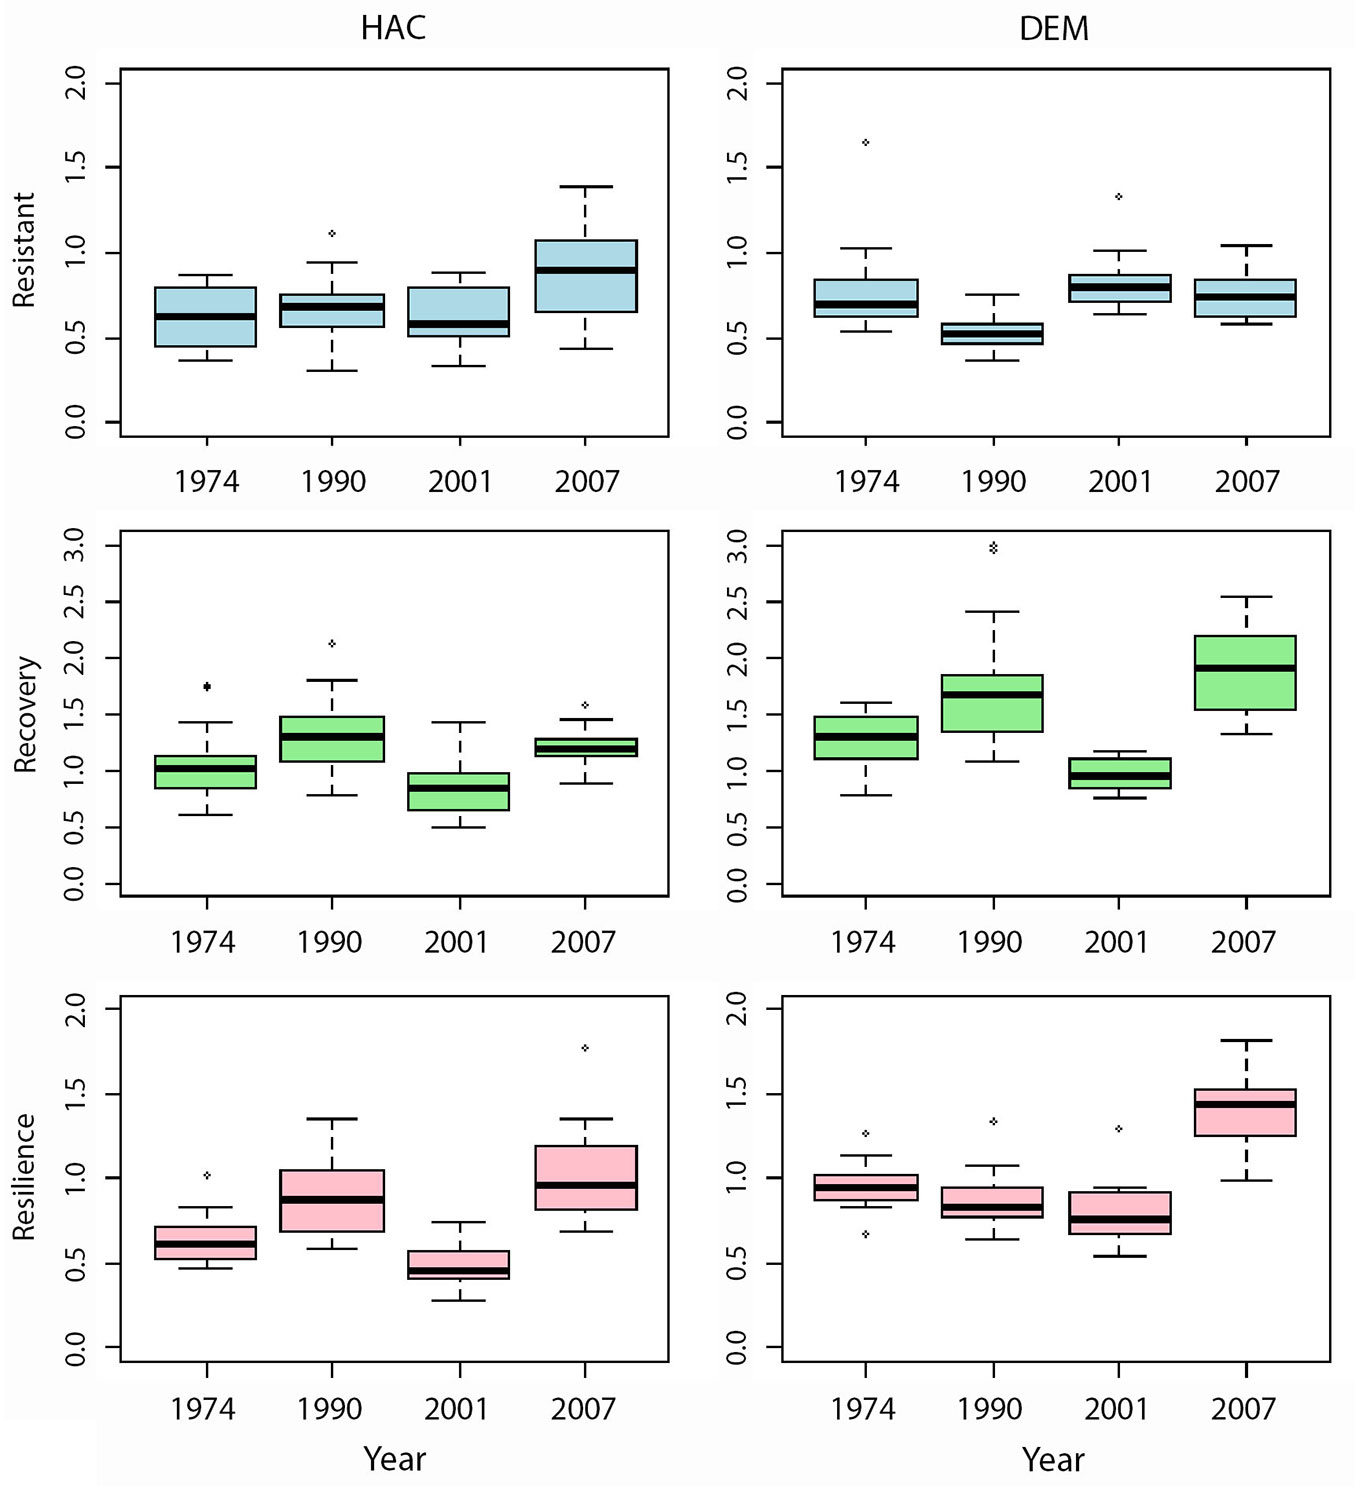
The resilience indices indicate that only a limited percentage of sampled trees returned to pre-disturbance growth levels, except in 2007. Notably, resilience tends to decrease in the DEM region until 2007. The low resilience at both sites is a potential indicator of mortality risk ([14]), considering that more frequent and severe droughts and heatwaves are anticipated in the Mediterranean basin ([22]). Pirano ([36]) emphasized that drier conditions may threaten the resilience of stone pines in Italy. Conversely, the high resilience index recorded in 2007 suggests that consecutive rainy periods following disturbances could enhance resilience. Further, Research on stone pines in the Italian Peninsula supports the idea that recovery - a crucial aspect of resilience - improves under wetter conditions ([35]).
Conclusions
Our study revealed that drought conditions constrain the radial growth of stone pine trees on the Kozak Plateau during the vegetation period and cold winters. The impact of drought is particularly pronounced in trees situated at lower elevations. Rainfall in autumn, especially during September and October, contributes to increased latewood formation. Climate trend analysis of the Kozak Plateau identified a notable shift in climatic conditions, with a significant change point detected in the late 1980s and early 1990s. Specifically, winter air temperatures exhibited a clear shift towards warmer temperatures in 1994 compared to the long-term average. In line with increasing temperature, SPEI12 revealed severe drought conditions during the period from 1985 to 1994, which deviated significantly from the long-term average. Accordingly, we found that the drought stress begun in this period and has become increasingly severe in recent decades, and the limiting effect of winter cold has disappeared. This indicates that the effects of climate change are mixed, with the benefits of milder winters alongside the stress caused by a prolonged dry vegetation period.
GAMM analyses showed that the effects of precipitation and temperature on Pinus pinea tree growth are non-linear. We also found that the trees in the Kozak plateau displayed low resistance to severe drought, while those at lower altitudes, experiencing drier conditions, exhibited greater recovery potential. The projected drier climate for the Mediterranean Basin and the limited resilience of trees to drought poses a significant threat to the stone pine populations in the region.
Our results provided valuable insights into the drought responses and resilience mechanisms of stone pines, particularly amidst the backdrop of escalating drought conditions in the Mediterranean region. These findings are key for informing sustainable management practices and conservation efforts in light of changing environmental conditions.
Acknowledgments
This study was supported by the Izmir Metropolitan Municipality through a bilateral contract signed with the Turkish Forester’s Association. We thank Hüseyin Çelik for his help in all bureaucratic affairs and in fieldwork and Ferdi Akarsu for helping in preparing the map. We also thank Bikem Ekberzade for the English editing.
References
Gscholar
Gscholar
Gscholar
Gscholar
Gscholar
Gscholar
Online | Gscholar
Gscholar
Gscholar
Gscholar
CrossRef | Gscholar
Gscholar
Online | Gscholar
Authors’ Info
Authors’ Affiliation
Hakan Çelik 0009-0003-6697-2590
Ünal Akkemik 0000-0003-2099-5589
Istanbul University-Cerrahpasa, Faculty of Forestry, Dept. of Forest Botany, 34473 Bahcekoy-Istanbul (Türkiye)
Bogaziçi University, Center for Climate Change and Policy Studies, 34342, Istanbul (Türkiye)
Corresponding author
Paper Info
Citation
Köse N, Türkes M, Çelik H, Akkemik Ü (2025). Is Pinus pinea growth affected by climate change in western Anatolia?. iForest 18: 93-101. - doi: 10.3832/ifor4641-018
Academic Editor
Michele Colangelo
Paper history
Received: May 16, 2024
Accepted: Jan 24, 2025
First online: Apr 28, 2025
Publication Date: Apr 30, 2025
Publication Time: 3.13 months
Copyright Information
© SISEF - The Italian Society of Silviculture and Forest Ecology 2025
Open Access
This article is distributed under the terms of the Creative Commons Attribution-Non Commercial 4.0 International (https://creativecommons.org/licenses/by-nc/4.0/), which permits unrestricted use, distribution, and reproduction in any medium, provided you give appropriate credit to the original author(s) and the source, provide a link to the Creative Commons license, and indicate if changes were made.

Web Metrics
Breakdown by View Type
Article Usage
Total Article Views: 9377
(from publication date up to now)
Breakdown by View Type
HTML Page Views: 4067
Abstract Page Views: 2468
PDF Downloads: 2533
Citation/Reference Downloads: 1
XML Downloads: 308
Web Metrics
Days since publication: 435
Overall contacts: 9377
Avg. contacts per week: 150.89
Article Citations
Article citations are based on data periodically collected from the Clarivate Web of Science web site
(last update: Mar 2025)
(No citations were found up to date. Please come back later)
Publication Metrics
by Dimensions ©
Articles citing this article
List of the papers citing this article based on CrossRef Cited-by.
Related Contents
iForest Similar Articles
Review Papers
Climate change impacts on spatial distribution, tree-ring growth, and water use of stone pine (Pinus pinea L.) forests in the Mediterranean region and silvicultural practices to limit those impacts
vol. 14, pp. 104-112 (online: 01 March 2021)
Review Papers
Impacts of climate change on the establishment, distribution, growth and mortality of Swiss stone pine (Pinus cembra L.)
vol. 3, pp. 82-85 (online: 15 July 2010)
Research Articles
Impact of climate change on tree-ring growth of Scots pine, common beech and pedunculate oak in northeastern Germany
vol. 9, pp. 1-11 (online: 13 October 2015)
Short Communications
Assessing Pinus pinea L. resilience to three consecutive droughts in central-western Italian Peninsula
vol. 13, pp. 246-250 (online: 19 June 2020)
Review Papers
Increasing resistance and resilience of forests, a case study of Great Britain
vol. 17, pp. 69-79 (online: 21 March 2024)
Research Articles
Impact of climate change on radial growth of Siberian spruce and Scots pine in North-western Russia
vol. 1, pp. 13-21 (online: 28 February 2008)
Research Articles
Predicting the effect of climate change on tree species abundance and distribution at a regional scale
vol. 1, pp. 132-139 (online: 27 August 2008)
Research Articles
Species-specific responses of wood growth to flooding and climate in floodplain forests in Central Germany
vol. 12, pp. 226-236 (online: 03 May 2019)
Review Papers
Quantifying and modeling water availability in temperate forests: a review of drought and aridity indices
vol. 12, pp. 1-16 (online: 10 January 2019)
Research Articles
Potential impacts of regional climate change on site productivity of Larix olgensis plantations in northeast China
vol. 8, pp. 642-651 (online: 02 March 2015)
iForest Database Search
Search By Author
Search By Keyword
Google Scholar Search
Citing Articles
Search By Author
Search By Keywords
PubMed Search
Search By Author
Search By Keyword


