Landsat TM imagery and NDVI differencing to detect vegetation change: assessing natural forest expansion in Basilicata, southern Italy
iForest - Biogeosciences and Forestry, Volume 7, Issue 2, Pages 75-84 (2014)
doi: https://doi.org/10.3832/ifor0909-007
Published: Dec 18, 2013 - Copyright © 2014 SISEF
Research Articles
Abstract
The NDVI (Normalized Difference Vegetation Index) differencing method using Landsat Thematic Mapping images was implemented to assess natural expansion of forests in the Basilicata region (southern Italy) for the period 1984 through 2010. Two Landsat TM (Thematic Mapper) images (1984-2010) were georeferenced and geographically corrected using the first order polynomial transformation, and the nearest neighbour method for resampling. The images were radiometrically corrected using the dark object subtraction model. The pre-processed Landsat TM images were used to calculate NDVI, and subsequently for NDVI differencing. Finally, a threshold for vegetation change detection was identified by visual analysis of Landsat TM RGB band composition, and ratios and visual comparison of digital aerial orthophotos. The methodology was validated using ground-truth observations over the study area. The applied method showed 91.8% accuracy in detection of natural forest expansion. During the examined period, total regional forest cover increased by 19.7% (70154 ha), consistent with National Forest Inventory data (1984-2005). The observed forest expansion was also examined in relationship with landscape physical characteristics and distribution of vegetation types in the Basilicata region. Surprisingly, considerable forest expansion also occurred on degraded soils in drought-prone Mediterranean areas.
Keywords
NDVI Differencing, Landsat TM, Detection Change, Natural Forest Expansion
Introduction
Assessment of natural forest expansion represents a crucial issue to elucidate several processes, including biogeochemical cycles, atmospheric composition related to climate change, and forest carbon uptake, as well as socio-economic processes and issues. Anthropogenic and naturally induced land cover changes affect spatial and temporal distribution and availability of environmental resources, and alter ecosystem composition and productivity. Globally, these processes can be considered the primary catalysts for change in biogeochemical cycling, atmospheric composition, and climate ([78], [67], [99]). Forest land-use and land-cover change (LULCC) were recognised as key issues in greenhouse gas removal/emission processes as specified by the Good Practices Guidance for Land Use, Land Use Change, and Forestry (GPG-LULUCF) during the Intergovernmental Panel on Climate Change (IPCC) established at the Kyoto Protocol ([75]). Observation and assessment of forest cover changes are crucial to elucidate the complexities inherent in feedback processes between forest distribution and human activities in sustainable forest development, natural resource management, biodiversity conservation, ecosystem functioning, and biogeochemical cycling ([44]). In Mediterranean regions, natural forest expansion is primarily related to the abandonment of agricultural practices and cattle-raising in marginal areas representing the principal change in Italy’s Mediterranean rural landscape over the past five decades ([79]). These processes generally vary in terms of the vegetation successional series and time scale, however the expansion dynamics are shared, beginning with an initial phase of spontaneous shrub dominance, followed by tree colonisation ([7]).
In recent decades, satellite-based high-resolution observations with multispectral scanners provided the scientific community with consistent data to implement detailed thematic mapping for local and regional scale land classification ([32], [33], [55], [35]). The near infrared wavebands on the Landsat Thematic Mapper (TM) facilitates advanced land classification analyses based on differences in spectral reflectance of different land cover types. In particular, specific foliar reflectance, pigment absorptions, and foliar moisture wavelength ranges represent the basis of vegetation class analyses. Furthermore, the availability of such land cover data at different spatial and temporal scales promotes the development and implementation of vegetation change detection techniques, which furthers our understanding on vegetation and ecosystem dynamics ([17], [20], [56], [63]).
In forest ecosystems, land cover change dynamic detection based on visual and statistical approaches represents a challenge to the scientific community due to the difficulties in remotely sensed image acquisition errors as remnant geometric errors, atmospheric scatter, and cloud effects. Other main sources of error are related to physical variability in land characteristics, including topography, vegetation types, and phenology ([92], [83]). In particular, Verbesselt et al. ([100]) proposed categorising vegetation changes at the ecosystem level under different classes based on a temporal scale (seasonal, gradual, and abrupt changes), and on the factors driving change, such as seasonal environmental constraints, inter-annual climate variability, land management, and disturbances (deforestation, fires, and floods). In many cases, land cover changes in highly fragmented forest areas can be mismatched with inter-annual variability due to plant phenology or seasonal productivity patterns related to climate variability ([23]). The comparison between the time-series of remotely sensed imagery might include a combination of seasonal variability and abrupt changes; therefore a long-term dataset represents the fundamental choice for change detection ([90]). Several proposed vegetation change detection methods are based on the same image pre-processing to create a time-series dataset, requiring a geometric and radiometric image correction. Coppin & Bauer ([19]) and Milne ([69]) reported the main methodological approaches for vegetation change detection can be distributed into four broad categories: (i) linear procedures (difference and ratio images); (ii) classification routines (post-classification change, spectral pattern change); (iii) transformed data sets (vegetation indexes, principal components analysis-PCAs); and (iv) others, such as regression analysis, knowledge-based expert systems, or neural networks ([85]).
Several literature reviews ([70], [72], [73]) reported the most efficient methodologies in accuracy and cost saving performances were image differencing and PCA techniques. The image differencing technique is based on a cell-by-cell subtraction between different images in a time-series. This technique applies differences between remotely sensed images of vegetation characteristics, and indexes derived from image radiance or reflectance differencing, i.e., NDVI (Normalized Difference Vegetation Index) or change vector differencing ([88]). The NDVI differencing method uses estimated NDVI as the normalized difference between near infrared (NIR) and visible red (RED) bands, which discriminate vegetation from other surfaces based on green vegetation chlorophyll absorption of red light for photosynthesis, and reflection of NIR wavelengths ([98]). The NDVI differencing technique was widely applied for both human-induced and natural forest cover change detection as land cover conversion, forest harvesting, revegetation, or afforestation that includes natural forest expansion and human-induced landscape restoration ([60], [103], [85], [58], [59], [71], [80]). In addition to the standardized techniques for pre-processing and differencing images, the most important step for vegetation change detection analysis is discrimination between real changes and seasonal or inter-annual variability, represented by a threshold between these factors, which is generally determined by applying the standard deviation (SD) from the NDVI differencing image ([37], [20], [26], [89], [81]).
In the present study, we propose a vegetation change detection analysis based on the NDVI differencing technique to assess forest cover changes related to natural forest expansion for the Basilicata region (southern Italy) from 1984 through 2010. The objectives were as follows: (i) to develop a procedure for pre-processing Landsat TM imagery, NDVI differencing, and identification of a threshold for vegetation change detection; and (ii) to determine primary patterns of the natural forest expansion in Mediterranean environments.
Material and methods
Study area
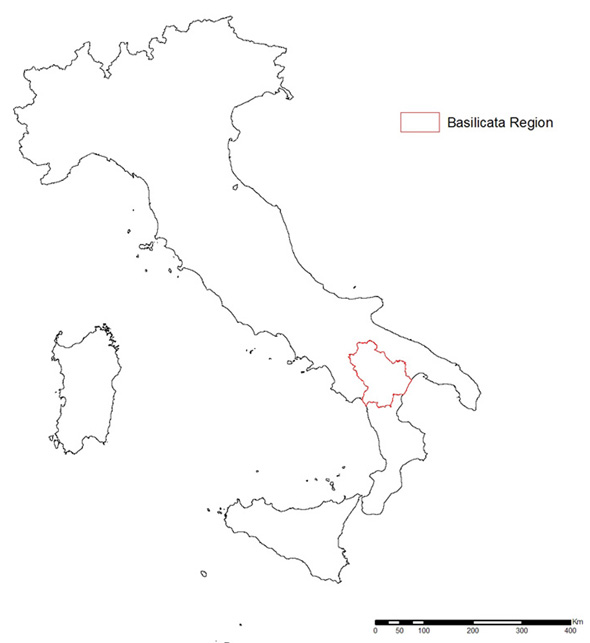
The study area represents the Basilicata region in southern Italy (Fig. 1). The regional territory is dominated by a mountainous area to the west, flanked by the Apennine Mountain range, while the east is comprised of low hills and wide valleys grading into flat plains on the south coast, along the Ionian Sea. The topography is consistent with climate characteristics, annual temperatures, and precipitation patterns indicating a Mediterranean humid type in the Apennine Mountain range, and a Mediterranean dry climate type in the hilly and flat areas. The annual rainfall average recorded at Senise and Terranova di Pollino was respectively 730 mm, and from 416 mm to 1211 mm, and annual temperatures ranged from a mean minimum temperature of 10 °C to mean maximum temperatures of 20-24 °C ([13], [31]).
Forests cover 35.6% (355 367 ha) of the total regional surface (999 400 ha - [45]). The Regional Forest Atlas ([22]) reported deciduous oak forests representing 51.8% of the forest cover, while other forest types were generally characterized by lower extensions, including Beech forest (8.4%), Mediterranean Macchia (7.9%), shrublands (6.9%), and other deciduous broad-leaved forests (5.5%). The remaining 19.5% were comprised of evergreen broad-leaved forests, Mediterranean pine forests, Chestnut stands, hygrophilous forest, and Garrigue. Coppices represented 51.6% of the total managed forests, while high stands represented the remnant.
Image pre-processing
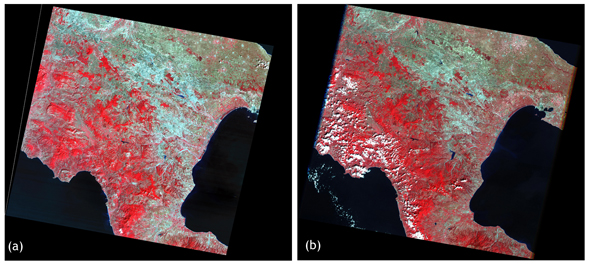
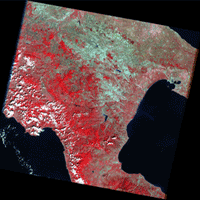
Two Landsat TM cloud free images (path 188, row 32) with 30 x 30 m spatial resolution were analysed (acquiring image periods: 8 September 1984 and 16 September 2010 - Fig. 2). Image registration and/or rectification are required to facilitate image conformity to another image, and involves georeferencing if the reference image is already rectified to a particular map projection. Landsat TM 2010 was projected using 26 ground control points (GCPs) to the Universal Transverse Mercator (UTM) projection System (zone number: 33N; reference datum: WGS84). The first order polynomial transformation model and nearest neighbor method for resampling were used for geographical correction of the two images, with a Root Mean Square (RMS) error of 0.5 pixels. Subsequently, the TM 1984 image was geo-coded to the TM 2010 image by the “map-to-map” method, and resampled with a first-order polynomial nearest neighbor algorithm using 12 GCPs for the registration process. The Root Mean Square Error (RMSE) for the map registration process was 0.5.
Fig. 2 - Landsat TM images (Path 188, Row 32) Band composition 4-3-2; image dates: (a) 08 September 1984; and (b) 16 September 2010.
The two images were subsequently clipped to the final study area, and radiometrically corrected using the dark object subtraction model ([14]), a widely applied methodology considered one of the best approaches for the radiometric correction in change detection analysis ([96], [57], [40], [87], [61], [102]). The reliability of the radiometric correction was confirmed using an inter-calibration algorithm between the NDVI images over a test area of the study site. Among the numerous radiometric normalization approaches specific to Landsat data ([27], [47], [107], [106], [12], [74], [65]), we selected the inter- calibration algorithm, defined as no-change (NC) regression normalization, which has already been applied over areas characterized by very complex landscape patterns ([93]). Comparisons of results between the dark object subtraction model and the inter-calibration algorithm of NC regression normalization showed no significant differences in change detection over forest areas between the two methods. Cross-classification between the two images exhibited a 2% difference for analysis of all land use changes, which was reduced to less than 1% for the assessment of only forest land use changes.
NDVI differencing
Change detection in land use alterations during the analysis period (1984-2010) was analyzed using the NDVI differencing technique following Singh ([95]). First, we calculated NDVI following the general normalized difference between Band TM4 (near infrared - NIR) and band TM3 (visible red - RED) from the two Landsat TM pre-processed images (1984 and 2010 - eqn. 1):
The resulting images were subtracted to assess the ΔNDVI image with positive (NDVI increase) and negative (NDVI decrease) changes on a 30 x 30 m pixel resolution (eqn. 2):
The NDVI difference image was also tested to determine its goodness-of-fit to a normal distribution. Mean, mode, median, standard deviation, and specific statistical indexes were generated, including skewness ([51], [36]), and kurtosis ([4]), and Kolgomorov-Smirnov non-parametric tests ([53], [50]) were conducted.
The difference image ΔNDVI was then reclassified using a threshold value calculated as μ ± n·σ; where μ represents the ΔNDVI pixels digital number mean, and σ the standard deviation. The threshold identifies three ranges in the normal distribution: (a) the left tail (ΔNDVI < μ - n·σ); (b) the right tail (ΔNDVI > μ + n·σ); and (c) the central region of the normal distribution (μ - n·σ < ΔNDVI < μ + n·σ). Pixels within the two tails of the distribution are characterized by significant vegetation changes, while pixels in the central region represent no change. The n factor defines the range of dispersion around the mean. This study considered only the positive variation in forest cover defined as the area of probable natural forest expansion.
Threshold identification for detection of vegetation changes represents a key issue in the NDVI differencing method. The standard deviation (σ) is one of the most widely applied threshold identification approaches for different natural environments based on different remotely sensed imagery ([95], [47], [20], [40], [56]).
Generally, the threshold value is identified by n·σ of the NDVI difference image average, where the n value is identified by the trial and test method, and σ is the standard deviation of the pixel values density function in the change image. This approach exhibited viable results, and reliability for different forest ecosystems under both human-induced and natural land use changes, with threshold values between 1·σ and 2·σ supported in the literature ([108], [64]).
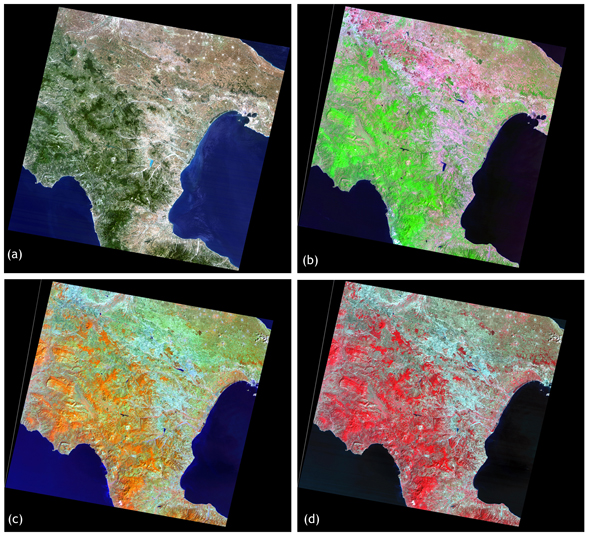
In the present study, the final identification of the best-fitting n·σ threshold value was based on visual analysis of Landsat TM RGB band composition and ratios, and on the visual comparison of digital aerial orthophotos Volo Italia 1994 (black and white) and TerraItaly 2008 data sets. In particular, a visual analysis based on three different threshold values (1·σ, 1.5·σ and 2·σ) was conducted over 200 points randomly chosen within areas of vegetation change using the 1·σ threshold, in order to represent the areas with the most probable vegetation changes. Landsat TM RGB band compositions were selected (Fig. 3) since their efficient representation of the vegetation cover ([54], [34], [39]). Landsat TM4-3-2 is commonly used for the identification of broad leaf, conifers, grasslands, sparsely vegetated areas and/or healthier vegetation ([48], [25]). Landsat TM4-5-3 is used for the discrimination of vegetation types and conditions and land/water interface ([47]). The composition Landsat TM4-5-1 is particularly efficient in the detection of healthy vegetated areas, but also for recently clear-cut regions and new vegetative growth generally attributed to sparse grasslands ([91], [54]). Landsat TM7-4-2 was analyzed for the detection of low-density vegetation that can represent areas with probable natural expansion due to forest processes ([82]). The composition Landsat TM5-4-1 representing healthy vegetation and is generally used for the detection of agricultural areas ([101]). In addition to the RGB band combinations, the Landsat TM band ratios were analyzed using the Landsat TM4/TM3 and TM3/TM2. The TM4/TM3 ratio distinguishes vegetation, water, and croplands, while the TM3/TM2 ratio separates forests and croplands, which is useful in discriminating broad classes of vegetation ([84]). Finally, the n·σ threshold value was statistically determined by Cohen’s Kappa inter- rater agreement coefficient ([16], [97], [18], [46]), which identified n = 1.5.
Ground-truth validation
Natural expansion of forest areas within positive vegetation change was detected by clipping the NDVI > +1.5·σ image using a mask image of the Forest Map for Basilicata ([22]), which represented the actual forest cover extension, and also included the area subject to natural forest expansion. The five year difference between the Forest Map (2006) publication and the change detection analysis (2010) resulted in the application of a 100 m buffer to identify any pixel with ΔNDVI > +1.5·σ that can be considered as a possible natural forest expansion during this period. The buffer value was chosen on the basis of the spatial characteristics of forest cover that in many cases is highly fragmented with high perimetral values. Finally, the pixels characterized by ΔNDVI > +1.5·σ within the conifer afforestation and plantation forest types were excluded.
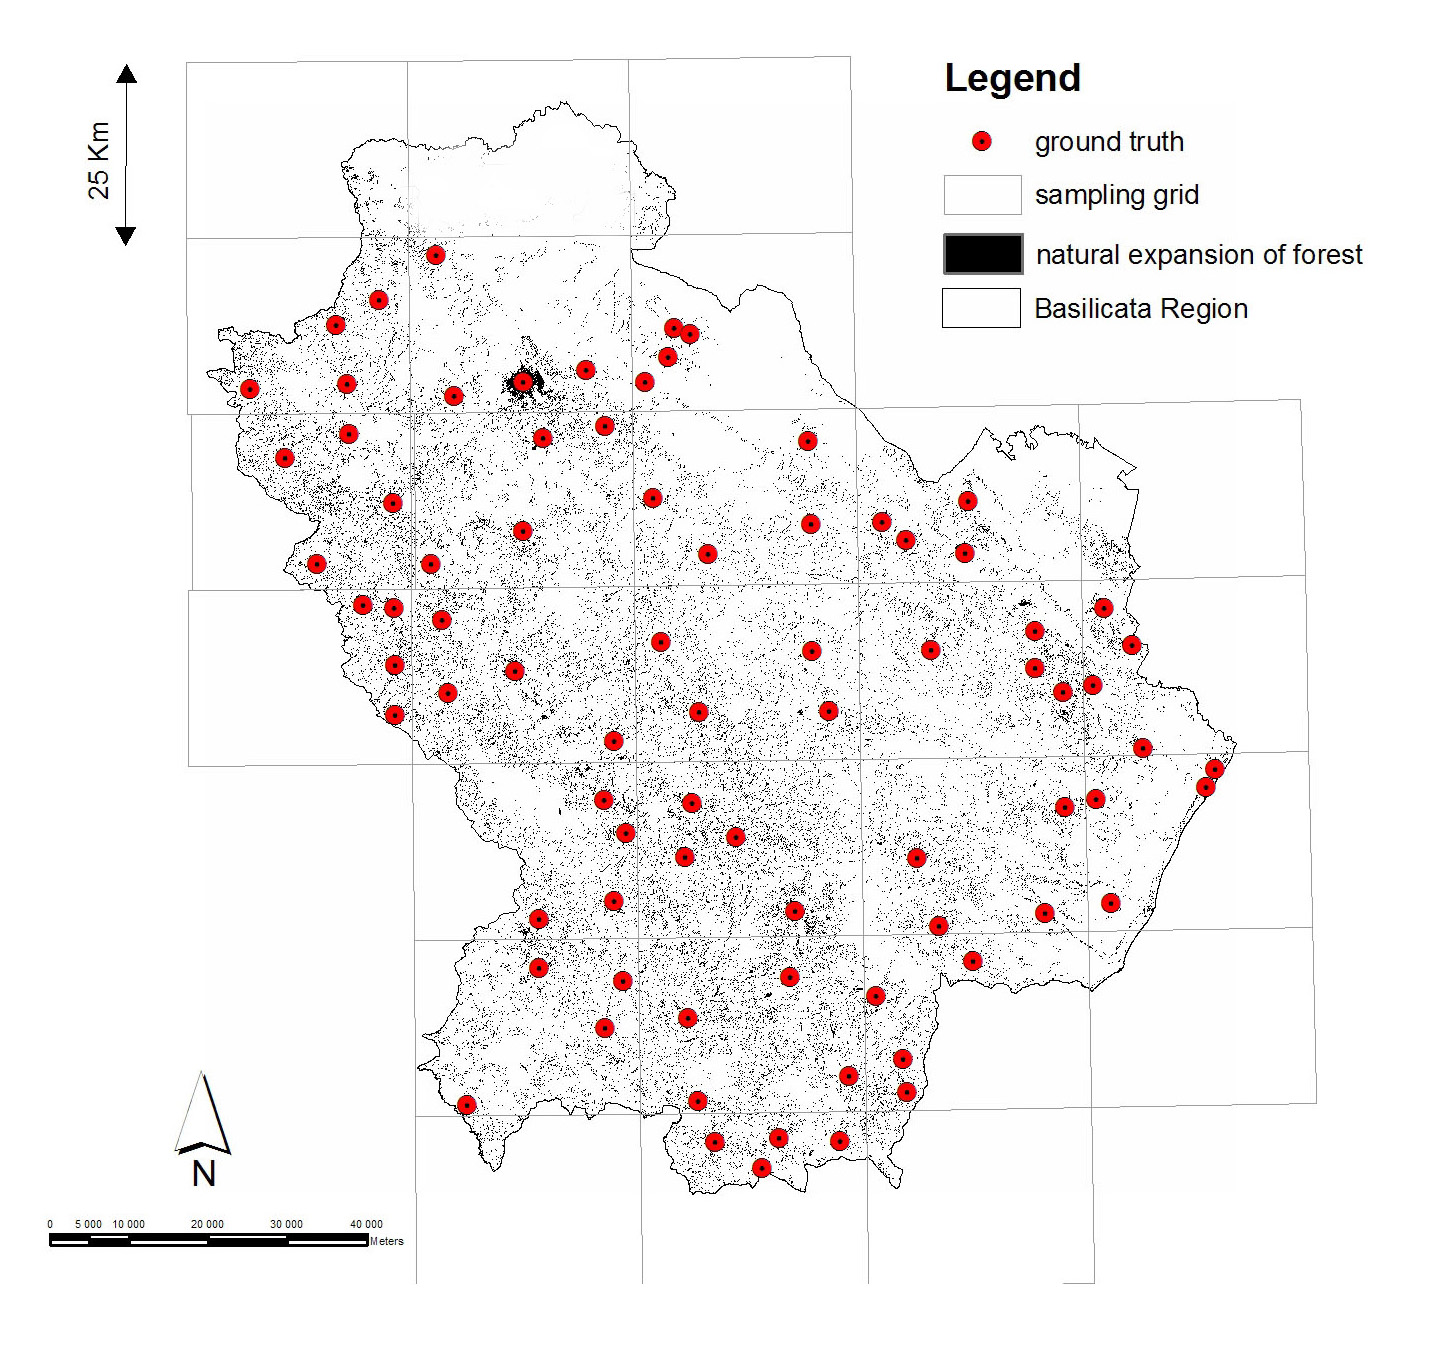
Eighty points were selected by a random stratified sampling approach to validate the proposed methodology. The study area was divided into a 25 x 25 km grid (Fig. 4), with four validation points for each cell randomly chosen among the pixels with ΔNDVI > +1.5·σ. The random stratified sampling approach ensured good cover over the regional forest areas, and at the same time randomness of points within each grid cell. Each of the 80 points was ground-checked using GPS to validate the presence of natural forest expansion processes.
Results and Discussion
Natural expansion of forests in the Basilicata region study area was examined by the NDVI differencing approach. According to the purpose of the study, only positive variations of NDVI were considered, with the exclusion of negative changes that were considered negligible. In particular negative changes of NDVI, in terms of loss of forest cover, are mainly represented by forest fires accounting yearly for the 0.1% of total forest cover. Moreover, no deforestation processes are reported according to the Regional law which prevents any land use change on forest ecosystems.
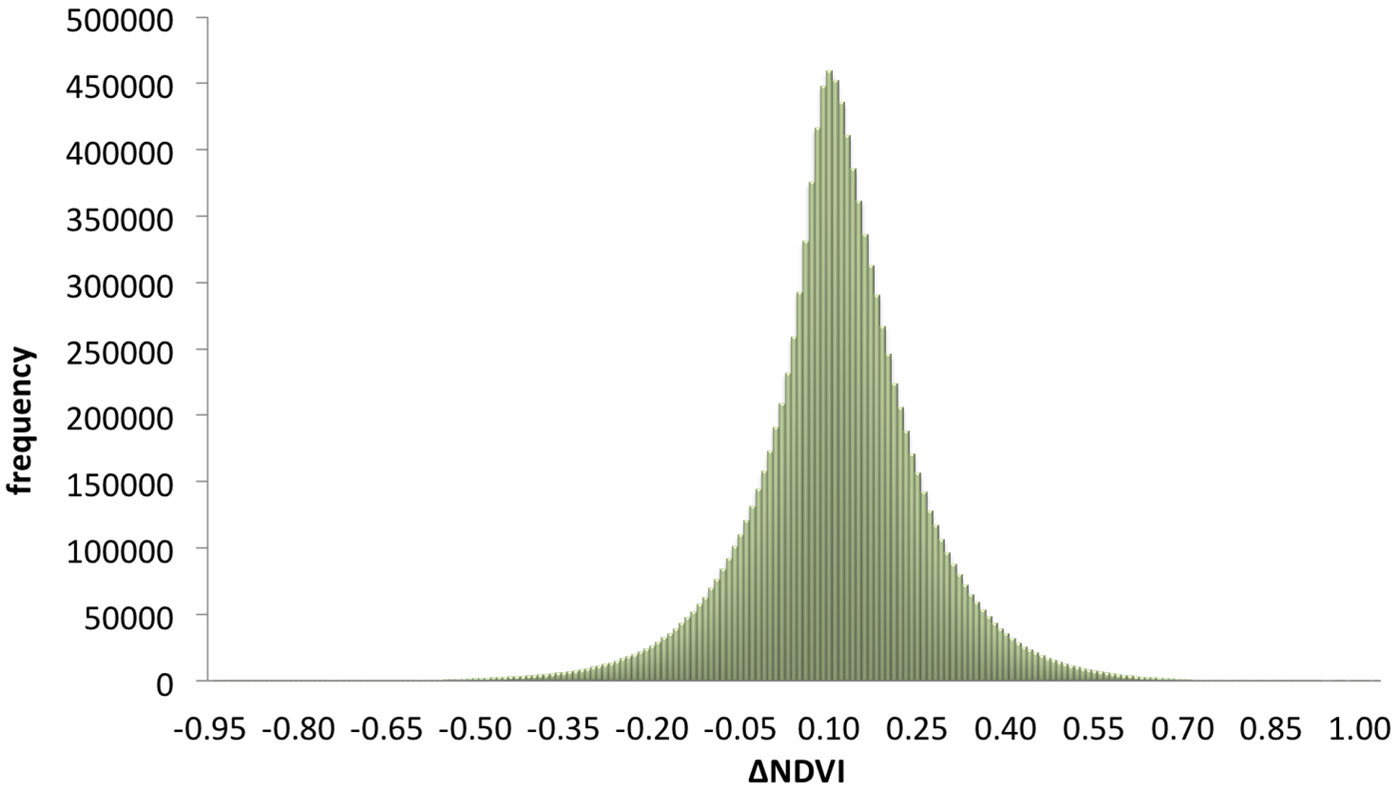
The main parameters of the distribution of ΔNDVI image values are reported in Tab. 1. Mean, mode, and median values were close to zero, as well as skewness, indicating a good distribution symmetry (Fig. 5). The goodness-of-fit of the ΔNDVI image values to a normal distribution was also verified by Kolmogorov-Smirov non-parametric test. Although the KS test indicates a departures from normal distribution (p > 0.01), it is still within the range normally accepted in the literature in order to be considered a normal or near-normal distribution.
Tab. 1 - Parameters of the distribution of the NDVI difference image values. (**): p < 0.01.
| Parameter | Value |
|---|---|
| Mean | 0.01 |
| Median | 0.01 |
| Mode | 0.011 |
| Standard Deviation | 0.101 |
| Skewness | -0.127 |
| St. Error of Skewness | 0.025 |
| Kurtosis | 1.927 |
| St. Error of Kurtosis | 0.049 |
| KS Test | 0.0756** |
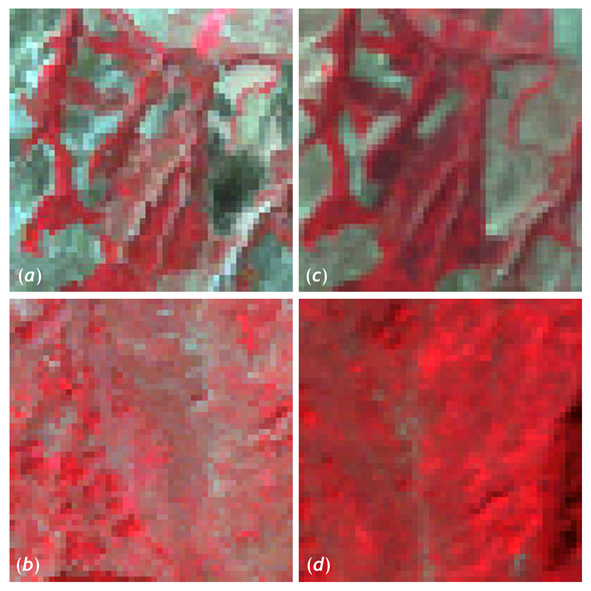
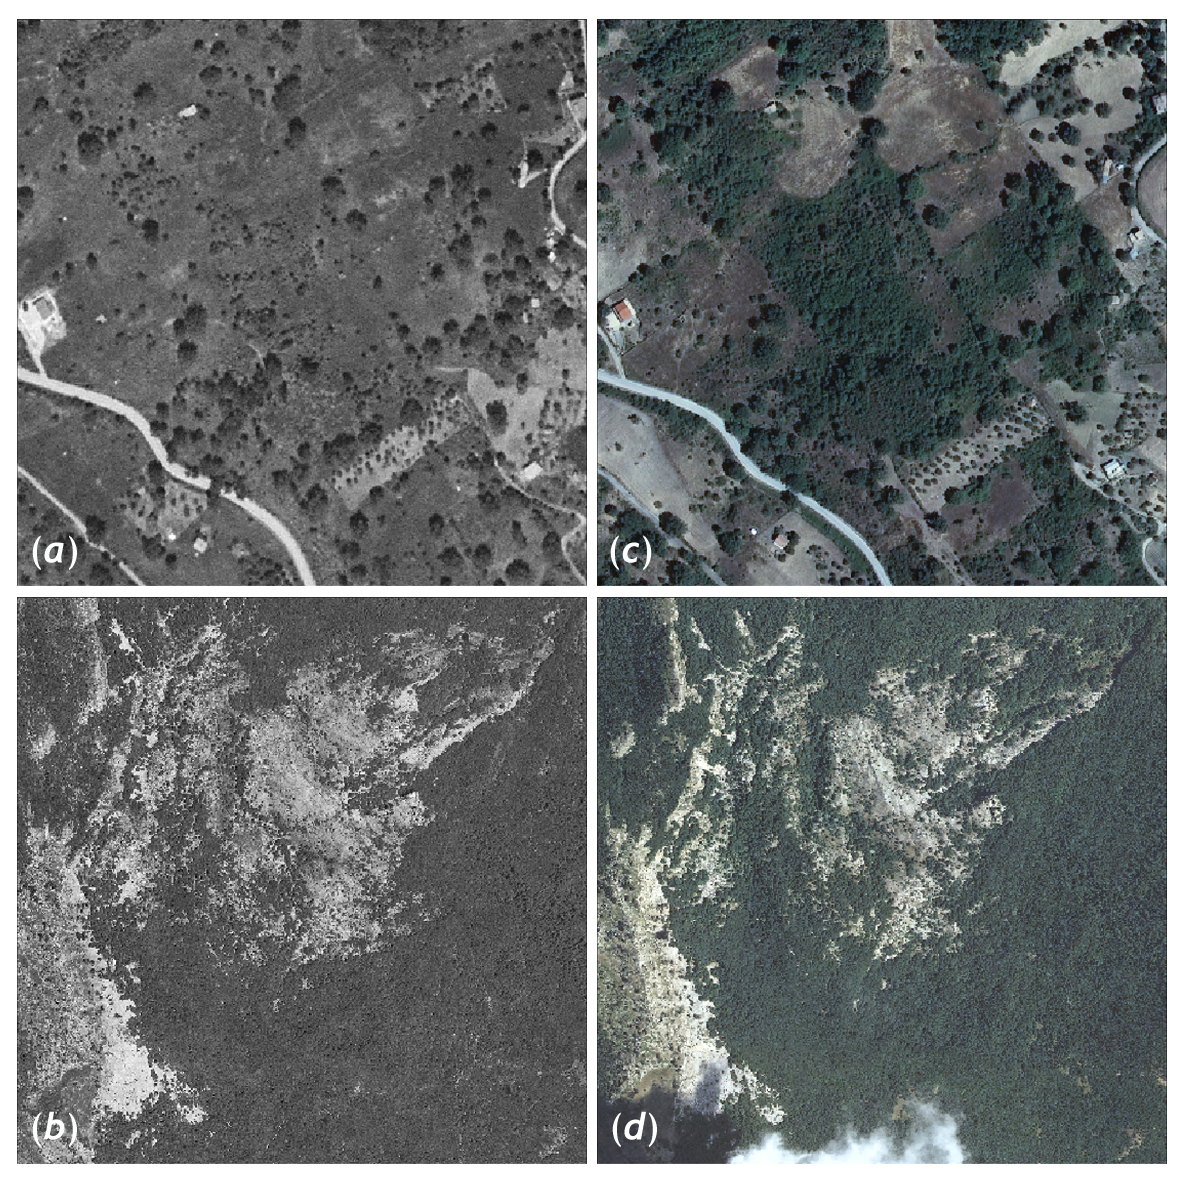
Threshold detection was carried out through visual analysis of Landsat TM RGB band compositions and ratios and their comparison across the two year considered (Fig. 6). The area of actual natural forest expansion was also better identified by comparing the digital aerial orthophotos (1994-2008 - Fig. 7). The best accuracy in the detection of natural forest expansion was obtained using a threshold of 1.5·σ with ΔNDVI = μ +1.5·σ, as reported in Tab. 2.
Fig. 6 - Comparison of Landsat TM RGB band compositions (TM4-3-2) of two test areas for the year 1984 (a, b) and 2010 (c, d).
Fig. 7 - Comparison of digital aerial orthophotos for two test areas based on images from Volo Italia 1994 (a, b) and TerraItaly 2008 (c, d).
Tab. 2 - Threshold value accuracy assessments. The producer’s accuracy refers to the probability of land-cover classification accuracy. (a): Error of natural expansion of forest classified as others; (K): Cohen’s Kappa inter-rater agreement coefficient.
| Threshold | Producer’s Accuracy |
Overall Accuracy |
Error (a) (%) |
Overall K |
|---|---|---|---|---|
1σ |
0.88 | 0.83 | 13.9 | 0.23 |
1.5σ |
0.95 | 0.94 | 5.1 | 0.61 |
2σ |
0.8 | 0.77 | 25.2 | 0.1 |
This result is consistent with that obtained by similar studies using the same methodology. In particular, the above test and trial approach was applied to detect vegetation changes due to human-induced rapid land use alterations in tropical forest ecosystems as reported by Miller et al. ([68]) in Thailand, Phuaa et al. ([77]) in Malaysia, and Sinch ([94]) in India based on Landsat imagery. In addition, Hayes & Sader ([37]) in Guatemala, and Petit et al. ([76]) and Braimoh & Vlek ([9]) in Africa applied the same technique to detect forest clearing and vegetation regrowth.
The trial and test approach was also used in forest management for clear-cuts and regrowth detection in temperate forest ecosystems ([5], [37]), and for the identification of selective logging ([104]). Sepehry & Liu ([89]) used symmetric threshold identification by testing threshold values ranging between 1·σ and 2·σ to monitor land cover change induced by flood, while Sarp ([86]) used 1·σ threshold to detect vegetation change and main environmental effects of surface mining activities. Jomaa & Bou Keir ([49]) reported anthropogenic land use change detection with the trial and test approach, and determined 2·σ was the optimal threshold value for two sites in Lebanon. Yacouba et al. ([105]) applied 1·σ in Yunnan province (China), while Podeh et al. ([80]) and Coban et al. ([15]) ascertained 2·σ was the optimal value for land use change detection over complex vegetation cover. Finally, Pu et al. ([81]) tested different threshold values ranging between 1·σ and 2·σ to determine real changes in sparse vegetation cover composed of shrubby trees colonizing riparian areas in Nevada. In some cases, the threshold identification was obtained from extreme percentile values of the NDVI difference image for evaluation of vegetation changes in drainage basin forests ([30], [62]), or forests in hydrogeologically unstable areas ([24]). Other more complex threshold identification methods have been recently proposed ([66], [10], [11], [38], [42], [8], [1]). Nevertheless, due to its simplicity, the image thresholding method based on standard deviation remains the most commonly used method for the detection in vegetation changes.
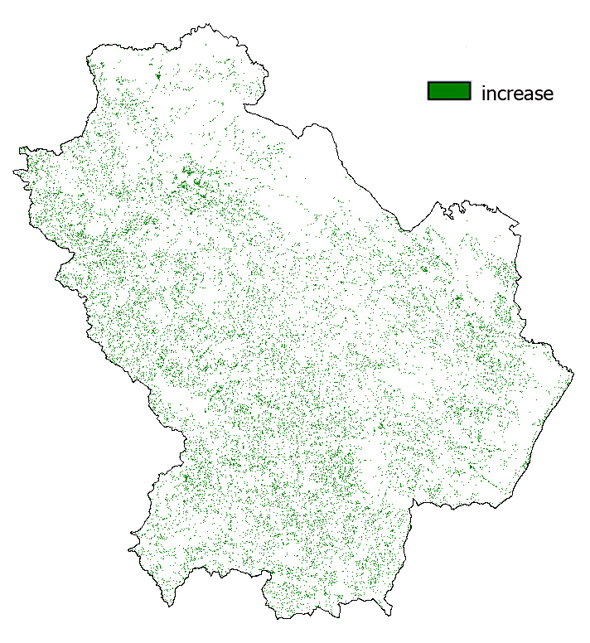
Based on the results obtained in this analysis, the ΔNDVI > +1.5·σ image was extracted and clipped using the Basilicata Region Forest Map mask with a 100 m buffer as specified in the Material and Methods. The resulting image (Fig. 8) shows the areas of likely natural forest expansion used for the identification of the ground validation points based on the random stratified sampling.
Among the 80 ground validation points selected, only six were not accessible due to topographic constraints. As for the remaining 74 points (Tab. 3), the vegetation changes detected were the result of natural forest expansion processes in 91.9% of the cases (68 points), while in 8.1% (6 points) the proposed method failed to detect natural forest expansion. In two cases, the failure was due to the coppice revegetation after harvesting; in a single case, the vegetation change was determined by conifer afforestation in a degraded broadleaf forest. Other sources of error were related to revegetation after a fire event in Mediterranean Macchia (one point), and incorrect attribution of land cover classes (an olive grove in one case). One last source of error was related to a strong NDVI increase within a forest stand, likely the result of a significant increase in forest density, or to enhanced environmental conditions for growth in recent years. In this specific case, the source of error could be related to quality differences between the two images analyzed. Overall, the accuracy of the ground-based validation reported in Tab. 3 is consistent with that reported in other studies using the NDVI differencing technique ([37], [80], [2], [81], [102]).
Tab. 3 - Ground-truth validation results.
| Cover type | Samples (n) |
Accuracy (%) |
Characteristics |
|---|---|---|---|
| Natural afforestation |
68 | 91.8 | - |
| Others | 6 | 8.1 | Forest harvesting (2), conifer afforestation in broadleaf forest (1), revegetation after forest fire (1), other land covers (2) |
| Total | 74 | 100 | - |
Our results indicated that in the period 1984-2010 approximately 70 154 ha were affected by natural forest expansion processes in the study area, with an annual forest cover increase of 2698 ha (Tab. 4). Given the actual forest cover extension (355 367 ha) as provided by the Basilicata Region Forest Map ([22]), the increase of forest cover between 1984 and 2010 was approximately 19.7%. Similar figures may be obtained by comparing forest cover extensions from two consecutive Nation Forest Inventories carried out in Basilicata over the same period (294 300 ha - [41]; 356 426 ha - [43]). The difference between the two above inventories (62 126 ha of increase in forest cover) was very close to the value reported in the present study (70 154 ha). The difference between the two latter estimates (8028 ha) may be explained by a further forest expansion occurred over the five years intervening between the last National inventory (2005) and the 2010 Landsat TM image used as reference in this analysis.
Tab. 4 - Comparisons between natural afforestation from NDVI differencing methodology and inventory forest cover increments.
| Method | Forest cover increment ha (%) |
Forest cover annual increment (ha yr-1) |
|---|---|---|
| NDVI differencing (1984 - 2010) | 70154 (19.7) |
2698 |
| National Forest Inventories (1984 - 2005) | 62126 (17.4) |
2958 |
| Difference between methods | 8028 (2.3) |
- |
Values of natural forest expansion obtained in this study are slightly higher than those reported by the IUTI (Inventario dell’Uso delle Terre) land use inventory for the Basilicata region in the period 1990-2008 ([21]). However, this discrepancy may be explained. First, the overall forest cover extension reported by the IUTI inventory for the study area was lower (331 667 ha, approximately 0.7%) than that provided by the Basilicata Region Forest Map (-6.7%), since the latter was based on continuous field recognition rather than on sampling points as for the former. Furthermore, the different time span analyzed (1990-2008 vs. 1984-2010) may accidentally include different trends in main drivers of natural forest expansion, such as forest growth patterns or land abandonment in marginal areas.
Our results also emphasizes some important characteristics of the natural forest expansion in the study area. Indeed, it occurs in areas characterized by severe climate, morphological, and pedological conditions. In 11.4% of the cases analyzed, forest expansion has been detected in areas affected by extreme temperatures (annual mean temperature between 16-18 °C), and in 28.3% of cases in areas with average annual rainfall of 500-700 mm. According to the Bagnouls & Gaussen ([3]) index (BGI), 20.8% of natural forest expansion occurred in dry areas with BGI 50-130. These results were also cross-classified with the ESA (Environmental Sensitive Areas) map ([6], [52], [28], [29]), which presented trends in natural forest expansion. According to the ESA classification, natural forest expansion occurred within the vulnerability class F (Fragile - 29.7%) and class C (Critical - 3.2%).
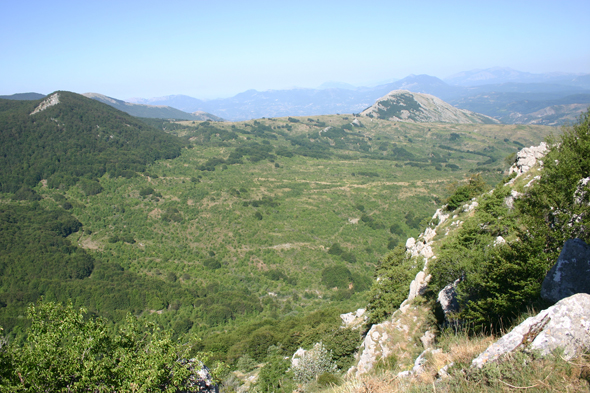
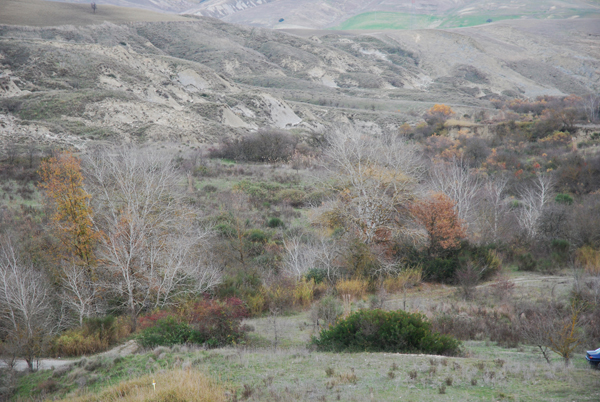
Our results also support some interesting consideration on the vegetation types subject to natural forest expansion. Although 48.9% of the increment was due to deciduous oak forests, a consistent part of it occurred in the meso/thermophiles component of this vegetation type. Furthermore, natural forest expansion occurred for the Mediterranean macchia (11.4%) and garrigue (2%). Beech forests (Fig. 9) and Mediterranean macchia (Fig. 10) in drought-prone Calanchi areas also showed a natural forest expansion in cattle-raising abandoned areas generally covered by shrubbery followed by tree restoration. The above results highlight the natural forest expansion occurring on degraded and drought-prone soils of the Mediterranean areas, a regions considered highly vulnerable to desertification. Due to their intrinsic ecologic interest, these areas require further study to examine their vegetation potential and dynamics.
Fig. 9 - Natural forest expansion on abandoned cattle-raising area for Beech forest in the Pollino National Park area.
Fig. 10 - Natural forest expansion of the Mediterranean macchia vegetation type in a drought-prone Calanchi area.
Conclusions
The present study demonstrated how satellite-based detection of vegetation change can provide reliable results in the assessment of natural expansion of forests and of forest cover dynamics. The validation of the method used by visual analysis of aerial orthophotos and comparison with ground-level sampling control points allowed a reliable identification of vegetation changes due to natural forest expansion. Finally, the relative simplicity of the methodology and the availability of time series Landsat TM images at low cost favors the application of the approach described to large scale forest inventories. Our results also emphasized the current natural forest expansion occurring in drought-prone Mediterranean areas, always considered as highly vulnerable to desertification, and therefore difficult to be managed for purposes of environmental protection. The information on forest cover dynamics provided in this study can be considered a useful starting point to further analyze spatial and temporal patterns of vegetation changes in degraded areas.
Acknowledgements
This research was supported by Italian MIUR (PRIN-20085FL4E4_002) “Quantifying carbon stock changes in revegetated forests stands in the Mediterranean environments” (P.I. Agostino Ferrara).
References
Gscholar
Gscholar
Gscholar
Gscholar
Gscholar
Gscholar
Gscholar
Gscholar
Online | Gscholar
Gscholar
CrossRef | Gscholar
Gscholar
Gscholar
Gscholar
Gscholar
Online | Gscholar
Gscholar
Gscholar
Gscholar
Gscholar
Gscholar
Gscholar
Gscholar
Gscholar
Gscholar
Gscholar
Gscholar
Gscholar
Gscholar
Gscholar
Gscholar
CrossRef | Gscholar
Gscholar
Gscholar
Gscholar
Gscholar
Gscholar
Gscholar
Gscholar
Gscholar
Gscholar
Gscholar
Gscholar
Gscholar
Gscholar
Gscholar
Authors’ Info
Authors’ Affiliation
Angelo Nolè
Francesco Ripullone
Agostino Ferrara
School of Agricultural, Forestry, Food and Environmental Sciences, University of Basilicata, v. N. Sauro 10, Potenza (Italy)
Corresponding author
Paper Info
Citation
Mancino G, Nolè A, Ripullone F, Ferrara A (2014). Landsat TM imagery and NDVI differencing to detect vegetation change: assessing natural forest expansion in Basilicata, southern Italy. iForest 7: 75-84. - doi: 10.3832/ifor0909-007
Academic Editor
Raffaele Lafortezza
Paper history
Received: Nov 20, 2012
Accepted: Sep 29, 2013
First online: Dec 18, 2013
Publication Date: Apr 02, 2014
Publication Time: 2.67 months
Copyright Information
© SISEF - The Italian Society of Silviculture and Forest Ecology 2014
Open Access
This article is distributed under the terms of the Creative Commons Attribution-Non Commercial 4.0 International (https://creativecommons.org/licenses/by-nc/4.0/), which permits unrestricted use, distribution, and reproduction in any medium, provided you give appropriate credit to the original author(s) and the source, provide a link to the Creative Commons license, and indicate if changes were made.
Web Metrics
Breakdown by View Type
Article Usage
Total Article Views: 87384
(from publication date up to now)
Breakdown by View Type
HTML Page Views: 66433
Abstract Page Views: 6079
PDF Downloads: 12905
Citation/Reference Downloads: 169
XML Downloads: 1798
Web Metrics
Days since publication: 4396
Overall contacts: 87384
Avg. contacts per week: 139.15
Article Citations
Article citations are based on data periodically collected from the Clarivate Web of Science web site
(last update: Mar 2025)
Total number of cites (since 2014): 96
Average cites per year: 7.38
Publication Metrics
by Dimensions ©
Articles citing this article
List of the papers citing this article based on CrossRef Cited-by.
Related Contents
iForest Similar Articles
Research Articles
Change Detection methods for forest expansion assessment in the last twenty years in the Mediterranean Basin
vol. 18, pp. 69-78 (online: 16 April 2025)
Review Papers
Remote sensing-supported vegetation parameters for regional climate models: a brief review
vol. 3, pp. 98-101 (online: 15 July 2010)
Technical Reports
Detecting tree water deficit by very low altitude remote sensing
vol. 10, pp. 215-219 (online: 11 February 2017)
Research Articles
Afforestation monitoring through automatic analysis of 36-years Landsat Best Available Composites
vol. 15, pp. 220-228 (online: 12 July 2022)
Review Papers
Accuracy of determining specific parameters of the urban forest using remote sensing
vol. 12, pp. 498-510 (online: 02 December 2019)
Research Articles
Assessing water quality by remote sensing in small lakes: the case study of Monticchio lakes in southern Italy
vol. 2, pp. 154-161 (online: 30 July 2009)
Review Papers
Remote sensing of selective logging in tropical forests: current state and future directions
vol. 13, pp. 286-300 (online: 10 July 2020)
Research Articles
Estimation of aboveground forest biomass in Galicia (NW Spain) by the combined use of LiDAR, LANDSAT ETM+ and National Forest Inventory data
vol. 10, pp. 590-596 (online: 15 May 2017)
Research Articles
Modelling the moisture status of habitats by using NDVI on the example of the Cerrado and Atlantic Forest biomes borderland (Brazil)
vol. 18, pp. 375-381 (online: 16 December 2025)
Research Articles
Modelling dasometric attributes of mixed and uneven-aged forests using Landsat-8 OLI spectral data in the Sierra Madre Occidental, Mexico
vol. 10, pp. 288-295 (online: 11 February 2017)
iForest Database Search
Search By Author
Search By Keyword
Google Scholar Search
Citing Articles
Search By Author
Search By Keywords
PubMed Search
Search By Author
Search By Keyword

