Use of BIOME-BGC to simulate water and carbon fluxes within Mediterranean macchia
iForest - Biogeosciences and Forestry, Volume 5, Issue 2, Pages 38-43 (2012)
doi: https://doi.org/10.3832/ifor0605-009
Published: Apr 02, 2012 - Copyright © 2012 SISEF
Research Articles
Abstract
The biogeochemical model BIOME-BGC is capable to estimate the main ecophysiological processes characterising all terrestrial ecosystems. To this aim it needs to be properly adapted to reproduce the behaviour of each biome type through a calibration phase. The aim of this paper is to adapt BIOME-BGC to reproduce the evapotranspiration (ET) and photosynthesis (GPP) of Mediterranean macchia spread all over Italy. Ten different sites were selected in the Centre-South of Italy and their gross primary production (GPP) was estimated by applying a parametric model, C-Fix, based on remotely sensed data for ten years (1999-2008). These monthly data were then used to calibrate BIOME-BGC through an iterative process which led to reproduce the spatial and temporal GPP variations found by C-Fix. The calibrated model was then applied to simulate the ET and GPP of two Italian sites characterised by the presence of an eddy flux tower; its performances were evaluated against ground data by common statistics. The results obtained indicate that, after a proper calibration phase, BIOME-BGC can be applied to estimate the evapotranspiration and photosynthesis of Mediterranean macchia with a good accuracy, strictly dependent on the input data utilised.
Keywords
Evapotranspiration, Gross primary production, C-Fix, E-OBS dataset
Introduction
One of the most important research themes in global ecology is related to the study of water and carbon fluxes within terrestrial ecosystems. This is fundamental to understand the effects of global change on vegetation and consequently apply sustainable management practices ([29]). Several studies have been carried out on this subject concerning in particular forest ecosystems (e.g., [10], [31]).
As reported by IPCC ([15]), quantifying the amount of forest carbon pools and their variation during time is of fundamental importance in the Mediterranean area, which is one of the most vulnerable to global change. Mediterranean macchia is a particular biome type which is spread all around the Mediterranean basin. In Italy it covers wide areas in the centre and in the south and is therefore a potential carbon sink, but little is known about its capacity to store carbon. These areas are potentially characterised by consistent changes in time; the surface covered by macchia is supposed to increase as a response to land abandonment and, in some cases, forest degradation and to decrease when evolving towards different forest types in successional ecosystems trends ([16]).
To quantify the water and carbon fluxes within terrestrial ecosystems on a regional scale, the most common approach is based on the use of models of ecosystem processes, often integrated with remotely sensed data (e.g., [21], [9]). Among these simulation models, BIOME-BGC was largely applied to simulate the behaviour of different forest types for monitoring and predicting purposes (e.g., [5]). In general, this model was chosen for its suitability to provide information on water, carbon and nitrogen cycles within forest and non-forest ecosystems and for its relative simplicity in reproducing vegetation processes based on biome-types ([24], [30]).
So far, BIOME-BGC has never been applied to simulate the behaviour of Mediterranean macchia. Therefore, its operational application for estimating the water and carbon fluxes of macchia requires a preliminary calibration procedure to adapt the model to this new biome type. Following Chiesi et al. ([4]), this operation can be carried out using monthly photosynthesis (GPP) estimates derived from an NDVI-based parametric model (Modified C-Fix), which was recently demonstrated to accurately depict productivity features of existing Italian forests ([28], [19]).
The current paper aims at adapting BIOME-BGC to simulate the main processes of Mediterranean macchia. The paper first describes the study areas and data considered. Next, the properties of BIOME-BGC are briefly introduced together with the data processing steps applied. In particular this section is divided into:
- the calibration phase, conducted with the objective of identifying the optimal model configuration for Mediterranean macchia;
- the validation phase, consisting in applying the original and the calibrated versions of BIOME-BGC in two additional sites for which independent data of evapotranspiration (ET) and GPP exist. These are used to test the accuracy of the model estimates.
The paper finally illustrates the problems encountered and discusses future perspectives of the work.
Study areas
Italy is geographically situated between 36° and 47°30’ North latitude and between 5°30’ and 18°30’ East longitude. Its orography is irregular and characterised by the presence of two main mountain chains, the Alps in the north and the Apennines in the centre-south. The climate is variable following the latitudinal and altitudinal gradients and the distance from the sea: in general, it ranges from Mediterranean Warm to Temperate Cool ([3]). Following the above gradients, also the land cover is changing, ranging from agricultural areas to forests and pastures.
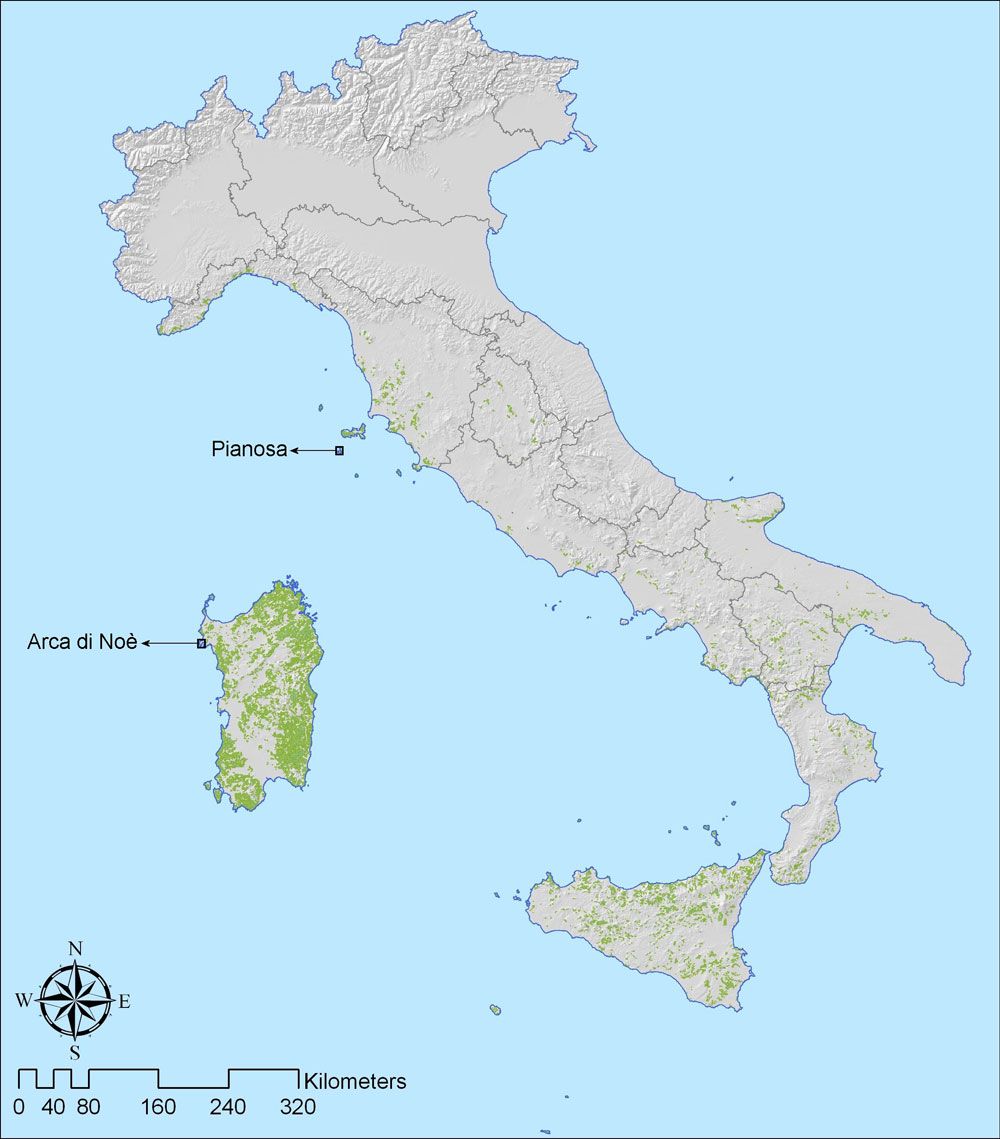
As regards Mediterranean macchia (Fig. 1), this is spread all over Italy especially in the centre and in the south. Its presence is linked to particular ecological conditions (e.g., rocky soils, warm climate) and/or past utilization (e.g., abandoned fields, forest fires). Following the CORINE Land Cover map from the European Environmental Agency at the year 2006, the shrub ecosystems dominated by sclerophyllous vegetation (class 323) cover approximately 10 000 km2 ([16]). According to FAO ([12]), macchia is the most extended type of Other Wooded Land, which covers 17 083 km2 against a forest area of 87 592 km2 ([14]).
Fig. 1 - Distribution of shrub ecosystems dominated by sclerophyllous vegetation (class 323 from Corine Land Cover 2006) all over Italy, with indication of the two areas used for the validation (Arca di Noè and Pianosa).
Two specific sites, for which ET and GPP reference data are available, have been used to test the accuracy of the calibrated version of BIOME-BGC. The first test site is located inside a natural reserve called “Le Prigionette”, also known as “Arca di Noè” (40.6° N lat., 8.15° E long., 28 m a.s.l.), an area situated in the north-western portion of the Sardinia island. Long-term weather records indicate that annual mean temperature is 15.9 °C, mean minimum temperature is 7 °C, and mean maximum temperature is 28 °C. Precipitation is mainly concentrated in spring and the mean total annual amount is 588 mm. During autumn, there are often intense rainstorms with high runoff and low water storage ([18]). The soil is 0.3-0.4 m deep Lithic Xerorthent, which is mainly composed of clay with high erodibility. The prevalent species of this site are Juniperus phoenicea L. (53%), Pistacia lentiscus L. (22%), and Phyllirea angustifolia L. (6% - see ⇒ http://fluxnet.ornl.gov/). The species form a sparsely vegetated shrub land and they are aggregated into variable sized patches. The vegetation is a secondary succession following a fire event in 1963 and agricultural abandonment in 1970. Currently, the area has limited human activity. The mean vegetation height ranges from 0.9 to 1.8 m. Ground cover varies between 45% and 95% ([18]).
The second test site (42.58° N lat., 10.05° E long.) corresponds to a Mediterranean macchia placed on the Pianosa Island (Fig. 1). Based on data collected during the years 1951-2009, the average yearly temperature is 15.8 °C and the mean annual rainfall is 497 mm, mainly distributed from October to December ([27]). The thin soil layer of Pianosa is a Leptosols ([17]), sandy to loamy sandy, alkaline and rich of carbonate ([2]). Most of the island surfaces have been long used for agricultural activities, which ceased about 20 years ago. These areas are now being reinvaded by Mediterranean macchia, which is interspersed with abandoned fields and pastures and with small patches of other tree species ([11]). The prevalent species of the macchia is Juniperus phoenicea L. (50-75%); other species are Rosmarinus officinalis L., Bromus fasciculatus Presl., Pistacia lentiscus L. (50-25% - [8]).
Study data
Ancillary data
A Digital Elevation Model (DEM) of Italy with a pixel size of 1 km2 was used. This DEM was projected in the UTM-32 North reference system, which was taken as standard for processing all other information layers.
Daily meteorological data to run the model BIOME-BGC for the years 1999-2008 were derived by the E-OBS dataset (version 4.0), a high resolution gridded dataset funded by the EU-FP6 ([13] - see ⇒ http://E-OBS-eu.metoffice.com/). These data were originally provided at 0.25° spatial resolution and then downscaled to 1 km by applying a locally calibrated regression procedure to the mentioned DEM ([20]). Their accuracy was evaluated by comparison with data measured by ten ground meteorological stations spread over the Italian territory (see [20]): a general overestimation of minimum temperatures and underestimation of rainfall was observed. These patterns, however, have little influence on the application of BIOME-BGC, which is mainly driven by maximum temperature; as regards precipitation, it mainly affects areas with high summer water stress.
Finally, a digital map of Mediterranean macchia was derived from the original CORINE Land Cover 2006 map of Italy ([16]). This map was produced by manual photointerpretation of Landsat imagery supported by ancillary information. Also in this case the original map was rasterized at 1 km spatial resolution (Fig. 1).
Monthly maps of GPP
The reference data of GPP utilized to calibrate BIOME-BGC were produced using the modified C-Fix model, which is fully described in Maselli et al. ([19]). The accuracy of this Monteith type model had already been evaluated by comparison with ground data of GPP obtained from numerous Italian eddy covariance flux towers ([19]). These reference monthly maps covered all Italian forests and were available for the years 1999-2008 at 1 km spatial resolution.
Macchia reference data
In Italy there are three sites covered by Mediterranean macchia for which data of water and carbon fluxes are available: Tolfa (42.18° N lat., 11.93° E long.), Arca di Noè and Pianosa Island. The data of Tolfa were collected in a former study on the effect of water stress on plants ([1]), and were excluded from the current analysis because the site was irrigated or artificially dried.
Reference evapotranspiration and photosynthesis values of the other two sites were derived from the existing towers measuring carbon fluxes by the eddy correlation technique. The daily ET and GPP values are available for different periods (2004-2008 for Arca di Noè and 2007-2008 for Pianosa Island). Both for Arca di Noè and Pianosa Island, mean annual ET is about 530 mm y-1 and GPP is about 1100 g C m-2 y-1. Further information on these sites can be found online at ⇒ http://fluxnet.ornl.gov/.
Methods
The model BIOME-BGC
BIOME-BGC is a bio-geochemical model developed at the University of Montana, which is freely distributed on the web. It can estimate the storage and fluxes of water, carbon and nitrogen within terrestrial ecosystems ([24]). It requires daily climate data (minimum and maximum temperature, precipitation and solar radiation), information on the general environment (i.e., soil depth and texture, vegetation and site conditions) and parameters describing the ecophysiological characteristics of the biome type considered. BIOME-BGC is capable of finding a quasi-climax equilibrium with local eco-climatic conditions through the spin-up phase, whose aim is to quantify the initial amount of all carbon and nitrogen pools; after that, it simulates all respiration and allocation processes corresponding to the requested simulation years ([30], [7]).
The version of the model currently used (ver. 4.2) includes complete parameter settings for different groups of biomes (i.e., evergreen neddleleaf, evergreen broadleaf, deciduous broadleaf, shrub, C3 and C4 - [30]). These settings, however, must be modified to adapt to specific ecosystems, particularly in Mediterranean environments, which have eco-climatic features markedly different from those for which the model was originally developed ([4]).
Calibration of BIOME-BGC
The calibration of BIOME-BGC was carried out by adjusting its monthly GPP outputs to reproduce the relevant C-Fix GPP estimates used as reference data (see also [4]). To this aim ten different sites characterised by the presence of macchia were selected using the 1-km CORINE Land Cover map of Italy. The criteria applied for this selection were geographic (points have to be at different altitudes and distributed in the centre-south of Italy - Tab. 1) and structural (the macchia fractional cover has to be close to 100%). For each point, monthly GPP data were extracted from the available maps for the years 1999-2008 (10 plots x 10 years x 12 months), covering most relevant spatial and temporal (intra and inter-year) variability over the study region ([19]).
Tab. 1 - Position and altitude of the ten selected points characterized by macchia cover.
| ID | Latitude (° N) |
Longitude (° E) |
Altitude (m a.s.l.) |
|---|---|---|---|
| 1 | 43.25 | 10.82 | 342 |
| 2 | 42.90 | 11.13 | 166 |
| 3 | 41.78 | 14.16 | 1185 |
| 4 | 40.25 | 16.27 | 281 |
| 5 | 38.10 | 15.75 | 885 |
| 6 | 38.20 | 15.53 | 243 |
| 7 | 38.15 | 13.13 | 454 |
| 8 | 37.46 | 13.44 | 265 |
| 9 | 40.87 | 9.57 | 114 |
| 10 | 39.91 | 9.63 | 304 |
BIOME-BGC was therefore applied to simulate the GPP behaviour of all study plots by using the available environmental and meteorological information. Among the BIOME-BGC initialization parameters, only those related to geographical position and terrain morphology were modified for each plot. Due to the lack of relevant information for all selected areas, parameters related to soil features were kept equal to medium conditions. All simulations were performed running the model in a “spin-up and go” mode, i.e., preliminarily finding an internal equilibrium of the model state variables ([30]). Concerning the eco-physiological parameter settings, the first trials were performed using the default biome type parameterization (i.e., shrub - [30]). According to Chiesi et al. ([4]), the following trials were then carried out modifying the main parameters which regulate the resistance of forest species to summer drought (a typical Mediterranean feature) and altering the photosynthetic efficiency of macchia, with the modification of the leaf nitrogen content in Rubisco. The 1200 simulated monthly GPP values were regressed against the reference data obtained by C-Fix in order to find the lowest errors: these were considered indicative of the optimal reproduction of spatial and temporal GPP variations.
Evaluation of BIOME-BGC performances
The validation phase consisted of applying the calibrated BIOME-BGC model to the sites for which reference ET and GPP data were available (i.e., Arca di Noè and Pianosa).
The accuracy of model predictions are largely dependent on the quality of input data ([6]). In order to evaluate this quality, the 1-km downscaled daily meteorological data used for model initialization were tested against available measurements for the two validation sites. To this aim, the daily temperature and precipitation collected during the periods covered by ET and GPP data (i.e., 2004-2008 for Arca di Noè and 2007-2008 for Pianosa Island) were compared to the available daily estimates by conventional accuracy statistics (correlation coefficient: r; root mean square error: RMSE; and mean bias error: MBE). Only daily average temperature was available for Arca di Noè while for Pianosa Island both minimum and maximum temperatures were used; rainfall data were available for both sites.
After the data quality assessment described above, the downscaled daily meteorological data were utilised to preliminarily drive the algorithm MT-Clim ([26]) and compute solar radiation. The model BIOME-BGC was then applied for each site and the goodness-of-fit of its outputs onto ET and GPP reference data was evaluated by means of the same accuracy statistics as above (r, RMSE and MBE). The simulation accuracy at various temporal scales was assessed by computing the above statistics from data aggregated on daily, weekly and monthly basis.
Results
Calibration phase
The results obtained comparing reference and estimated GPP are shown in Fig. 2. The lowest root mean square error (indicated by the arrow therein) corresponds to a maximum stomatal conductance of 0.0018 m s-1.
Fig. 2 - RMSEs obtained comparing GPP values derived from modified C-Fix and BIOME-BGC. These errors refer to different settings of the model which correspond to variable maximum stomatal conductances at different levels of the fraction of leaf nitrogen in Rubisco (0.018, 0.021 and 0.024).
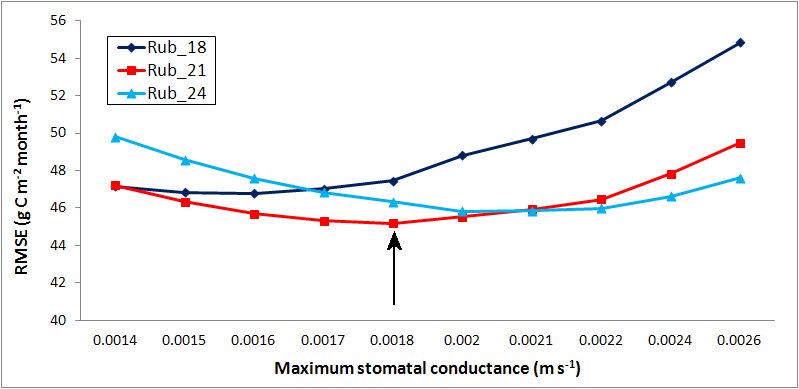
As regards the fraction of leaf nitrogen contained in Rubisco, the best results are obtained when it is set to 0.021.
Accuracy assessment
The comparison between downscaled meteorological data and the data measured by the flux tower for Arca di Noè indicates that the former provides good estimates of average temperature (r = 0.944, RMSE = 2.05 °C and MBE = 0.44 °C) with an underestimation of precipitation (total amount during the study period of 2486 against 2524 mm). In addition, the number of rainy days is not correctly identified.
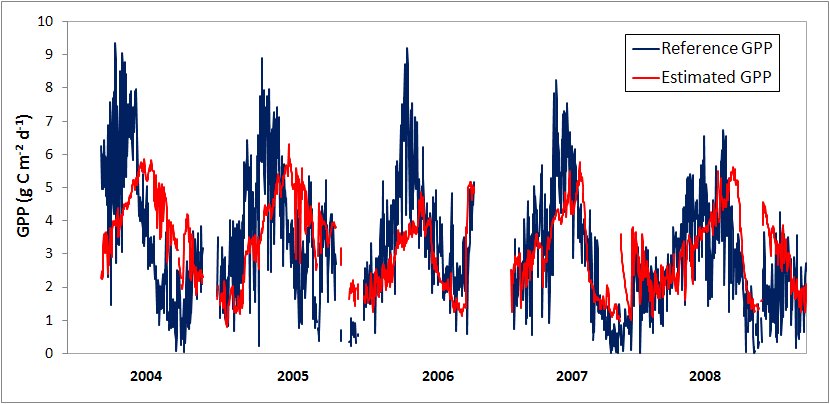
Fig. 3 shows the daily trend of reference GPP compared with the simulated estimates obtained from the modified settings. In general, GPP reference data reach a maximum in late spring while during summer the vegetation activity is reduced. A similar trend is found for the simulated GPP estimates, though a shift between the peaks of the two profiles is often observed, strictly depending on the years (i.e., it is more evident in 2004).
Fig. 3 - Reference and estimated daily GPP values at Arca di Noè test site for the period 2004-2008.
The results of the comparison between eddy flux tower data and BIOME-BGC estimates are shown in Tab. 2a and Tab. 2b for ET and GPP, repectively. These results are obtained using both the original and the modified settings of BIOME-BGC. The simulation of ET leads to errors of about 1.5 mm day-1 and rather low correlation coefficients (0.347 and 0.297 with the original and the modified settings, respectively). When the data are aggregated on weekly and monthly basis, r notably increases, reaching the maximum value of 0.607 for the original settings.
Tab. 2 - Statistics referred to evapotranspiration (a) and GPP (b) values computed on yearly, monthly and weekly basis for Arca di Noè site. The errors for ET are expressed in mm day-1, mm week-1 and mm month-1, those for GPP are in g C m-2 day-1, g C m-2 week-1 and g C m-2 month-1, respectively. (): correlation coefficient; (RMSE): root mean square error; (MBE): mean bias error. All correlation coefficients are highly significant with P < 0.01.
| Parameter | Time | Original settings | Modified settings | ||||
|---|---|---|---|---|---|---|---|
| r | RMSE | MBE | r | RMSE | MBE | ||
| (a) Evapotranspiration | Daily | 0.347 | 1.67 | -0.05 | 0.292 | 1.55 | -0.06 |
| Weekly | 0.556 | 6.94 | 0.26 | 0.502 | 5.75 | 0.28 | |
| Monthly | 0.607 | 22.05 | 1.35 | 0.554 | 17.59 | 1.27 | |
| (b) GPP | Daily | 0.508 | 1.65 | 0.96 | 0.501 | 1.61 | -0.02 |
| Weekly | 0.548 | 10.72 | 1.58 | 0.571 | 10.22 | 0.57 | |
| Monthly | 0.619 | 38.24 | 5.03 | 0.607 | 38.56 | 0.46 | |
The RMSEs are generally lower when the calibrated version is applied, while the MBEs are more or less stable. The same trends are observed for the simulation of GPP, though in this case the errors obtained with the modified settings are generally lower than those with the original ones (Tab. 2b).
For Pianosa Island, the downscaled daily meteorological dataset provides accurate estimates of maximum temperature (annual average of 22.4 °C vs. 22.8 °C; r = 0.962, RMSE = 2.18 °C and MBE = 0.46 °C), while it underestimates minimum temperature (11.8 °C vs. 15.0 °C; r = 0.85, RMSE = 4.65 °C and MBE = -3.22 °C). Concerning annual rainfall, the total amount is well estimated (annual estimate of 291 mm vs. 281 mm measured); also in this case the number of rainy days is not correctly estimated.
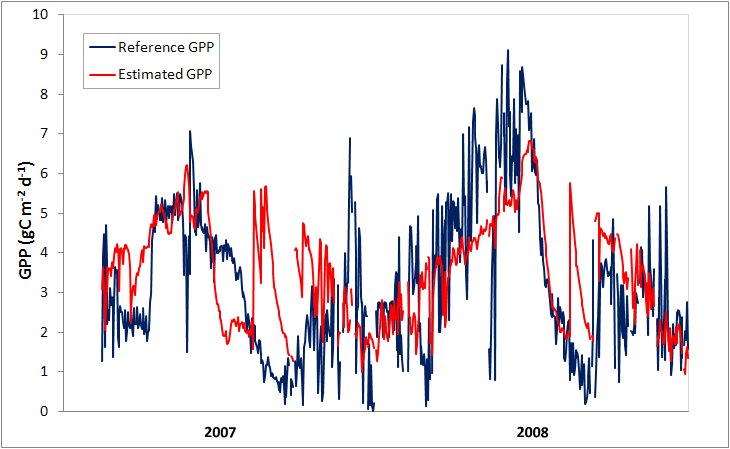
The daily values of measured and simulated GPP are shown in Fig. 4 for 2007 and 2008. The accuracy of model predictions is fairly satisfactory and the total annual amounts are very similar for the two dataset (r = 0.548, RMSE = 1.64 g C m-2 day-1 and MBE = 0.29 g C m-2 day-1). As shown by the same figure, the annual vegetation cycle is not accurately simulated by the model considered, thus some peaks of measured GPP are not reproduced by the model and vice versa.
Fig. 4 - Reference and estimated daily GPP values at Pianosa Island for the period 2007-2008.
The accuracy of the simulations obtained for ET and GPP by BIOME-BGC is reported in Tab. 3. In general, the correlation coefficients found using the original model settings are much lower than those found for the calibrated ones, for both the parameters considered. A better fitting is observed for the simulation of GPP than for ET. Also in this case, a remarkable increase in the accuracy of model predictions is observed considering different data aggregations (from daily to monthly), indicating that the general trend is captured by the model.
Tab. 3 - Statistics referred to evapotranspiration (a) and GPP (b) data computed on yearly, monthly and weekly basis for Pianosa Island. The errors for ET are expressed in mm day-1, mm week-1 and mm month-1, those for GPP are in g C m-2 day-1, g C m-2 week-1 and g C m-2 month-1, respectively. (r): correlation coefficient; (RMSE): root mean square error; (MBE): mean bias error. All correlation coefficients are highly significant with P < 0.01.
| Parameter | Time | Original settings | Modified settings | ||||
|---|---|---|---|---|---|---|---|
| r | RMSE | MBE | r | RMSE | MBE | ||
| (a) Evapotranspiration | Daily | 0.217 | 1.79 | -0.13 | 0.297 | 1.66 | -0.06 |
| Weekly | 0.261 | 8.73 | 0.57 | 0.415 | 7.39 | 0.98 | |
| Monthly | 0.398 | 24.83 | 1.61 | 0.576 | 21.56 | 3.90 | |
| (b) GPP | Daily | 0.271 | 2.04 | 0.37 | 0.548 | 1.64 | 0.29 |
| Weekly | 0.203 | 13.21 | 2.38 | 0.644 | 9.67 | -2.71 | |
| Monthly | 0.294 | 46.94 | -10.79 | 0.733 | 34.05 | 11.89 | |
Discussion and conclusions
BIOME-BGC is a powerful model of terrestrial ecosystem processes which requires an accurate calibration for each biome type and abundant information on the areas examined ([24]). The calibration phase applied in this work utilizes as reference data the monthly maps of GPP obtained by Maselli et al. ([19]) for the years 1999-2008. The reliability of these maps was assessed through comparison with monthly measurements of GPP collected by the eddy-covariance technique over eight Italian test sites; in general, the modified version of C-Fix is particularly suited for Mediterranean forest areas with more pronounced drought period. A different study evaluated the accuracy of the daily meteorological dataset which was needed to characterise the whole national territory and initialize the model ([20]).
This calibration phase brought to identify the parameter settings for BIOME-BGC. These settings cannot be directly compared to those of other macchia sites, due to the lack of similar previous studies on this ecosystem type. Both the maximum stomatal conductance and the fraction of leaf nitrogen in Rubisco identified, however, are slightly lower than those found for similar evergreen species (e.g., [25], [22]).
Reference ET and GPP values collected by the eddy-correlation technique were used for testing the performances of the calibrated model versus its original version with parameter settings for shrubs. The analysis of the results should take into account that the eddy covariance data used for the test might be affected by uncertainties due to the gap-filling and partitioning algorithms applied ([23]). Additionally, the reference data are not continuous during the investigated periods, suggesting difficulties in their collection for both sites (see also [6]). In order to reduce the possible effects of the above problems on our investigation, the simulation accuracy was assessed on data aggregated on daily, weekly and monthly basis. The results obtained indicate that the calibration procedure has improved the model capacity to reproduce both ET and GPP of Mediterranean macchia. Generally, the accuracy obtained for ET is lower than that obtained for GPP. This discrepancy may stem from problems in correctly reproducing the daily precipitation data compared to temperatures and, in particular, in identifying rainy days and estimating the total amount of precipitation per day.
The Arca di Noè site has a long time series of data, which allows to test the applicability of BIOME-BGC in years with different meteorological conditions. As shown in Fig. 3, the annual trend of variation for the parameters considered is fairly well reproduced, though a shift in the simulation of the GPP peaks was observed, especially at the beginning of the year (e.g., see 2004). This may be partly due to the errors which affect the used meteorological dataset.
The Pianosa study site is placed on a flat island which is being reinvaded by heterogeneous Mediterranean macchia. This condition is optimal to correctly apply the eddy covariance technique, but it is suboptimal to apply BIOME-BGC, which is suited to simulate the behaviour of spatially homogeneous ecosystems ([24]).
For both sites the accuracy of predictions for ET and GPP is improved with respect to that found for similar vegetation types in other studies (e.g., [6]). As regards the Pianosa Island, Chiesi et al. ([6]) obtained a correlation coefficient of 0.599 and an error of 67.43 g C m-2 month-1. The differences found between these and the current results current results (r = 0.733, RMSE = 34.05 g C m-2 month-1) are partly due to the daily meteorological data used as input, which are now more accurate, and to the different calibration of the model, which is currently obtained starting from the shrub biome-type in place of evergreen broadleaf forest.
Globally, the results obtained indicate that a properly calibrated version of BIOME-BGC can be adopted to predict both water and carbon fluxes of Mediterranean macchia on a monthly basis. This newly parameterized biome-type can contribute to describe the behaviour of Italian forest ecosystems in sight of monitoring and quantifying changes in forest production over years.
Acknowledgments
The work was carried out under the C_FORSAT project “Modelling the carbon sink in Italian forest ecosystems using ancillary data, remote sensing data and productivity models” (national coordinator: Prof. G. Chirici) funded by the FIRB2008 program of the Italian Ministry of Education, University and Research (code: RBFR08LM04). The authors wish to thank two anonymous reviewers and the subject editor of iForest, Prof. R. Tognetti, whose comments contributed to improve the first draft of the manuscript.
References
Gscholar
Gscholar
Gscholar
Gscholar
Gscholar
Gscholar
Gscholar
CrossRef | Gscholar
Gscholar
Gscholar
Gscholar
CrossRef | Gscholar
Authors’ Info
Authors’ Affiliation
EcoGeoFor - Università del Molise, Contrada Fonte Lappone snc, 86090 Pesche, IS (Italy)
IBIMET-CNR, Traversa la Crucca 3, Regione Baldinca, I-07100 Li Punti, SS (Italy)
Università degli Studi di Sassari, Dipartimento di Economia e Sistemi Arborei (DESA), Euro Mediterranean Center on Climate Change - CMCC, via De Nicola 9, I-07100 Sassari (Italy)
Corresponding author
Paper Info
Citation
Chiesi M, Chirici G, Corona P, Duce P, Salvati R, Spano D, Vaccari FP, Maselli F (2012). Use of BIOME-BGC to simulate water and carbon fluxes within Mediterranean macchia. iForest 5: 38-43. - doi: 10.3832/ifor0605-009
Academic Editor
Roberto Tognetti
Paper history
Received: Dec 05, 2011
Accepted: Mar 07, 2012
First online: Apr 02, 2012
Publication Date: Apr 30, 2012
Publication Time: 0.87 months
Copyright Information
© SISEF - The Italian Society of Silviculture and Forest Ecology 2012
Open Access
This article is distributed under the terms of the Creative Commons Attribution-Non Commercial 4.0 International (https://creativecommons.org/licenses/by-nc/4.0/), which permits unrestricted use, distribution, and reproduction in any medium, provided you give appropriate credit to the original author(s) and the source, provide a link to the Creative Commons license, and indicate if changes were made.

Web Metrics
Breakdown by View Type
Article Usage
Total Article Views: 57431
(from publication date up to now)
Breakdown by View Type
HTML Page Views: 46697
Abstract Page Views: 4024
PDF Downloads: 4933
Citation/Reference Downloads: 58
XML Downloads: 1719
Web Metrics
Days since publication: 5213
Overall contacts: 57431
Avg. contacts per week: 77.12
Article Citations
Article citations are based on data periodically collected from the Clarivate Web of Science web site
(last update: Mar 2025)
Total number of cites (since 2012): 9
Average cites per year: 0.64
Publication Metrics
by Dimensions ©
Articles citing this article
List of the papers citing this article based on CrossRef Cited-by.
Related Contents
iForest Similar Articles
Review Papers
Remote sensing-supported vegetation parameters for regional climate models: a brief review
vol. 3, pp. 98-101 (online: 15 July 2010)
Review Papers
Accuracy of determining specific parameters of the urban forest using remote sensing
vol. 12, pp. 498-510 (online: 02 December 2019)
Review Papers
Remote sensing of selective logging in tropical forests: current state and future directions
vol. 13, pp. 286-300 (online: 10 July 2020)
Technical Reports
Detecting tree water deficit by very low altitude remote sensing
vol. 10, pp. 215-219 (online: 11 February 2017)
Research Articles
Afforestation monitoring through automatic analysis of 36-years Landsat Best Available Composites
vol. 15, pp. 220-228 (online: 12 July 2022)
Research Articles
Assessing water quality by remote sensing in small lakes: the case study of Monticchio lakes in southern Italy
vol. 2, pp. 154-161 (online: 30 July 2009)
Review Papers
Remote sensing support for post fire forest management
vol. 1, pp. 6-12 (online: 28 February 2008)
Technical Reports
Remote sensing of american maple in alluvial forests: a case study in an island complex of the Loire valley (France)
vol. 13, pp. 409-416 (online: 16 September 2020)
Research Articles
Geostatistical techniques for estimating aboveground biomass in eastern Amazonia
vol. 19, pp. 85-93 (online: 13 March 2026)
Research Articles
Classification of xeric scrub forest species using machine learning and optical and LiDAR drone data capture
vol. 18, pp. 357-365 (online: 07 December 2025)
iForest Database Search
Search By Author
Search By Keyword
Google Scholar Search
Citing Articles
Search By Author
Search By Keywords
PubMed Search
Search By Author
Search By Keyword


