Experimenting the design-based k-NN approach for mapping and estimation under forest management planning
iForest - Biogeosciences and Forestry, Volume 5, Issue 1, Pages 26-30 (2012)
doi: https://doi.org/10.3832/ifor0604-009
Published: Feb 27, 2012 - Copyright © 2012 SISEF
Research Articles
Abstract
Estimation and mapping of forest attributes are a fundamental support for forest management planning. This study describes a practical experimentation concerning the use of design-based k-Nearest Neighbors (k-NN) approach to estimate and map selected attributes in the framework of inventories at forest management level. The study area was the Chiarino forest within the Gran Sasso and Monti della Laga National Park (central Italy). Aboveground biomass and current annual increment of tree volume were selected as the attributes of interest for the test. Field data were acquired within 28 sample plots selected by stratified random sampling. Satellite data were acquired by a Landsat 5 TM multispectral image. Attributes from field surveys and Landsat image processing were coupled by k-NN to predict the attributes of interest for each pixel of the Landsat image. Achieved results demonstrate the effectiveness of the k-NN approach for statistical estimation, that is compatible with the produced forest attribute raster maps and also proves to be characterized, in the considered study case, by a precision double than that obtained by conventional inventory based on field sample plots only.
Keywords
Forest management planning, k-Nearest Neighbors, Landsat, Estimation, Mapping
Introduction
Over the last decades, conservation and sustainable use of forest resources have become among major issues of environmental and land policies, which foster reconsidering the meaning of silviculture in relation to a changed society and acknowledge the forest as a complex, multi-functional, biological system. That implies an increasing need of comprehensive and timely information to support their management at a variety of spatial scales ([8]).
Under such a perspective, survey cost effectiveness requirements have pushed towards the adoption of approaches able to integrate the statistical sampling and mapping processes within conventional inventories at stand level, to enhance synergies and mutual benefits. This integration is also emerging as a major issue for the development of programs aimed to monitoring and assessing land and multiple environmental functions ([13]). This means an hybridisation of tools and techniques. In the light of the above considerations, a number of scientific experiences have been focused on the relationship between forest field data and satellite multispectral images. One of the most successful tools for synergistic estimation and mapping of forest attributes, coupling remotely sensed and field inventory data, is the k-Nearest Neighbors (k-NN) non-parametric approach (e.g., [6], [19], [17]), whose operational application has been steadily increased in the last decade, even at the professional level.
Here we report the results of a low-cost application of the design-based k-NN tool approach to estimate and map attributes relevant to support management planning, such as aboveground biomass and current annual increment of tree volume, in a relatively small area (the Chiarino forest in the National Park of Gran Sasso Monti della Laga, central Italy). Distinctively, the importance of the biomass and increment estimation and mapping is related to both the carbon dynamics quantification (e.g., stand carbon sequestration) and the sustainable management of forest resources (e.g., to apply adaptative management approaches). The interest of the application lies in the relative advantage to exploit design-based k-NN potential with respect to conventional stand inventory when supporting the modulation of forest stand management planning. The low-cost framework is referred to the type of remotely sensed data analyzed, i.e., Landsat data freely downloadable from the Internet.
Forest attribute mapping and estimation
The establishment of relationship between remotely sensed data and the biophysical attributes of forest vegetation (like the aboveground biomass and the current annual increment of tree volume) allows maps of the attributes observed at the field inventory units to be derived for the entire area of interest, i.e., the attributes can be predicted for all the pixels in the area, thus producing raster maps ([15]). The exploited information from remotely sensed data are usually the DNs of the spectral bands (and/or their combination to produce vegetation indices, e.g., [14]) which are available for all the N pixels in the area, while the values of the Y-variable of interest (the forest attribute) are known only for the sample of n pixels corresponding to the field inventory units (each assumed to represent one pixel), characterized as the reference set. The mapping procedure is based on the non-parametric prediction of the values of Y for the pixels that do not correspond to the field inventory units, characterized as the target set. Non-parametric approaches are distribution-free, in that they do not rely on any underlying probability distribution for estimation. k-NN predicts the unknown value of Y for the j-th target pixel as a weighted mean of the Y values for the k reference pixels nearest to the j-th target pixel in the multidimensional space defined by the auxiliary (remotely sensed) variables (eqn. 1):
where k (<n) denotes the number of neighbors adopted for the prediction and the w i are weights such that w1 + … + wi = 1. A straightforward choice for the weights is wi = 1 / k for any i = 1, …, k ([16], [2]). Weights can be also selected to be inversely proportional to the multidimensional distance between the j-th target pixel and each of the k nearest neighbor reference pixels, so that a proportionally larger weight is assigned to the neighbors nearer to the target pixel in the space of the auxiliary variables.
Beyond mapping, the k-NN prediction at pixel level can be exploited in order to efficiently estimate statistical parameters of the considered forest attributes within the mapped area ([17]). If the locations of the reference set S (the field inventory sample) are objectively selected by rigorous probabilistic rules, the obtained data can be analyzed in the framework of design-based inference for which population values are regarded as fixed constants and the randomization resulting from the sampling design is the basis of inference. In this framework, the bias and variance of an estimator of a population parameter are determined from the set of all possible samples (the sample space) and from the probability associated with each sample. For a general explanation and formulation of the design-based k-NN-assisted estimators, see Baffetta et al. ([2]), chapt. 3.2. In the case of simple random or systematic sampling without replacement designs, the approximately unbiased k-NN-assisted estimators of the total and of the mean of the attribute Y over a given area covered by N pixels are respectively (eqn. 2, eqn. 3):
where ÿj denotes the predicted value of Y for the j-th pixel and ej = yj - ÿj denotes the prediction error. The approximately conservative k-NN-assisted estimators of the sampling variance of the above estimators are, respectively (eqn. 4, eqn. 5):
where (eqn. 6):
If the relationship between Y and the auxiliary variables is sufficiently strong (see [3] for design-based diagnostics to assess such a potential), the k-NN-assisted estimators of the total and of the mean tend to be more precise than the classical estimators from conventional random or systematic sampling without replacement ([2]). In relative terms, the advantage of the k-NN-assisted estimators with respect to precision increases as the size of the reference set decreases: this last evidence stresses the potential of k-NN to support estimation at forest management level, like in the case here considered.
Study area
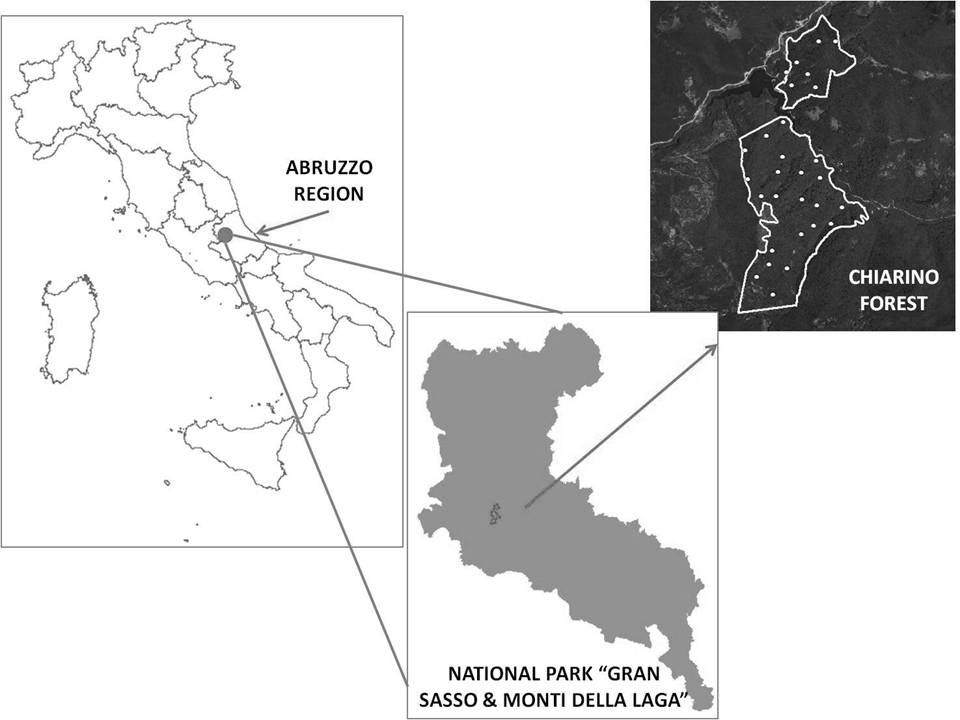
The study area is located in the Chiarino Valley, within the Gran Sasso and Monti della Laga National Park, central Italy (Fig. 1). The forest covers around 200 ha, ranging from 1000 to 1400 m a.s.l. Forest stands are dominated by Fagussylvatica L. and Quercuscerris L., to which many other species are associated: Taxusbaccata L., Ilexaquifolium L., Fraxinusexcelsior L., Tilia spp., Acer spp., Populus spp. and Ulmus spp. within rock outcrops or gorge environment; Sorbus spp., Rubusidaeus L., Arctostaphylosuva-ursi Spr.,Atropabelladonna L. and Ribes spp. within gaps and in the glade environment. In the past decades coppicing was the main silvicultural system; the area has been acquired by the Park in the year 1998; since then, no cutting has been carried out. According to the values measured on field sample plots (see next chapter), the number of tree stems is relatively high, ranging from 1 000 to 6 000 per hectare, and the mean dbh relatively small, from 7.2 cm to 16.4 cm. Stand age varies from 15 to 60 years.
Fig. 1 - Study area (the points on the map of the Chiarino forest represent the locations of field sample plots).
Survey protocol
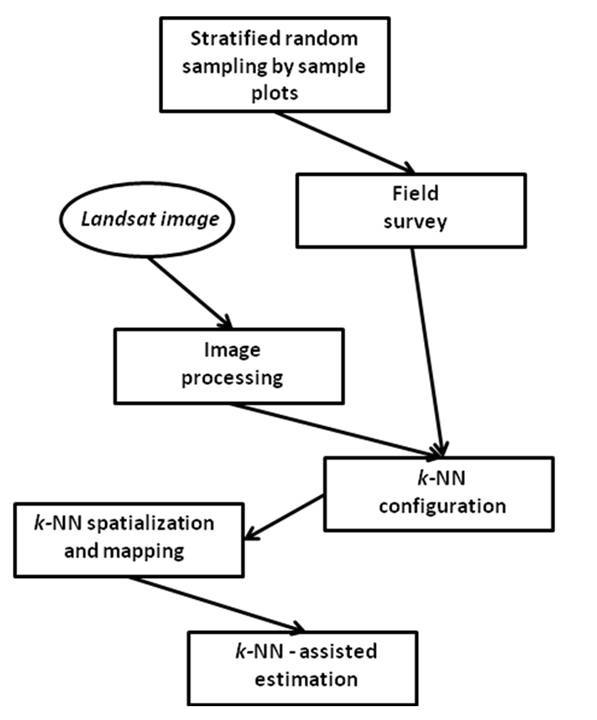
The survey protocol was based on the following operative steps (Fig. 2): (i) delineation on aerial orthophotos (available from the Park) of forest management units, each considered as a stratum relatively homogenous with respect to stand development/ crown coverage; (ii) random sampling within each stratum to select permanent field plots, with sample allocation proportional to stratum size; (iii) dendrometric survey within the field plots; (iv) acquisition and processing of Landsat 5 TM image to extract DNs and elaborate vegetation indexes at pixel level; (v) definition of the best k-NN configuration to couple field and remotely sensed data; (vi) k-NN-based spatialization of the attributes of interest (i.e., aboveground biomass and current annual increment of tree volume); (vii) estimation of the totals and means of such attributes over the study area, comparing the estimation with and without k-NN.
Fig. 2 - Proposed survey approach.
The first step was accomplished by multitemporal digital orthophotos (years 1989, 2000, 2005, 2007), delineating five strata. Permanent sample plots were distributed among strata, for a total of 28: this size was chosen based on a trade-off between obtaining a reliable picture of the considered attributes over the examined area and the field survey costs. The center of each plot was georeferenced applying a post-processing differential correction to the data recorded through a Global Positioning System with an estimated accuracy of less than 1 meter. Measurements within each plot were carried out according to INFC ([11]) in September 2010.
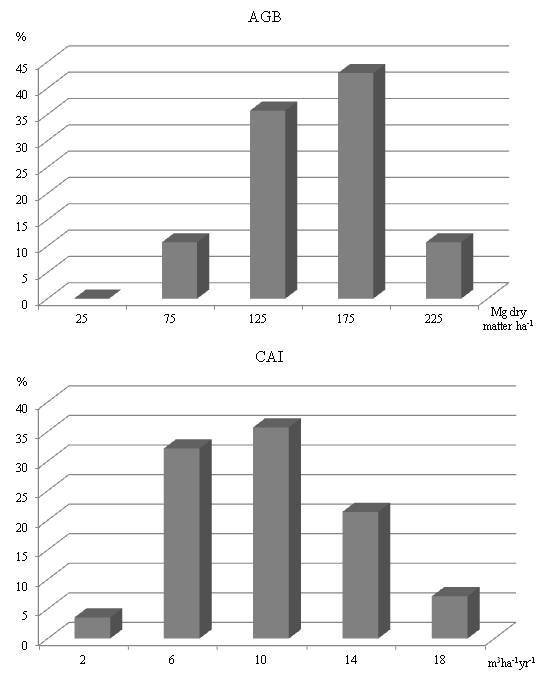
Tree volume (TV) was computed on the basis of allometric equations ([5]) from tree dbh and height measurements. TV was converted to aboveground biomass (AGB, expressed as Mg of dry matter) by the equation AGB =TV·BEF·WBD, where BEFs are the biomass expansion factors and WBDs are the wood basic densities provided by APAT ([1]). The AGB value was converted to carbon stock using a conversion factor of 0.5 ([12]). Current annual increment of tree volume (CAI) was assessed by tree cores (around six cored stems per sample plot, roughly distributed proportionally to stem dbh frequency in the plot) and subsequent elaboration by the Pressler method ([9]). Fig. 3 shows the distribution of AGB and CAI sample values.
Fig. 3 - Distribution of AGB and CAI sample values.
Satellite image data from a July-2009 Landsat 5 TM scene, with a 30 m geometric resolution, were downloaded from USGS website (⇒ http://glovis.usgs.gov/). The image was orthocorrected by a Rational Polynomial Function rectification process (error equal to less than a pixel). A total of 15 features were extracted from the Landsat image to be exploited as auxiliary variables, i.e., the DNs of the bands TM1, TM2, TM3, TM4, TM5, TM7 and nine vegetation indexes obtained combining such bands (NDVI, DVI, EVI, CVI, NG, NRVI, RVI, SAVI, SR: for the indexes meaning, see [10]). These auxiliary variables were available for all the 2247 pixels that correspond to the Chiarino forest (i.e., the target set), while the values of the Y-variables of interest (AGB and CAI) were known only for the sample of 28 pixels corresponding to the field inventory sample units (i.e., the reference set).
The definition of the best configuration (i.e., the optimal setting of k-NN parameters) for the spazialization of the considered forest attributes was performed by a leave-one-out heuristic procedure where the prediction accuracy is tested against several k values (from 1 to 15) and three different distances (Euclidean, Mahalanobis, fuzzy): for detailed explanation of the procedure and the meaning of such distances, see Maselli et al. ([14]). The best k-NN algorithm configuration proved to be that with the TM2 band DN, the SR and RVI indices as auxiliary variables to spatialize AGB and that with the six bands of the TM image to spatialize CAI. For both the attributes, a k value equal to 2 and the Mahalanobis multispectral distance proved to be the most effective for spatialization.
Results
Two raster images were respectively created by the spatialization of AGB and CAI, where their predicted value is assigned to each pixel by the best k-NN configuration. The k-NN prediction error at pixel level, assessed against the field plot values, ranges from -49 to +65 Mg of dry matter per hectare for AGB (with a error mean of 18.6 Mg of dry matter per hectare), and from -0.6 to +0.6 m3 ha-1 yr-1 for CAI (with a error mean of 0.2 m3 ha-1 yr-1).
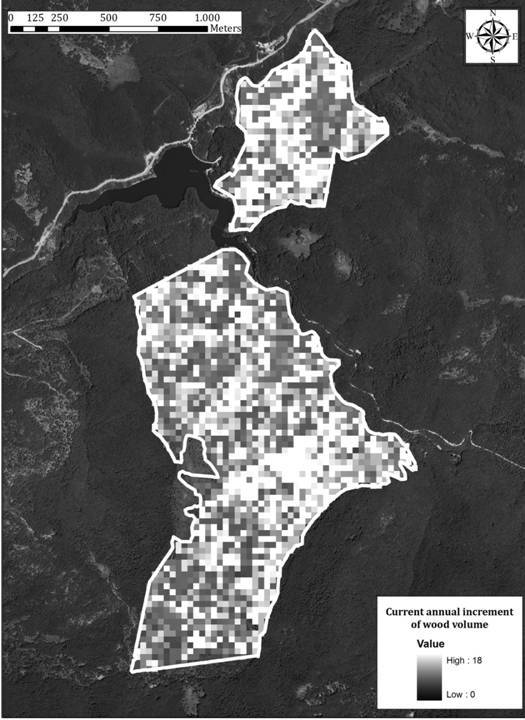
The total of AGB over the considered forest area is 29078 Mg of dry matter, with a mean value of 143.8 Mg of dry matter per hectare. The mean value of AGB is equivalent to around 173.2 m3 ha-1 of wood volume. Fig. 4 shows the raster map of the AGB: the highest values can be found on the north-western part of the forest area and on the south-eastern part. Fig. 5 shows the raster map of CAI: the mean value is 8.7 m3 ha-1 yr-1, with the highest values on the northern part of the forest area and on the central zone of the southern part of the forest area. The carbon value corresponding to the total CAI in the study area is equal to 729.8 Mg of dry matter per year.
Fig. 4 - Raster map of the aboveground tree biomass (Mg of dry matter per hectare).
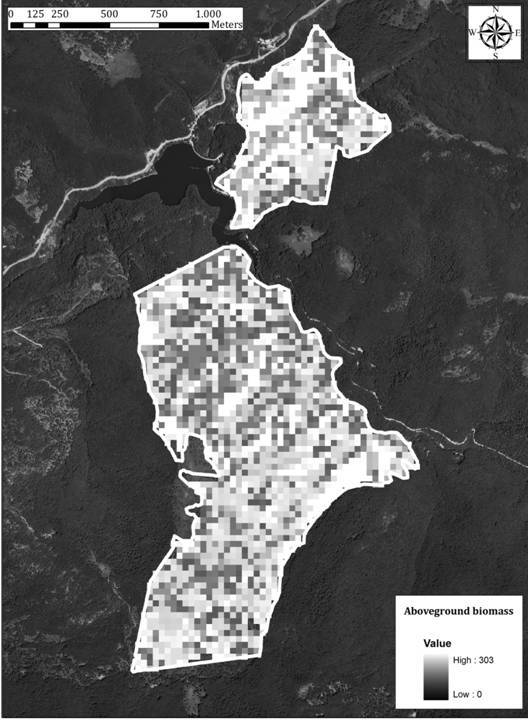
Fig. 5 - Raster map of the current annual increment of tree volume (m3 ha-1 yr-1).
Tab. 1 compares the estimation results achieved with and without the k-NN-assisted estimation: in the latter case, the estimation refers to the standard inventory procedure based on field sample plots only. For both the considered attributes, k-NN-assisted estimation is characterized by a standard error much lower than that of the standard procedure.
Tab. 1 - Comparison between forest attribute parameters estimated by the k-NN-assisted approach and by the conventional inventory based on field sample plots only.
| Statistical parameters | with k-NN | without k-NN | ||
|---|---|---|---|---|
| Value | Standard error |
Value | Standard error |
|
| Total of aboveground tree biomass [Mg of dry matter] |
29078 | 744 (2.6 %) |
28920 | 1539 (5.3 %) |
| Mean of current annual increment of tree volume [m3 ha-1 yr-1] |
8.7 | 0.3 (3.4 %) |
9.9 | 0.7 (7.1 %) |
Discussion and conclusions
This work synthesizes the main outcomes of a methodological exercise that exploits design-based k-NN approach to compatibly map and estimate forest stand attributes within a relatively small area (the Chiarino forest), in the Gran Sasso and Monti della Laga National Park.
As remote sensing technology and associated analytical methods continue to improve rapidly with reasonable costs, they are likely to play an even more substantial role for forest monitoring and assessment in the future. Support for forest management should therefore be framed according to a multi-faced approach that integrates mapping and inventory as a means of providing comprehensive knowledge on the state and trends of forest resources ([7]). Methods are experimented in the perspective of coupling the remotely sensed data for a given area with sample inventory data to produce raster maps of the inventoried forest attributes and to simultaneously improve the precision of the inventory estimates (or, alternatively, to reduce the number of field plots at the same overall precision). The latter consideration is distinctively relevant for forest management planning in order to provide estimates with acceptable precision for the relatively small areas usually involved, for which even the sample of field inventory plots is usually relatively small. Actually, in the presented experimentation the assistance by k-NN has doubled the precision provided by the conventional field inventory. Note, however, that even the k-NN-assisted estimation error may become too large when very few pixels are sampled, and this problem can be handled only by model-based estimators, whose properties are obtained with respect to all the populations which may be generated from the assumed superpopulation model, considering the sample as fixed (i.e., purposively selected). An example of model-based k-NN estimation for small forest areas is reported by McRoberts ([18]): the validity of the inference is based on the validity of the assumed model, not the probabilistic nature of the sample as is the case for the design-based inference, like that proposed here by the k-NN assisted estimation which does not assume any model for inference.
Main advantages of exploiting the k-NN approach relies on the fact that: (i) it is multivariate in the sense that it can estimate multiple Y-variables simultaneously and still retain their complex variance-covariance structure and natural variation within the bounds of biological reality; (ii) it can be used with any probability sampling design.
The proposed operative protocol can be feasibly applied to environments with forestry issues and conditions similar to those here examined. It exploits spatially comprehensive, inexpensive remote sensing data (like TM data) available for all the population units (i.e., the pixels), along with (expensive) field data only available on a sample of units.
One of the most critical aspects of the proposed procedure is the need for a rigorous and accurate georeferencing and coregistration of both remotely sensed data and plot locations, which must be detected with high accuracy. Another critical issue of the k-NN approach is that the estimates at pixel level tend to average towards the population mean and to have suppressed variance; a procedure to tackle such an issue by post-processing modification of k-NN estimates through distribution matching has been recently proposed ([4]). A last possibly critical aspect of the approach from the practical point of view may be that k-NN algorithms have been engineered with “in house” software programs; however this issue is fast developing since even major commercial GIS softwares are beginning to incorporate k-NN routines, which, on the other hand, can be also found as open GIS tools.
Planning for sustainable forests has increased the demand for timely and accurate information. Landsat images are operationally used to improve forest inventories since a decade: the main advancement of the exercise here presented in comparison with existing practices is that such images are here exploited not only to produce raster maps of the inventoried forest attributes but also to simultaneously and compatibly improve the statistical precision of the attribute estimates obtained at population level by the adopted unbiased estimators (for a thorough discussion on this relevant issue, see [17]).
The georeferenced nature of k-NN raster products allows their integration with data from geodatasets, e.g., soil classes, site fertility, cumulative growing season temperatures, etc. For instance, aboveground biomass and current annual increment of tree volume maps may be integrated to support the prediction of carbon sequestration scenarios for areas of arbitrary sizes and to monitor the future landscape changes, thus adding an important interpretation key both within and outside the stand boundaries. Distinctively, this kind of products can represent a relevant tool for forest planning and strategic decision making, in order to support comprehensive snapshots of options for operational management of forest resources.
Acknowledgements
This work was partially carried out under the project “Modelling the carbon sink in Italian forest ecosystems using ancillary data, remote sensing data and productivity models“ (DIBAF research unit) funded by the FIRB program of the Italian Ministry of University and Research (project coordinator: G. Chirici). The Authors wish to acknowledge the “Gran Sasso and Monti della Laga” National Park and the Territorial Command for the Environment (CTA) of the State Forestry Corps in Assergi (AQ) for their collaboration in carrying out this work. We also thank the reviewers and the Subject Editor whose comments helped to improve the paper.
References
Gscholar
Gscholar
Gscholar
Gscholar
Gscholar
Gscholar
Authors’ Info
Authors’ Affiliation
V Quatrini
S Di Paolo
D Giuliarelli
A Angelini
L Portoghesi
P Corona
Department for Innovation in Biological, Agro-food and Forest systems (DIBAF), University of Tuscia, v. San Camillo de Lellis snc, I-01100 Viterbo (Italy)
Gran Sasso and Monti della Laga National Park, Assergi, AQ (Italy)
Corresponding author
Paper Info
Citation
Mattioli W, Quatrini V, Di Paolo S, Di Santo D, Giuliarelli D, Angelini A, Portoghesi L, Corona P (2012). Experimenting the design-based k-NN approach for mapping and estimation under forest management planning. iForest 5: 26-30. - doi: 10.3832/ifor0604-009
Academic Editor
Agostino Ferrara
Paper history
Received: Oct 14, 2011
Accepted: Jan 19, 2012
First online: Feb 27, 2012
Publication Date: Feb 27, 2012
Publication Time: 1.30 months
Copyright Information
© SISEF - The Italian Society of Silviculture and Forest Ecology 2012
Open Access
This article is distributed under the terms of the Creative Commons Attribution-Non Commercial 4.0 International (https://creativecommons.org/licenses/by-nc/4.0/), which permits unrestricted use, distribution, and reproduction in any medium, provided you give appropriate credit to the original author(s) and the source, provide a link to the Creative Commons license, and indicate if changes were made.

Web Metrics
Breakdown by View Type
Article Usage
Total Article Views: 55272
(from publication date up to now)
Breakdown by View Type
HTML Page Views: 46348
Abstract Page Views: 3213
PDF Downloads: 4061
Citation/Reference Downloads: 65
XML Downloads: 1585
Web Metrics
Days since publication: 5230
Overall contacts: 55272
Avg. contacts per week: 73.98
Article Citations
Article citations are based on data periodically collected from the Clarivate Web of Science web site
(last update: Mar 2025)
Total number of cites (since 2012): 3
Average cites per year: 0.21
Publication Metrics
by Dimensions ©
Articles citing this article
List of the papers citing this article based on CrossRef Cited-by.
Related Contents
iForest Similar Articles
Research Articles
Spatially explicit estimation of forest age by integrating remotely sensed data and inverse yield modeling techniques
vol. 9, pp. 63-71 (online: 25 July 2015)
Review Papers
Remote sensing-supported vegetation parameters for regional climate models: a brief review
vol. 3, pp. 98-101 (online: 15 July 2010)
Review Papers
Remote sensing of selective logging in tropical forests: current state and future directions
vol. 13, pp. 286-300 (online: 10 July 2020)
Research Articles
Afforestation monitoring through automatic analysis of 36-years Landsat Best Available Composites
vol. 15, pp. 220-228 (online: 12 July 2022)
Review Papers
Accuracy of determining specific parameters of the urban forest using remote sensing
vol. 12, pp. 498-510 (online: 02 December 2019)
Research Articles
Assessing water quality by remote sensing in small lakes: the case study of Monticchio lakes in southern Italy
vol. 2, pp. 154-161 (online: 30 July 2009)
Review Papers
Remote sensing support for post fire forest management
vol. 1, pp. 6-12 (online: 28 February 2008)
Research Articles
Estimation of aboveground forest biomass in Galicia (NW Spain) by the combined use of LiDAR, LANDSAT ETM+ and National Forest Inventory data
vol. 10, pp. 590-596 (online: 15 May 2017)
Research Articles
Landsat TM imagery and NDVI differencing to detect vegetation change: assessing natural forest expansion in Basilicata, southern Italy
vol. 7, pp. 75-84 (online: 18 December 2013)
Research Articles
Monitoring of changes in woodlots outside forests by multi-temporal Landsat imagery
vol. 11, pp. 162-170 (online: 19 February 2018)
iForest Database Search
Search By Author
Search By Keyword
Google Scholar Search
Citing Articles
Search By Author
Search By Keywords
PubMed Search
Search By Author
Search By Keyword


