Analysing interaction effects in forests using the mark correlation function
iForest - Biogeosciences and Forestry, Volume 1, Issue 1, Pages 34-38 (2008)
doi: https://doi.org/10.3832/ifor0449-0010034
Published: Feb 28, 2008 - Copyright © 2008 SISEF
Research Articles
Abstract
The spatial distribution of trees in forests can be described and modelled by point processes where the points are given by the locations (coordinates) of the trees. Further properties of a tree like height or mean crown radius can be interpreted as so called marks of the considered point process characterising the points or trees in some way. The so called mark correlation function describes the spatial correlation of these marks in the observed point pattern. In this paper we introduce a special mark, the overlapping or crown index. We show that mark correlation functions for the considered marks help to understand interaction effects of forest trees.
Keywords
Forestry statistics, Marked point process, Interaction, Crown index
Introduction
Generally, forest scientists as well as wood processing industry are interested in spatial dimensions and the distribution of trees in stands. The spatial distribution of trees as well as the dimension of a tree like height and mean crown radius depends on interaction and competition effects in forests. Obviously, interaction among trees results in certain tree heights and crown radii in specific neighbourhood situations with trees of one or more species. Think about the following situations: An old tree suppresses young and small trees of other species under his crown, because for these young trees necessary resources like water and light are hardly available. In some cases contrary interaction effects are conceivable. For example, surrounding trees of a certain species support each other with respect to growth and height even in order to prevent trees of other species in their region.
Mixtures of tree species are in focus of forest ecosystem related research for some years now (see [14]). While it is widely recognized that trees have species-specific effects on particular resources like radiation, water and nutrients ([3], [2], [12]) more complex effects of mixtures are assumed to exist ([14]). As the trees modify resource availability by morphological adaptations (e.g., interception of precipitation and absorption of radiation by leaves and branches) and have distinct features of litter fall we may expect complex effects, for instance on humus quality and quantity. For better understanding of fauna species diversity and abundance in spatial distribution of safe sites for tree regeneration ([4], [13], [1]) detailed knowledge of interaction processes is important.
From a statistical point of view we interpret a forest or stand as a point process. Obviously, the points are given by the positions, i.e., coordinates, of the trees.
In ecological statistics especially with respect to forestry point process models are often used to analyse forest dynamics and even regeneration in forests, see ([15], [17]). Generalized models with respect to directional effects can be found in ([19], [8]).
Sometimes additional information should be taken into account. For the stand discussed in this paper for every point or tree so called marks are available characterising the tree in some way. Of course, the height and the mean crown radius of a tree are such marks. Additionally, we introduce a further mark: the so called crown or overlapping index. This mark measures to what extent the crown of the corresponding tree lies under crowns of surrounding trees. Analysing this mark or index can help to describe and understand specific neighbourhood situations or tree-tree mixtures with respect to several species. In general, indices quantifying spatial forest structure are frequently used to monitor spatial aspects of tree characteristics including biodiversity in research plots of limited size.
Besides the spatial distribution of marks or indices the spatial correlation of marks is of great interest even with respect to interaction effects among trees. This spatial correlation of marks can be analysed using the well-known mark correlation function, see ([11]). Useful ecological applications of the mark correlation can be found in Lancaster ([6]) and Lancaster & Downes ([5]). In Parrott & Lange ([10]) the mark correlation function is used to test whether the tree positions are randomly located or not where the marks are given by the diameters at breast height (dbh) of the trees. The canopy structure of a forest affects forest dynamics ([7]). In this context the mark correlation function for the proposed overlapping index can contribute to improved knowledge about regeneration processes in forests,
In this paper we discuss the spatial correlation of the given and determined marks for a mixed stand of European beech and Norway spruce. To distinguish between interaction effects among trees of the same species (intra-specific interaction) and interaction among trees of different species (inter-specific interaction) the mark correlations functions are calculated for beech-beech and spruce-spruce mixtures as well as for mixed spruce-beech (or beech-spruce) situations.
Material and methods
The experimental plot
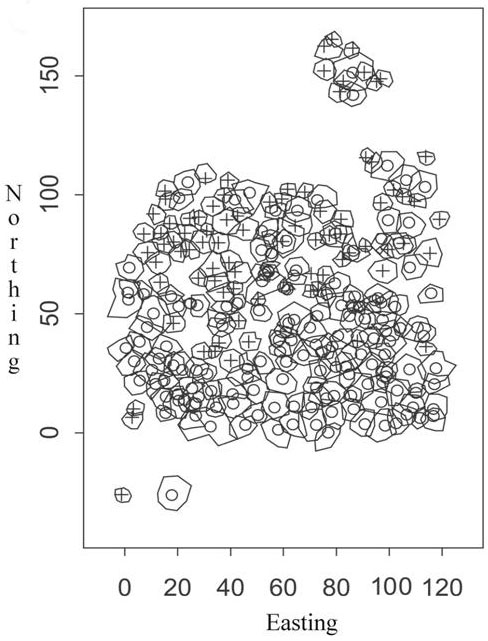
Our study site is located in the Solling area. The Solling is an intermediate mountain range in the south of the German Bundesland Lower Saxony. The studied forest is located at 400 m a.s.l. at 51°43´N and 9°38´E. In this region and elevation annual average precipitation of 900 L/m² and annual mean temperature of 7.5°C are reached. During the vegetation period (May to September) the averages are 420 L/m² and 13.4°C mean temperature. The soil is a dystric cambisol (FAO classification) from loess solifluction overlying sandstone. Within the Solling the experimental plot is located in a 130 to 140 years old European beech (Fagus sylvatica L.) and Norway spruce (Picea abies L.) mixed stand. Since about 15 years no silvicultural interferences were carried out. The stand is characterized by intensive and multi-purpose compositions of beech and spruce. Fig. 1 shows the spatial distribution of the trees and the crown contour lines. The sums of basal area and crown area suggest normal stand density, but in this study site the overall basal and crown area indicates the heterogeneity of stand density in terms of tree clusters and gaps. Altogether, the stand comprises 154 beeches and 84 spruces. Also some smaller gaps can be found. Tab. 1 gives an overview about the stand structure and the tree species.
Tab. 1 - Characterisation of the beech-spruce mixed stand. Data for the study site. N: sample, Mean: mean, STD: standard deviation. Crown area: basal area of the crown generated by the crown contour lines. DBH: diameter at breast height.
| tree | N | Height [m] | DBH [cm] | Crown area [m²] | |||
|---|---|---|---|---|---|---|---|
| Mean | STD | Mean | STD | Mean | STD | ||
| beech | 154 | 25.70 | 4.93 | 39.82 | 11.83 | 66.67 | 4.1 |
| spruce | 84 | 35.01 | 3.77 | 63.51 | 11.96 | 41.95 | 2.54 |
| total | 238 | - | - | - | - | - | - |
For every tree the crown radius was determined for 8 directions anticlockwise from 0° to 315° (45° steps). These 8 values lead to the mean crown radius which is calculated as arithmetic mean of these 8 values. See Fig. 1 for the tree positions and the crown contour lines.
Additionally, the height of each tree is available and the overlapping index will be calculated considering spruce-spruce-, spruce-beech- and beech-beech-compositions.
Marked point processes and the mark correlation function
Let Z(s), s ∈ S be a point process over a spatial region S with n given points s1 ,..., sn . At every point si a so called mark mi , i=1, …, n, that means a value characterising the point in some way, is measured or determined. In our case the points si represent the positions of the trees in the experimental plot, i.e., the crosses and circles in Fig. 1.
The spatial correlation of marks in this marked point process is described using a so called test function f(mi, mj ) for two marks mi and mj. This test function characterises the correlation between the marks mi and mj at different points, conditional on the distance h between the points. Here, we use (eqn. 1):
In general, the mark of a tree is a random number. This means that the test function is random, too. Obviously the test function given above leads to large values, respectively small values, if large, respectively small, non-negative marks, are given. Therefore, this test function indicates correlation between marks in a natural way. From point process theory further test functions are known, which may all result in similar ecological interpretations ([10]). For example, f(mi , mj ) = ½ · (mi - mj)2 leads to the so called mark variogram familiar with the well-known variogram from geostatistics which is also often applied in forestry statistics, see ([18]). In general, the mark correlation function and functions based on other test functions belong to the so called second order characteristics of marked point processes, see ([16]).
Now, let μ be the mean or the expectation of the considered mark. This means E(mi ) = μ for all i=1, …, n where the symbol E(X) indicates the mean of a random number X. The mark correlation function for the test function f(mi , mj ) = mi · mj is given by (eqn. 2):
Once again, the test function is a random number and therefore its mean is well defined. The numerator in eqn. 2 is the mean of the test function conditional on the distance h of two trees. The denominator removes scale effects given by marks of different order and norms the marks correlation function. This ensures the possibility to compare mark correlation functions based on different marks.
Obviously, if the marks are uncorrelated we obtain kf (h) = 1 because the numerator in eqn. 2 is not depending on the distance of the two considered trees.
Now, from an ecological point of view it is of great importance to connect values of the mark correlation function with interaction effects like attraction, avoidance behaviour or inhibition of trees.
Negative correlation standing for inhibition and suppression with respect to the classical correlation coefficient is indicated by kf (h) < 1. For example, think about the following situation: at distance h there are some pairs of trees of a species, and we are interested in the mark tree height. If each pair of trees consists of a high tree (large mark) and a low tree (small mark) then negative correlation between the marks with respect to the mark correlation function is given. Analogously to the correlation coefficient the higher values of the first tree go along with the lower values of the second tree and vice versa, but negative correlation is now indicated by kf (h) < 1. In contrast to this, positive correlation or attraction is given by kf (h) > 1.
Frequently, the marks are positive numbers (tree height, dbh, etc.).
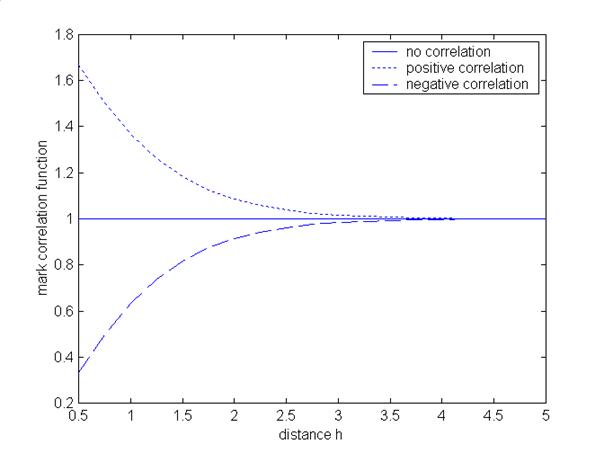
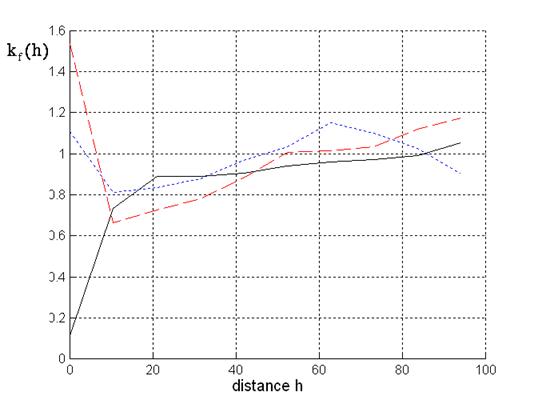
In this case the test function f(mi , mj ) = mi · mj always leads to positive values of the mark correlation function. Therefore, it is not possible to interpret values of the mark correlation function directly as correlation coefficients. But the criteria for positive and negative correlation are given above. Therefore, choosing the test function f(mi , mj ) = mi · mj leads to an easy identification of the type of correlation. Fig. 2 shows three mark correlation functions corresponding to these three types of correlation (independence, positive and negative correlation).
Fig. 2 - Mark correlation function indicating positive correlation (dotted line), negative correlation (dashed line) and independence (solid line).
Estimating the mark correlation function
The mark correlation function from eqn. 2 must be estimated because the conditional (bivariate) distribution of the marks is unknown. Or, in other words, without further assumption we are not able to calculate E(f(mi , mj ) | | si - sj | = h) theoretically. But obviously, we can estimate eqn. 2 by (eqn. 3):
where n(h) is the number of pairs of points (trees) at si , sj with distance h.
Usually, estimated mark correlation functions from eqn. 3 are often jagged and irregular. Further, pairs of points with the same exact distance h are rarely given.
Therefore, it is useful to use kernel estimators to obtain smoother functions. Let us mention the so called Epanecnikov kernel (eqn. 4):
where b is an additional parameter called bandwidth.
Using this kernel we obtain a smooth estimate of the mark correlation function by (eqn. 5):
Note that the points si , …, sn , i.e., the locations of the given trees, are located within an (rectangular) observation window W. Obviously, the origin of this window is given by (min{xi : i=1, …, n}, min{yi : i=1, …, n}) with si = (xi , yi ), i=1, …, n. Shifting this origin towards si , sj respectively, leads to the window Wi , Wj respectively, where A(W) denotes the area of window W.
For numerical calculations we used eqn. 5 with b=2. More details about the mark correlation function and corresponding fitting techniques can be found in Stoyan & Stoyan ([15]).
The overlapping index or crown index
The mark correlation function is an important tool to monitor spatial variability of marks of trees as well as interaction effects of the corresponding trees. “Classical” marks of trees such as tree height and dbh are not sufficient to describe the spatial structure of a stand with respect to forest dynamics and regeneration processes because the availability of resources like water and radiation strongly depends on the canopy structure even characterized by overlapping crowns of trees. Therefore, to analyse neighbourhood situations of forest trees with respect to the canopy structure of the stand we introduce the so called overlapping or crown index. For every tree crown radii are given for 8 directions. Let us denote a basal point at the end of a crown radius as crown point. From a mathematical point of view a crown or the corresponding crown surface respectively, is an octagon with edges given by the crown points, see Fig. 1. In other words: This crown surface of a tree is given by the surface generated by the contour line of the crown (Fig. 1).
Now, we can prove if a crown point of a fixed tree lies inside the crown surface (octagon) of another tree. This check is done in the following way: at the first step we calculate the crown area of a tree as area of the corresponding crown surface (octagon). At the second step we calculate for every crown point of the remaining trees the area of the polygon generated by the 8 original crown points of the fixed tree and this additional crown point. If this crown point lies within the crown area of the fixed tree, then the area of the 9-point-polygon is smaller than the original crown area. In the opposite case, i.e., the additional crown point lies outside the crown area of the tree, the area of the 9-point-polygon increases compared with the original crown area. In this way, we check for every crown point whether it lies within the crown area of other trees or not. Obviously, two crowns overlap if at least one of their crown points lies inside the crown surface of the other tree. This leads to the definition of the crown index.
Let s be a point of the point process, i.e., the position of a tree, with 8 crown points c1 (s), …, cn (s). We set (eqn. 6):
Now, the crown index for the tree at s is given by the sum of these values (eqn. 7):
Obviously, if a solitary tree without crown points under crowns of other trees is given at s we obtain mCI (s) = 1. The opposite case, i.e., the tree at s stands completely under crowns of surrounding trees, leads to mCI (s) = 0. Therefore, the crown index provides a measure to assess overlapping situations of crowns characterising the spatial structure of a stand. For example, in the experimental plot there are two solitary trees: A beech at point (17.9, 25.3) and a spruce at (-1.2, -26.0), see Fig. 1.
Results
The crown indices for different mixtures of trees are given in Tab. 2. The crown index for mixed mixtures of beeches and spruces equals 0.85. Therefore, overlapping crowns belonging to trees of different species are rare whereas crowns of the beeches tend to overlap in intra-specific mixtures (crown index = 0.32).
Tab. 2 - Crown index for inter-specific (spruce-beech) and intra-specific (spruce-spruce and beech-beech) situations. Mean: mean, STD: standard deviation.
| Crown index | intra-specific | inter-specific | ||
|---|---|---|---|---|
| Mean | STD | Mean | STD | |
| beech | 0.32 | 0.30 | 0.85 | 0.24 |
| spruce | 0.68 | 0.31 | 0.85 | 0.24 |
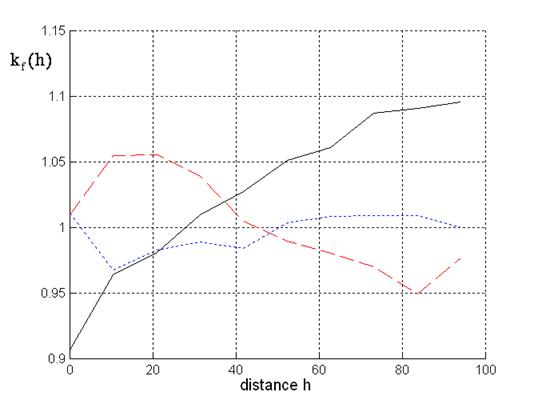
Now, we want to have a look on the mark correlation functions. Firstly, let us discuss the mark correlation function for the mark tree height, see Fig. 3. The corresponding mark correlation function taking into account trees from different species is almost monotonously increasing. Obviously, in this case mixed spruce-beech or beech-spruce mixtures are considered. Negative correlation at a distance smaller than 50 meters corresponds to the empirical observation that a high beech does not stand near to a high spruce. At greater distances this inter-specific suppression does not occur.
Fig. 3 - Mark correlation for tree height: Solid line: beech-spruce situations; dotted line: spruce; dashed line: beech.
Different situations are given if mixtures are analysed considering surrounding trees from one species. At small distances we obtain positive correlation for the beeches and negative correlation for the spruces.
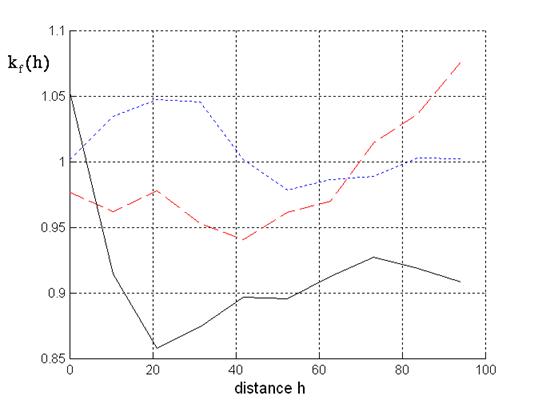
Fig. 4 presents the mark correlation functions for the mark mean crown radius. At distances greater than 0 meters negative correlation is given for mixtures of trees belonging to both species. Obviously, this confirms the empirical observation mentioned above that there are no mixtures of high or older trees from both species with greater mean crown radius.
Fig. 4 - Mark correlation for crown radius: Solid line: beech-spruce situations; dotted line: spruce; dashed line: beech.
In comparison with Fig. 3 opposite results are obtained for mixtures consisting of trees from one species. At relatively small distances the mark correlation function for the spruces shows positive correlation whereas negative correlation is given for the beeches.
Therefore, in the case of spruce-spruce mixtures we have attraction at small distances for the mark mean crown radius but negative correlation or suppression for the mark tree height. Spruce-spruce mixtures are especially given in the north-western part of the stand. The results for the two mark correlation functions describe the fact that spruces with different heights are relatively often given at small distances. Now, in the case of beech-beech mixtures we have attraction at small distances for the mark tree height but negative correlation for the mark mean crown radius. This corresponds to the observation that there are some situations in the stand with beeches of similar height but overlapping or interacting crowns, see Fig. 1. From an ecological point of view suppression with respect to the mean crown radius is reasonable because the three-dimensional area at some height is not available for crowns of all trees.
Finally, let us discuss the mark correlation function for the mark crown index, see Fig. 5. For mixed inter-specific situations negative correlation is given at small distances. At greater distances the crown indices do not influence each other resulting in values of the mark correlation function approximating 1.
Fig. 5 - Mark correlation for crown index: Solid line: beech-spruce situations; dotted line: spruce; dashed line: beech.
At distances smaller than 45-50 metres negative correlation is given for the beeches and spruces. Within these distances the mark correlation function for the beeches leads to smaller values than the mark correlation function for the spruces. This confirms our results for the other mark correlation functions from Fig. 3 and Fig. 4. There are many overlapping beech crowns in the stand whereas neighbouring spruces tend to different tree heights without overlapping crowns. Obviously, overlapping crowns result in negative correlation with respect to the mark crown index.
Conclusion and discussion
Obviously, there is interaction among trees in forests. From an ecological point of view it is important to distinguish between intra-specific interaction corresponding to trees from one species and inter-specific interaction concerning two or more species. Of course it is possible to model the spatial distribution of trees directly by using a point process model with an intensity function taking into account interactivity, see for example ([9]).
In this paper we present an alternative approach. Sometimes characteristic features of trees like tree height and mean crown radius are available. The spatial distribution of such features or marks of the corresponding spatial point process of tree positions also provides information about interaction in the stand. This information can be measured by the corresponding mark correlation function. The additional mark crown index introduced in this paper helps to understand specific types of inter- and intra-specific interaction. Especially, the spatial structure of the stand can be analysed in a reasonable way. In the study site the spatial structure of the mixed stand is characterized by groups of beeches and spruces in the following way: Many overlapping situations of the crowns of the beeches occur. Similar heights of neighbouring beeches require this behaviour of the beeches. Neighbouring spruces tend to have different heights. Nevertheless, overlapping situations of crowns happen more rarely. It is remarkable for a stand without silvicultural interferences in the last years that interactions between crowns of different species occur very rarely.
Our study has shown that the mark correlation function seems to be a simple tool for indicating the spatial structure in a stand.
With this paper we want to contribute to the broader dissemination of modelling interaction using the mark correlation function in forestry and ecological research. We are convinced of the applicability of this approach in many ecological studies. The simplicity of such approaches connected with the applicability guarantees the chance to use the mark correlation function in various ecological situations and studies.
Acknowledgements
This research was supported by grants from the Deutsche Forschungsgemeinschaft (DFG). The authors are grateful to W. Näther for useful discussions and to N. Frischbier, who measured the crown radii for the 254 trees.
References
Gscholar
Gscholar
Gscholar
Gscholar
Gscholar
Gscholar
Gscholar
Gscholar
Gscholar
Authors’ Info
Authors’ Affiliation
Institute for Stochastics, TU Bergakademie Freiberg (Freiberg University of Mining and Technology), Prüferstrasse 9, D-09599, Freiberg (Germany)
TU Dresden (Dresden University of Technology), Institute for Cartography, D-01062, Dresden (Germany)
Corresponding author
Paper Info
Citation
Wälder K, Wälder O (2008). Analysing interaction effects in forests using the mark correlation function. iForest 1: 34-38. - doi: 10.3832/ifor0449-0010034
Paper history
Received: May 15, 2007
Accepted: Sep 02, 2007
First online: Feb 28, 2008
Publication Date: Feb 28, 2008
Publication Time: 5.97 months
Copyright Information
© SISEF - The Italian Society of Silviculture and Forest Ecology 2008
Open Access
This article is distributed under the terms of the Creative Commons Attribution-Non Commercial 4.0 International (https://creativecommons.org/licenses/by-nc/4.0/), which permits unrestricted use, distribution, and reproduction in any medium, provided you give appropriate credit to the original author(s) and the source, provide a link to the Creative Commons license, and indicate if changes were made.
Web Metrics
Breakdown by View Type
Article Usage
Total Article Views: 55265
(from publication date up to now)
Breakdown by View Type
HTML Page Views: 44100
Abstract Page Views: 3314
PDF Downloads: 6156
Citation/Reference Downloads: 132
XML Downloads: 1563
Web Metrics
Days since publication: 6558
Overall contacts: 55265
Avg. contacts per week: 58.99
Article Citations
Article citations are based on data periodically collected from the Clarivate Web of Science web site
(last update: Mar 2025)
Total number of cites (since 2008): 13
Average cites per year: 0.72
Publication Metrics
by Dimensions ©
Articles citing this article
List of the papers citing this article based on CrossRef Cited-by.
Related Contents
iForest Similar Articles
Research Articles
Discovering interaction between oaks and carabid beetles on a local scale by point pattern analysis
vol. 9, pp. 618-625 (online: 06 May 2016)
Research Articles
Estimation of stand crown cover using a generalized crown diameter model: application for the analysis of Portuguese cork oak stands stocking evolution
vol. 9, pp. 437-444 (online: 02 December 2015)
Research Articles
Estimating the mechanical stability of Pinus nigra Arn. using an alternative approach across several plantations in central Italy
vol. 8, pp. 846-852 (online: 08 April 2015)
Research Articles
Local ecological niche modelling to provide suitability maps for 27 forest tree species in edge conditions
vol. 13, pp. 230-237 (online: 19 June 2020)
Research Articles
Comparison of drought stress indices in beech forests: a modelling study
vol. 9, pp. 635-642 (online: 06 May 2016)
Technical Advances
Forest stand height determination from low point density airborne laser scanning data in Roznava Forest enterprise zone (Slovakia)
vol. 6, pp. 48-54 (online: 21 January 2013)
Research Articles
Incorporating management history into forest growth modelling
vol. 4, pp. 212-217 (online: 03 November 2011)
Research Articles
Fuel characterization and crown fuel load prediction in non-treated Calabrian pine (Pinus brutia Ten.) plantation areas
vol. 15, pp. 458-464 (online: 03 November 2022)
Research Articles
The use of tree crown variables in over-bark diameter and volume prediction models
vol. 7, pp. 132-139 (online: 13 January 2014)
Research Articles
Distribution factors of the epiphytic lichen Lobaria pulmonaria (L.) Hoffm. at local and regional spatial scales in the Caucasus: combining species distribution modelling and ecological niche theory
vol. 17, pp. 120-131 (online: 30 April 2024)
iForest Database Search
Search By Author
Search By Keyword
Google Scholar Search
Citing Articles
Search By Author
Search By Keywords
PubMed Search
Search By Author
Search By Keyword

