Measured and simulated tree and stand water use of Douglas-fir along a climatic gradient across Germany
iForest - Biogeosciences and Forestry, Volume 18, Issue 5, Pages 309-318 (2025)
doi: https://doi.org/10.3832/ifor4922-018
Published: Oct 30, 2025 - Copyright © 2025 SISEF
Research Articles
Abstract
The frequency and severity of summer soil droughts in Central Europe have increased significantly over recent decades, leading to substantial damage in European forests, particularly to Norway spruce. Douglas-fir (Pseudotsuga menziesii [Mirbel] Franco), a non-native tree species, is being explored as a potential alternative for enhancing forest drought resilience. This study focuses on quantifying and simulating the stand water use of Douglas-fir under future climate scenarios at four different sites in Germany that differ in seasonal precipitation distribution and soil characteristics. Sap flow and stem radial changes of up to ten trees per site were measured in combination with volumetric soil water content during the growing seasons of 2022 and 2023 (Apr 1-Sep 30). For each tree, we trained a Random Forest model to close any gaps in the time series due to power shortages. We estimated the stand water use of Douglas-fir at each site and trained the Random Forest model for each site to simulate stand water use under shifted temperature and soil moisture regimes. Mean growing season tree and stand water use was 23.7 ± 13.7 and 0.78 ± 0.23 mm day-1 (mm = kg m-2, ± standard deviation), respectively. The growing season sum of stand water use is linearly correlated to annual growing season precipitation and soil water depletion across all sites. While around 40%-50% of precipitation is used for transpiration, around 80%-90% of soil water in the upper 40 cm is used for plant uptake. Stand water use for 2022 and 2023 could be modeled using only relative soil water availability and the daily maximum in vapor pressure deficit, yielding an accuracy of ~80%. Simulations of stand water use under shifted temperature and soil moisture regimes reveal a strong reduction in water use when soils get drier under future climate conditions. The year 2022 already presented signs of significant water stress, characterized by low soil water availability and reduced stand water use. Looking ahead, climate projections indicate a continued decline in stand water use, which will likely lead to a corresponding reduction in tree growth, potentially impacting forest health and ecosystem resilience.
Keywords
Soil Drought, Sap Flow, Random Forest Modeling, Forest Drought Resilience, Water Use Efficiency, Climate Change, Transpiration
Introduction
Climate change has profound effects on precipitation patterns in Central Europe, particularly in Germany. While winters tend to become wetter, summer months are increasingly characterized by prolonged dry periods ([8], [14]). These changes pose a significant challenge for forestry, as water availability plays a crucial role in the growth and vitality of tree species ([23], [26], [43]). In this context, a better understanding of the water consumption of economically relevant tree species under different climatic conditions is essential.
Douglas-fir (Pseudotsuga menziesii [Mirbel] Franco) is the most important non-native tree species in German and Central European forestry ([24], [6], [30]). It is known for its fast growth, high timber yields, and relatively good drought tolerance ([13], [29], [49]). These characteristics make it a promising option for climate-resilient and productive forests of the future. However, the water uptake and utilization of this species in relation to available water and climatic conditions are not yet fully understood ([45]). In forestry, we need to consider the regional climate development within the next century ([22]).
According to the Sixth Assessment Report of the IPCC, not only temperature levels but also temperature and precipitation regimes will change by 2100, depending on the scenario ([21]). The IPCC assessed the climate response to five different Shared Socio-economic Pathways (SSP), ranging from a very low (SSP1) to a very high (SSP5) greenhouse gas emissions scenario. Each scenario is linked to a Representative Concentration Pathways (RCP) ranging from 1.9 to 8.5 W m-² and representing the radiative forcing associated with the SSP by the year 2100. Under the optimistic SSP1-2.6 scenario, the annual mean temperature in Central Europe is projected to rise by 0.5-1 °C by 2081-2100 (compared to 1995-2014), whereas the SSP3-7.0 scenario predicts an increase of 3-5 °C (Fig. 4.19 in [21]). However, warming will be more pronounced in summer than in winter, with summer temperatures expected to rise by 0.5 to 1 °C more than winter temperatures under the SSP1-2.6 scenario, and by 1 to 1.5 °C more under the SSP3-7.0 scenario (Fig. 4.20 in [21]). Simultaneously, summer precipitation is expected to decrease by 0-10% (SSP1-2.6) or by 10-20% (SSP3-7.0 - Fig. 4.24 in [21]), while relative summer humidity is projected to decline by 2-4% (SSP1-2.6) or 6-8% (SSP3-7.0) by the end of the century (Fig. 4.23 in [21]). This combination of higher temperature, lower summer precipitation, and lower air humidity challenges the resilience of forests.
A thorough understanding of the water consumption of Douglas-fir is therefore crucial for developing sustainable management strategies and increasing forest resilience to climate change. Sap flow, a key indicator of daily water use in trees, is influenced by various environmental factors such as soil moisture, vapor pressure deficit of air (VPD), and precipitation ([35], [38]). Daily variations in stem radius result from changes in water tensions in the xylem, which is directly linked to sap flow ([40]), and also hydration and dehydration of cells in the inner bark of the stem, which is linked to water reserves being drained to maintain sap flow and replenished overnight ([54], [12], [31], [42]).
The objectives of this study were to (1) quantify the water consumption of Douglas-fir trees and stands, and (2) examine how soil moisture and vapor pressure deficit influence water consumption. By (3) comparing the estimated water use with precipitation, soil water content, and stem radial growth, we aim to gain insights into the water use efficiency of Douglas-fir trees. This comparison will help understand the balance between water uptake by trees and the available precipitation, which is critical for forest management and conservation strategies under changing climate conditions. Finally, (4) we project the reduction in stand water use under shifted temperature and soil moisture levels, as expected by the end of the century.
Material and methods
Study sites
Four sites across Germany were selected to represent a gradient in annual precipitation and rainfall regimes. The selected sites are: Bad Belzig (BB), with a dry, continental climate (626 mm annual precipitation) and sandy soils; Rottenburg (RO), with moderate annual precipitation (765 mm) and a sandy silt soil on a clay layer in 45 cm depth; Heinersreuth (HE), characterized by evenly distributed annual rainfall (805 mm) on silty soil with a clay layer in 45 cm depth; and Merzalben (ME), the wettest site with 1026 mm annual precipitation and silty soil (Tab. 1). Detailed descriptions of the sites are reported by Niessner et al. ([31]). All investigated trees were mature, but tree age varied between 45 and 110 years per site, while the average tree height varied between 29.3 and 34 m.
Tab. 1 - Summary of site characteristics based on observations taken within a circular plot of radius 15 m (BB), 20 m (RO and HE), and 25 m (ME) containing all studied trees.
| Characteristic | Year(s) | Bad Belzig (BB) |
Rottenburg (RO) |
Heinersreuth (HE) |
Merzalben (ME) |
|---|---|---|---|---|---|
| Latitude | - | 52.166838° N | 48.446685° N | 49.960089° N | 49.273530° N |
| Longitude | - | 12.514308° E | 8.968711° E | 11.464497° E | 7.807540° E |
| Annual average temperature [°C] |
1986-2015 | 9.2 | 9.1 | 8.5 | 9.3 |
| 2022 | 10.7 | 10.7 | 9.7 | 9.4 | |
| 2023 | 10.7 | 10.9 | 9.3 | 10.2 | |
| Precipitation [mm year-1] |
1986-2015 | 626 | 765 | 805 | 1026 |
| 2022 | 405 | 645 | 692 | 772 | |
| 2023 | 780 | 780 | 935 | 1146 | |
| Elevation [m a.s.l.] | - | 145 | 510 | 450 | 550 |
| Site inclination and exposition | - | flat | ~10% facing SW | flat | flat |
| Stand age [years] | - | 50 | 45 | 110 | 55 |
| Average tree height [m ±SD] | - | 34.1 ±3.0 | 29.3 ±2.8 | 31.4 ±2.9 | 32.5 ±0.9 |
| Forest Site Index (m height at age 100) | - | 37 (Site class II.25) | 43 (Site class 0.75) | 30 (Site class IV.0) | 42 (Site class I.0) |
| Vegetation | - | Pure Douglas-fir (100% of BA) forest with abundant natural regeneration | Almost pure Douglas-fir (74% of BA) forest | Mainly Douglas-fir (88% of BA) forest with few European beech and oak trees | Mainly Douglas-fir (98% of BA) forest with few European beech trees |
| Basal area, BA [m² ha-1] | - | 45.48 | 33.12 | 54.54 | 57.44 |
| Stems ha-1 (>15 cm circumference) |
- | 668 | 560 | 1744 | 366 |
| Soil texture | - | Silty sand | Silty sand with loamy clay below 45 cm | Silty sand with loamy clay below 45 cm | sandy silt |
The growing season (here defined as the 6 months from Apr 1 to Sep 30) of 2022 was very dry at all sites with significantly less precipitation, while 2023 was wetter at all sites, but still with less rainfall during the growing season than during the reference periods of 1961-1990 and 1986-2015 (Tab. 2).
Tab. 2 - Comparison of growing season mean temperature (Tmean, °C) and sum of precipitation (PP, mm - April 1 to September 30).
| Site | 1961-1990 | 1986-2015 | 2022 | 2023 | ||||
|---|---|---|---|---|---|---|---|---|
| Tmean | PP | Tmean | PP | Tmean | PP | Tmean | PP | |
| BB | 14.3 | 323 | 15.0 | 341 | 15.0 | 204 | 15.0 | 305 |
| RO | 13.6 | 476 | 14.5 | 467 | 15.3 | 388 | 15.3 | 412 |
| HE | 13.2 | 399 | 14.2 | 411 | 15.1 | 349 | 14.9 | 397 |
| ME | 13.6 | 514 | 14.7 | 463 | 14.8 | 322 | 15.0 | 410 |
Meteorological data
Data on long-term daily temperature and precipitation were obtained from the DWD/BfG-HYRAS v. 2.0 precipitation dataset ([39], [5]). Hourly values for air vapor pressure deficit (VPD, hPa) were calculated after Goff & Gratch ([16]) from recorded air temperature, humidity, and air pressure (every 30 min) using Watchdog 2700ET weather stations (Spectrum technologies Inc., IL, USA) placed in a clearing close to the site at 2 m height. Data gaps in temperature and humidity for the calculation of VPD were filled with data from nearby DWD weather stations. The values were adjusted using a linear regression through “0” of daily mean VPD recorded vs. data from DWD (Wiesenburg for BB, ID 5546; Hechingen for RO, ID 2074; Heinersreuth-Vollhof for HE, Station ID 320; and Hortenkopf for ME, ID 15187). Volumetric soil water content (VSWC, %) was measured at 20 and 40 cm depth in five points at each of the four sites, except in Bad Belzig, where it was measured at 20 and 60 cm depth due to the sandy soil. VSWC was measured using Teros 10® soil water content sensors (Meter Group, Pullman, WA, USA), connected to open-source data acquisition systems ([32]). The five hourly time series at each site and soil depth were averaged for each soil depth to obtain the site’s average VSWC. Further analyses were then carried out using the daily mean values. Volumetric soil water content (VSWC) is highly influenced by soil conditions ([7]). To account for this variability, VSWC has been normalized as relative extractable water (REW). REW represents the ratio of available soil water and the maximum extractable water, as described by Granier ([18]), and is defined by eqn. 1:
In this context, VSWCmax corresponds to the soil water content at field capacity, while VSWCmin represents the permanent wilting point. To calculate REW, the complete dataset from both years was used, focusing solely on the data from the sensor at 20 cm soil depth. To calculate soil water depletion (in mm or kg m-2) within the upper 40 cm of soil, we first determined the absolute water content for the upper 20 cm using the VSWC at 20 cm and the VSWC at 40 cm for the same volume between 20 and 40 cm. At BB, we measured the VSWC at a depth of 60 cm, but for simplicity, we assumed it was the same at 40 cm. The daily soil water depletion was defined as the daily change in soil water content, considering only negative changes and ignoring increases due to rainfall ([51]). Soil water depletion is mainly governed by the stand water use through transpiration, but also water seepage to deeper soil layers and soil evaporation. The seasonal soil water depletion is the sum over the growing season.
Climate predictions
To estimate the future climate at the four sites, we used regionalized climate projections from the ReKliEs-De Project, available for various parameters and frequencies at the World Data Center for Climate ([52]). We were particularly interested in projections for precipitation and temperatures for the last decade of this century (2091-2100) and in comparing the RCP2.6 (“best-case scenario”) and RCP8.5 scenarios. While the newer SSP scenarios (Shared Socioeconomic Pathways) used in recent IPCC reports combine socioeconomic narratives with associated emission trajectories, the older RCP scenarios (Representative Concentration Pathways) focus solely on different levels of radiative forcing by 2100, such as 2.6 W m-2 for RCP2.6 or 8.5 W m-2 for RCP8.5 ([21], Chapter 4.2.2). For our analysis, we relied on RCP scenarios because the ReKliEs-De Project provides a broader and more consistent dataset for these pathways, particularly at the regional scale relevant to our study. The complete list of simulations from the ReKliEs-De Project used for this study is given in Tab. S1 and Tab. S2 (Supplementary material).
Dendrometer measurements
At each site, ten vital and dominant Douglas-fir trees were selected for dendrometer measurements, as described in detail in Niessner et al. ([31]). Tree age was determined by counting rings of two 5 mm cores (extracted with Haglöf increment borers) at breast height (1.3 m). Tree heights were measured using a TruPulse Laser 200® (Laser Technology, Inc., CO, USA). Stem radius changes were measured with point dendrometers (MMR 10 11 R5 K, Megatron Elektronik AG & Co., Munich, Germany) at a height of 1.3 m with a spatial resolution of <10 μm and every 10 minutes, using the “Loguino” open-source data acquisition system ([32]). Daily stem radius change (SRC) was calculated as the difference between the morning maximum in stem radius of the current day and that of the day before. Maximum daily stem shrinkage (MDS) is the difference between the morning maximum stem radius and the following midday minimum ([11], [10]).
Sap flow measurements
We employed pairs of custom-built sap flow sensors following the method described by Granier ([17], [18]). These sensors were installed at a height of 1.3 meters on the north-facing side of each tree trunk. Each sensor pair consisted of copper-constantan thermocouples inserted into 2 cm long needles positioned in the xylem, spaced approximately 10 cm apart vertically. The upper needle was continuously heated with a current of 120 mA, and temperature differences between the needles were recorded every 10 minutes using the Loguino device, alongside dendrometer data. A detailed description can be found in Niessner et al. ([31]). Sap flow density was calculated by taking the maximum temperature difference of each day and a linear interpolation in between as the corresponding reference value with zero sap flow. The obtained volume flux density of sap flow (in g cm-2 s-1) was further extrapolated for the whole tree, using the R package developed by Berdanier et al. ([4]), considering the tree’s sapwood area. Total sapwood area was obtained from visual inspection of tree cores from each tree. Tree water use (TWU) is defined as the integrated diurnal sap flow.
Tree water use modeling
Statistical analysis, modeling, and data visualization were done using Python v. 3.10.13 ([47]), with its packages NumPy v. 1.22.3 ([19]), pandas v. 1.4.2 ([27]), SciPy v. 1.10.1 ([48]), Scikit-learn ([37]), and Plotly v. 5.22.0 (⇒ https://plot.ly/). Power shortages or individual sensor failures could not always be avoided completely (see Tab. S3 in Supplementary material for a summary of gaps). To estimate daily stand water use, we needed a complete time series of all trees, thus we trained a model for each tree to fill these gaps. For each tree, we trained a Random Forest model for the two years (2022 and 2023) together and also one separately for each year. As variables to predict tree water use (TWU), we chose maximum daily stem shrinkage (MDS), mean daily relative extractable soil water (REW), and maximum daily vapor pressure deficit (VPDmax). To account for gaps (no dendrometer data for the corresponding tree existed), we chose only REW and VPDmax as predictors, which had only slightly worse predictive power (see Tab. S4 and Tab. S5 in Supplementary material for variable importance, accuracy, and R2 of the Random Forest models).
A Random Forest is an ensemble machine learning method that trains multiple decision tree regressors on different subsets of the dataset. Averaging their predictions enhances predictive accuracy and reduces the risk of overfitting ([1]). The risk of overfitting was further reduced by splitting the data in training and test data, which was done using the Scikit-learn “Kfold” function. The data was split into five consecutive and equal folds, and each fold was then used once as a validation, while the k-1 remaining folds formed the training set. This resulted in five different models, and the one with the best prediction score (R²) was selected to predict sap flow during data gaps. The Random Forest models were built using the “RandomForestRegressor” function of Scikit-learn in Python and consisted of 1000 decision trees, forming an ensemble to make a prediction based on the average outcome. The maximum depth of the trees was set to 10, the minimum samples per leaf to 3, and the minimum samples per split to 6. Bootstrap was set to true, and for reproducibility, random state was set to 42 (also for the “Kfold” function). Features were tuned manually, trying reasonable values and maximizing R2 for predicting TWU. Gaps in sap flow data of each tree were finally filled with the model predictions of the corresponding year. When the training of the model for the corresponding year failed to converge, the model for the two years together was used. For periods where dendrometer data were also absent, the corresponding model trained only with REW and VPDmax was used.
Stand water use calculation
Stand water use (SWU) per hectare of Douglas-fir was estimated by fitting a power function (y = a · xb) to the relation between the tree circumference (x) and the total tree water use (y) during the growing seasons of 2022 and 2023 (Apr 1-Sep 30). Fitted parameters and coefficients of determination are presented in Tab. S6 of Supplementary material (see also Fig. S1).
Similar to Paligi et al. ([36]), daily stand water use at a given day d (SWUd, kg m-2 or mm) was calculated as follows (eqn. 2):
where mTWUd (kg) is the mean tree water use of all monitored trees at the site in the day d, tTWUplot is the total water use of all n trees within the plot of size Aplot derived from the fitted power function to the tree circumference, and tTWUtree is the total water use of all m trees monitored. We only took Douglas-fir trees into account, as we did not measure the sap flow of other species. Douglas-fir accounted for 100% (BB), 74% (RO), 88% (HE), and 98% (ME) of the total basal area. The stand structure was relatively homogeneous (typical of a managed forest), and most of the existing trees were dominant and similarly exposed to the sun.
Stand water use simulation
A random forest model for each site was trained to simulate SWU, using the daily maximum VPD and mean REW as predictors. Analog to the random forest models for TWU, model parameters were tuned manually, and the minimum samples per leaf was set to 1 and the minimum samples per split to 2. All other parameters were set equal to the models for single trees. SWU was simulated for the growing seasons of 2022 and 2023 under shifted mean daily temperatures and REW. The average temperature for both years was already 0.7-1.8 °C above the temperature average for 1961-1990 (Tab. 2) and was therefore possibly exceptionally warm. We therefore tested temperature shifts of -2 to +4 °C in 1 °C increments. VPDmax was calculated according to Goff & Gratch ([16]) using the shifted daily maximum temperature. The daily minimum relative humidity was adjusted by -Tshift · 1.5 to account for the change in relative humidity expected by the IPCC report for the years 2081-2100 (Fig. 4.23 in [21]). For REW, we tested a reduction of up to 50% in steps of 10%. The accuracy (%) of the model was calculated with the following formula (eqn. 3):
where f(x) is the modeled value and y is the actual measured value.
Results
Growing season tree and stand water use of Douglas-fir
Tree water use (TWU) of individual Douglas-fir trees at each site is presented in Fig. 1, along with the abiotic site parameters, daily precipitation, maximum vapor pressure deficit (VPDmax), and the relative extractable soil water (REW). A partly synchronous course of TWU and RWE is visible during the growing season of 2022. The main difference between the two years is the distribution of rainfall throughout the season and the corresponding availability of soil moisture (REW). In 2022, all sites experienced a pronounced drought starting in July and ending in mid-September, while in 2023, a short dry period occurred in June and July, but August and September were rather moist. This pattern is also reflected in a skewed distribution of the monthly tree and stand water use in 2022 towards the first half of the growing period (Fig. 2). Likewise, the distribution of TWU and SWU in 2023 follows a hump shape with a depression in July.
Fig. 1 - Daily tree water use (TWU, left y-axis, measured: solid lines, modeled: dashed lines) and corresponding daily mean relative extractable water (REW, black line), maximum air vapor pressure deficit (VPD, red line), and rainfall (PP, blue line) at Bad Belzig (BB), Rottenburg (RO), Heinersreuth (HE), and Merzalben (ME) for 2022 and 2023. Note the partly synchronous course between TWU and REW or VPD.
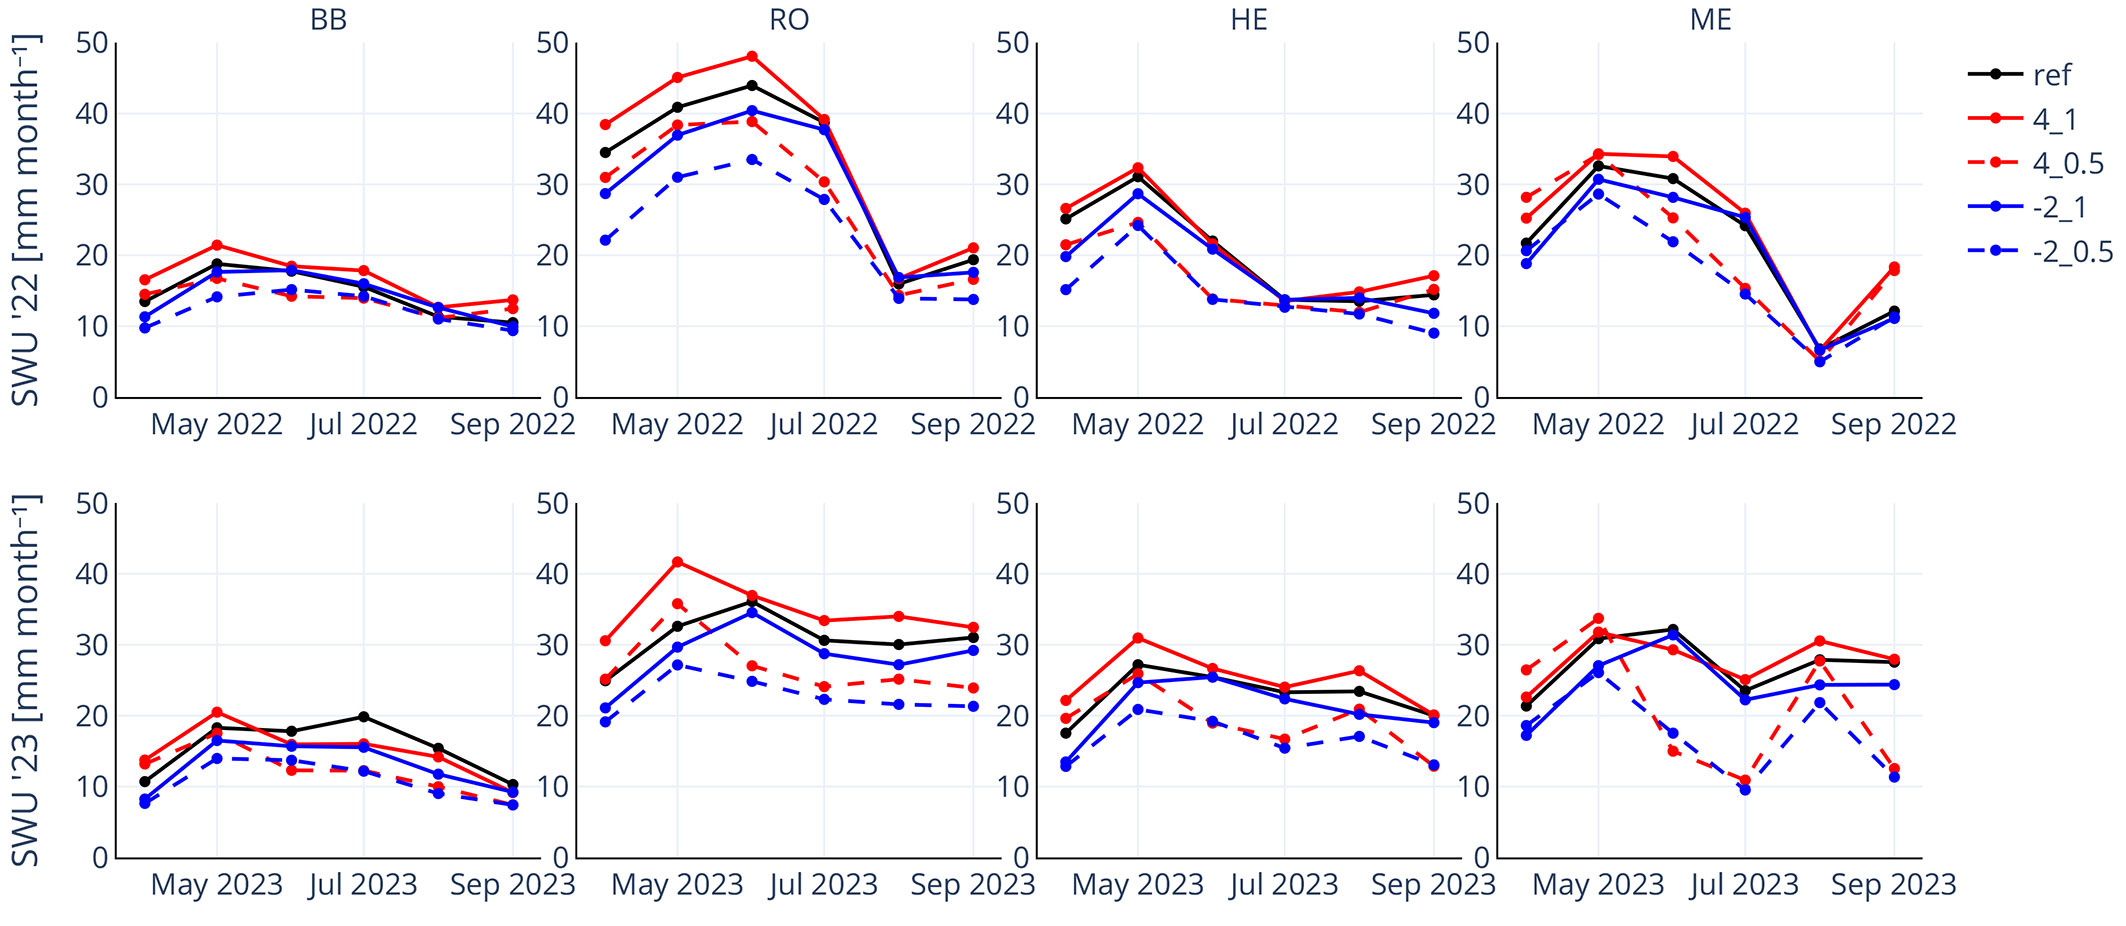
Fig. 2 - Monthly tree and stand water use (TWU and SWU) at all four sites for 2022 and 2023.
The mean daily and total annual TWU and SWU were generally higher during the relatively wetter year of 2023, except at RO (Tab. 3), where TWU and SWU were much higher than at the other sites. The lowest TWU was measured at HE and ME during 2022, but the lowest SWU was estimated for BB.
Tab. 3 - Tree (TWU) and stand (SWU) water use during growing seasons (Apr-Sep) of 2022 and 2023. N = 183 days for each year, n = 4 · 183 for mean±SD (standard deviation) over all sites.
| Site | Mean TWU [kg day-1] |
Mean total TWU [kg season-1] |
Mean SWU [mm day-1] |
Max. SWU [mm day-1] |
Total SWU [mm season-1] |
|||||
|---|---|---|---|---|---|---|---|---|---|---|
| 2022 | 2023 | 2022 | 2023 | 2022 | 2023 | 2022 | 2023 | 2022 | 2023 | |
| BB | 23 ± 13 | 32 ± 15 | 4284 | 5758 | 0.4 ± 0.2 | 0.6 ± 0.2 | 0.91 | 1.01 | 78 | 105 |
| RO | 37 ± 21 | 35 ± 14 | 6842 | 6463 | 1.1 ± 0.6 | 1.0 ± 0.4 | 2.14 | 1.79 | 199 | 188 |
| HE | 17 ± 10 | 19 ± 8 | 3193 | 3511 | 0.7 ± 0.4 | 0.8 ± 0.2 | 1.53 | 1.08 | 125 | 138 |
| ME | 17 ± 12 | 25 ± 10 | 3025 | 4533 | 0.7 ± 0.4 | 1.0 ± 0.3 | 1.39 | 1.72 | 119 | 178 |
| mean | 24 ± 14 | 28 ± 12 | 4336 ± 2612 | 5066 ± 2835 | 0.7 ± 0.3 | 0.8 ± 0.2 | 1.5 ± 0.5 | 1.4± 0.4 | 131 ± 51 | 153 ± 39 |
The estimated importance of REW and VPD for TWU, received from the Random Forest models for each individual tree, shows that REW was most relevant in 2022 for limiting TWU, while in 2023, VPD was more important (see also Tab. S4 and Tab. S5 in Supplementary material).
Seasonal site water balance
Growing season SWU is linearly related to rainfall and soil water depletion during the same period, both within each site but also across all four sites (Fig. 3). SWU accounts for between 34% and 51% of growing season rainfall and 52% to 127% of soil water depletion within the upper 40 cm of soil (Tab. 4). The ratios between SWU and PP in 2022 and 2023 are very similar for each site with no clear tendency, but the ratios between SWU and soil water depletion were consistently higher in 2023. This means that during a dry year like 2022, more water has to be withdrawn from deeper soil depths.
Fig. 3 - Growing season (Apr 1 - Sep 30) stand water use (SWU) in relation to the corresponding sum of rainfall (PP), soil water depletion in the upper 40 cm, and mean stem radial change (SRC) at all four sites. Data points for 2022 (’22) and 2023 (’23) are labeled individually. A 1:1 relation is illustrated with a solid black line and linear regression with a dashed black line. The corresponding functions are given below in each panel. R2 for the linear regression between SRC and SWU could not be calculated, but slopes between the two data points within each site are very similar (BB: 25.8, RO: 35.6, HE: 15.9, ME: 27.0 mm SWU per mm SRC).
Tab. 4 - Ratios between growing season stand water use (SWU, mm) and corresponding rainfall (PP, mm), soil water depletion within the upper 40 cm (mm) and mean stem radial change (SRC, mm).
| Site | SWU / PP | SWU / soil water depletion |
SWU / SRC | |||
|---|---|---|---|---|---|---|
| 2022 | 2023 | 2022 | 2023 | 2022 | 2023 | |
| BB | 0.38 | 0.34 | 0.52 | 0.54 | 59.3 | 43.8 |
| RO | 0.52 | 0.46 | 0.73 | 1.28 | 73.0 | 77.8 |
| HE | 0.36 | 0.35 | 0.56 | 0.65 | 150.4 | 85.3 |
| ME | 0.37 | 0.44 | 0.60 | 0.76 | 39.4 | 34.2 |
| mean | 0.41 | 0.40 | 0.60 | 0.81 | 80.5 | 60.3 |
Annual SWU was only poorly linearly related to SRC across sites, but rather within each site. Higher SWU was consistently related to a larger mean SRC at each site with similar slopes, ranging from 15.9 (HE) to 35.6 mm mm-1 (RO). On average, 70.4 mm of water is used per 1 mm of accumulated SRC, ranging from 34.2 mm (2023 at ME) to 150.4 mm (2022 at HE). This ratio, which represents the reciprocal water use efficiency, is generally higher in the dry year of 2022, except at RO (Tab. 4).
Predicted changes in precipitation and temperature
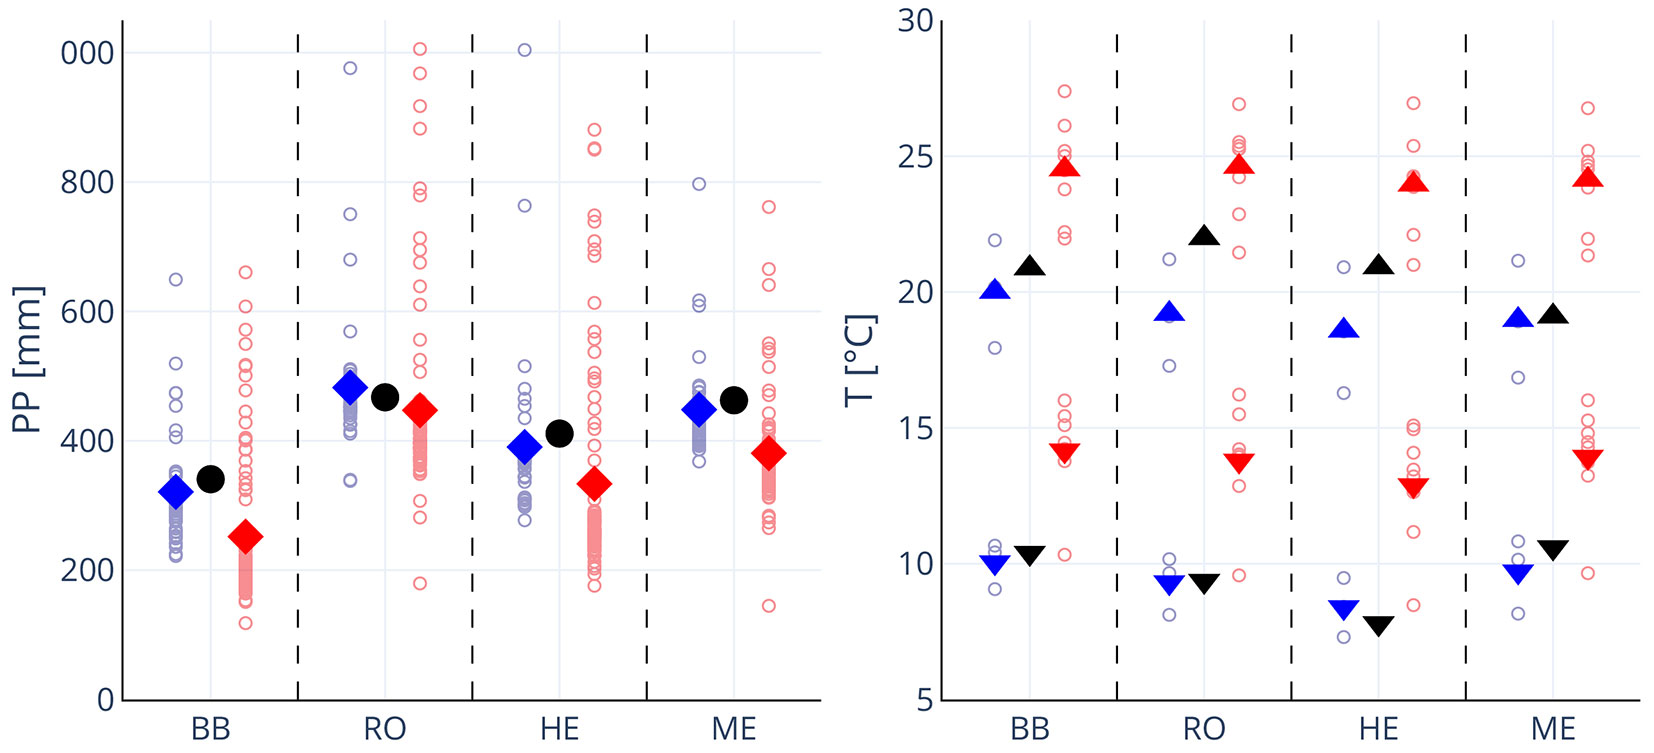
Most regionalized climate models predict lower growing season precipitation for the last decade of this century at all four sites and even under the “best-case” scenario RCP2.6, which represents the maximum 2 °C temperature rise target (Fig. 4, left panel). Minimum and maximum temperatures during the growing seasons of 2022 and 2023 were already relatively high, matching or even exceeding predictions under the RCP2.6 scenario. The RCP8.6 scenario, however, predicts even higher temperatures for the end of this century at all sites and particularly for minimum temperatures (Fig. 4, right panel).
Fig. 4 - Predicted growing season precipitation (left panel), Tmin and Tmax for 2091-2100 (right panel). Solid black dots (left) represent the mean growing season precipitation between 1985 and 2015, and black triangles (right) represent the minimum and maximum temperatures at each site for the growing seasons of 2022 and 2023 together. Each open blue circle indicates the prediction of a ReKliES-De ensemble model for the RCP2.6 scenario, and open red circles indicate the projections for the RCP8.5 scenario. Solid diamonds show the respective mean of all model predictions.
Simulation of sap flow under different scenarios
Random Forest models for SWU at each site and for the two years yielded high accuracies (80%-90%) and coefficients of determination (0.82-0.94 - Tab. 5). REW and VPD were mostly equally important for predicting SWU; only at BB, VPD was more crucial (59%).
Tab. 5 - Importance of relative extractable soil water (REW) and air vapor pressure deficit (VPD) in percentage, accuracy (Acc, %, see eqn. 3) and R2 of random forest models for predicting stand water use of Douglas-fir at each site.
| Site | REW (%) | VPD (%) | Acc (%) | R2 |
|---|---|---|---|---|
| BB | 41.2 | 58.8 | 79.8 | 0.82 |
| RO | 48.5 | 51.5 | 88.9 | 0.94 |
| HE | 51.4 | 48.6 | 90.3 | 0.92 |
| ME | 51.0 | 49.0 | 82.5 | 0.90 |
| mean | 48.0 | 52.0 | 85.4 | 0.90 |
A simulation of SWU under shifted soil moisture and/or temperature regimes shows that a reduction in REW generally reduces SWU (Fig. 5), while an increase in temperature, and therefore a higher VPD, may increase growing season SWU if soil moisture allows for higher withdrawal of water from soils. The reduction in simulated SWU was generally less in the dry year 2022. Since precipitation was higher in 2023 and more frequent later in the year, resulting in higher REW, the potential reduction in SWU under dry conditions is greater. This is also shown in Fig. 6, where SWU was generally very low during the second half of the growing season and therefore the scope for reduction is also small. Potential for increasing SWU exists primarily in the first two to three months of the growing season, when there is still plenty of soil water available. Under the most extreme scenario (4 °C higher average daily temperatures, 50% reduction in extractable water from the soil), the models show a reduction in SWU of 2.5%-14.6% and 12.2%-25.7% compared to 2022 and 2023, respectively. The models predict the strongest reduction in SWU for a 50% reduction in REW, with a simultaneous average cooling of 2 °C (compared to the values of 2022/2023) and thus a lower VPD.
Fig. 5 - Percentage changes in growing season stand water use (SWU) under shifted temperature (T) and relative extractable soil water (REW) regimes, compared to the measured values in 2022 and 2023.
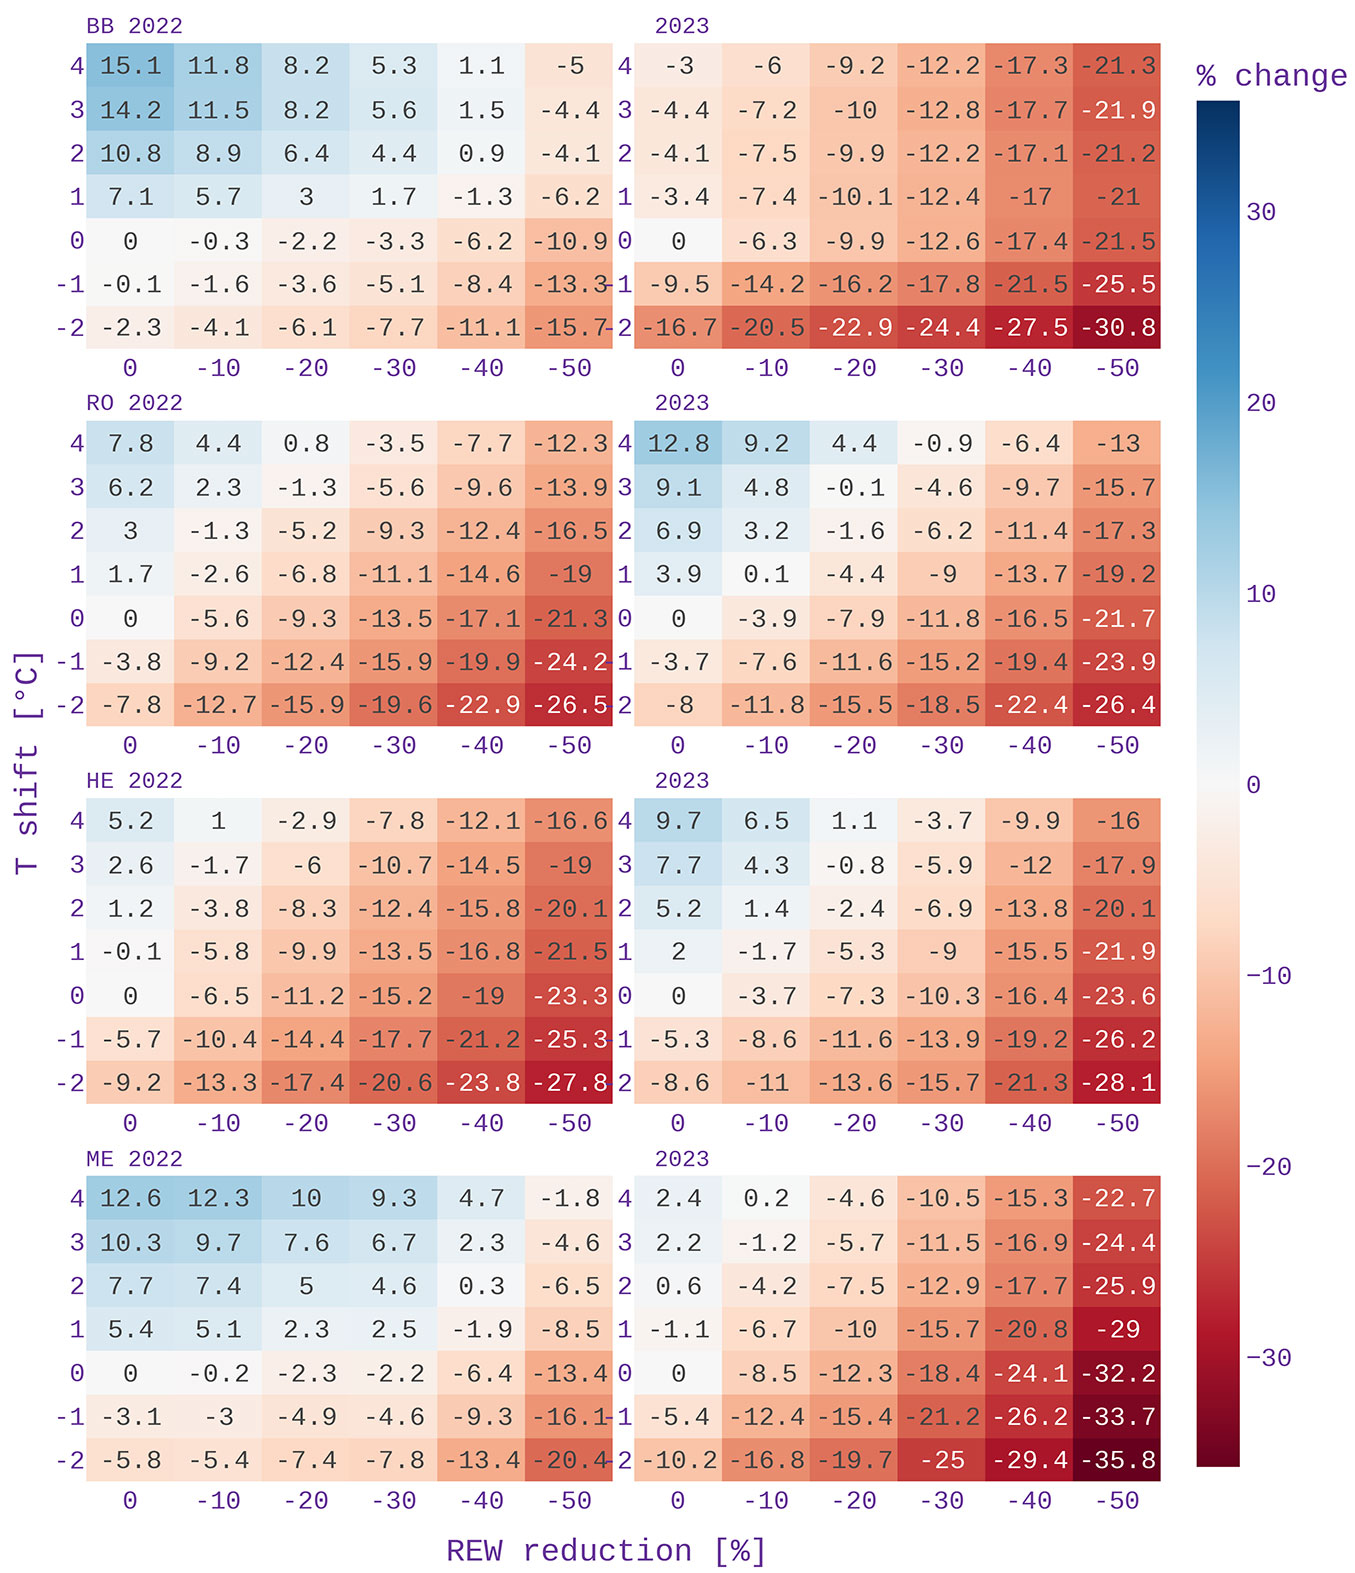
Fig. 6 - Monthly stand water use (SWU) under shifted temperature and relative extractable soil water (REW) regimes. Solid black line represents SWU under the temperature and REW regime given in 2022 and 2023 as a reference (ref), while red lines represent monthly SWU under a temperature shift of +4 °C and unchanged REW (solid line) and halved REW (dashed line). Analogously, the blue lines show SWU under a temperature shift of -2 °C, with REW unchanged (solid line) and halved (dashed line).
Discussion
Tree and stand water use of Douglas-fir
We report that the daily water usage of Douglas-fir trees ranges from 17.4 to 37.4 kg day-1, while the stand’s daily water consumption varies between 0.43 and 1.09 mm, with a seasonal total of 78 to 199 mm (Tab. 3). Our estimated quantities of daily and seasonal TWU and SWU are well within the range of values reported for Douglas-fir stands of similar age and site conditions. For example, Thomas et al. ([44]) report an average of <0.6 mm day-1 and 155 mm year-1 for a 40-year Douglas-fir stand close to our site ME. Moore et al. ([28]) even report daily values of 1.5-3.0 mm per day for a 40-year-old Douglas-fir stand in Central Oregon (CA, USA) at a site with a mean annual precipitation of 2300 mm per year. Simpson ([41]) reports an average daily early summer TWU of trees with diameters of 7.5-70 cm varying from 1.8 to 166 kg day-1 and a SWU of 1.08 and 1.5 mm day-1 for two sites in British Columbia, Canada. We recorded a maximum daily SWU of 0.9 to 2.1 mm, which is at the lower end of the range (1.2-4.0 mm) reported in a review by Leuschner & Meinzer ([25]).
Our calculations of the TWU and SWU are a relatively conservative low estimate because we determine a point with zero flow for each day. Therefore, transpiration at night under dry air conditions is not taken into account. Nighttime transpiration, however, is generally very low and occurs only under warm air and windy conditions, and when soil water is available. For Douglas-fir, Dawson et al. ([9]) report a nighttime sap flow velocity of 1-7% of daily velocities for coastal temperate and temperate deciduous and coniferous forests in the USA.
For the relatively dry year 2022, Paligi et al. ([36]) reported an annual water use of 292 mm, compared to 472 mm recorded in 2021, for a 70-year-old Douglas-fir stand in the Lüneburg Heath, Germany. It is important to note that our analysis only considered Douglas-fir stems for stand water use, excluding other species and the understory. However, Douglas-fir contributes from 74% to 100% of the basal area at our sites ([31]). In Paligi et al. ([36]), 14.6% of the sessile oak present was included by treating it as equivalent to Douglas-fir individuals, which, however, does not account for the 47% higher stand water use they reported for 2022. As we only took measurements on the dominant and vital trees, the water consumption of the stand may be slightly overestimated. However, the stand structure was relatively homogeneous, which means that the error is expected to be rather small.
Most authors report annual water use instead of growing season water use, which we refer to as considering only observations between April 1 and September 30. Reliable quantifications of winter sap flow in Douglas-fir are virtually absent, and in most studies reporting annual estimates, it remains unclear whether the full 365 days of the year were considered. During winter, maintaining a constant power supply to the sensors’ heaters is particularly challenging, which is why we lack continuous recordings between October and March, except at the ME site, where we had access to grid electricity. The water reserves in the soil had filled up well again after the rainfall at the end of September, which meant that in October and November, SWU accounted for 15.8% and 6.0%, respectively, of the growing season SWU for 2022 (data not shown). Overall, our method yields a SWU between October 2022 and March 2023 of 48% of the growing season SWU for 2022 or 32% of the whole year SWU (April 2022-March 2023). In general, however, water consumption is relatively low in winter due to the low temperatures and low evaporative demand. The stem water content is also reduced ([50], [3]), and there is practically no water flow at temperatures below 0 °C (data not shown).
The highest sap flow rates and tree water use quantities were measured in RO, resulting in the highest water consumption per site at this location, despite a relatively small basal area. This site also yielded the highest forest site index by Noack ([34]), indicating the theoretical tree height at age 100 (Tab. 1). It appears that seasonal SWU is rather linearly scaled with growing season precipitation, both within and across all sites (Fig. 3, right panel).
Site water balance
About 40% of the growing season precipitation was consumed by Douglas-firs through transpiration at all sites (Tab. 4), leaving 60% percent for other plants, canopy interception losses, soil water evaporation, vertical drainage, and possibly above-ground run-off if the terrain is inclined. Tiktak & Bouten ([46]) quantified the annual site water balance over 30 years for a Douglas-fir stand on sandy soils in the Netherlands. They reported that transpiration accounted for about 40%-43% of precipitation on an annual (not seasonal) basis, which is similar to our findings. There, interception accounts for 35%-38%, soil water evaporation for 3%-4% and vertical drainage for 21%-23% of water losses.
Across all sites, on average, 68% of the water within the upper 40 cm of soil was lost through transpiration, leaving 32% for evaporation at the surface and vertical drainage. Although between 65% and 75% of fine root biomass should be allocated within the upper 40 cm of soil, water uptake during droughts shifts progressively deeper ([33], [51]). At our sites, about 90% of fine and coarse roots could be found within the upper 35 to 45 cm; only at ME, with its sandy silt soils, fine and coarse roots could be found down to 60 cm of soil depth ([31]). Particularly at RO and HE, water uptake was probably limited to the upper 45 cm, as a loamy clay layer begins there, which was not penetrated by roots. In 2023 at RO, SWU even exceeded soil water depletion by 27% during the growing season. If both water consumption and precipitation occur on the same day, the soil water content may remain unchanged compared to the previous day, though the trees are using water. This could lead to an underestimation of the actual water depletion by the trees. While soil water depletion calculation is based on the top 40 cm of soil, trees often access water from deeper soil layers that are not accounted for in this study ([33], [51]). Thus, the higher sap flow may reflect water uptake from deeper sources. The lower ratios of SWU and soil water depletion in 2022 compared to 2023 (Tab. 4) also suggest that in 2022, more water was withdrawn from deeper soil depths.
A higher growing season precipitation leading to water available in soils for transpiration ultimately permits higher growth rates (Fig. 3, right panel). The water use efficiency (WUE) is generally used to show the relationship between plant productivity and its water use. It is defined as the amount of carbon assimilated per unit of water used ([20]). Here, we report the ratio between site water use and the mean accumulated stem radial change for Douglas-fir, representing the reciprocal WUE on an area/site basis. On average, 70.4 mm (kg m-2) of water was used per 1 mm of mean radial increment, and an increase in rainfall during the growing season in 2023 (except at RO) led to an increase (decrease for RO) in stem radial growth by 26.1 mm of water per mm in stem radial growth. Conversely, an increase in site water use by 1 mm led, on average, to a 42 µm increase in stem radial growth, ranging from 28.1 µm in RO to 62.7 µm in HE. Assuming that SWU increases on average by 0.41 mm per 1 mm increase in precipitation (Fig. 3, left panel), an increase in precipitation by 1 mm would result in an increase in growth by 17.2 µm on average. This would mean that to increase the radial growth of Douglas-fir by 1 mm per growing season, rainfall during the growing season would need to increase by about 58 mm. Alternatively, one could irrigate the forest, thereby excluding canopy interception and minimizing surface runoff, so theoretically only charging the upper 40 cm of soil (Fig. 3, central panel). This would require at least 34.5 mm or 345.065 kg of water per hectare.
We expected Bad Belzig (BB), as the site with the most continental climate and low annual precipitation, to be the most water-conservative and efficient in terms of water use per mean stem growth. However, this site was only second behind Merzalben (ME), the most humid and oceanic characterized site, and according to our analysis, the site with the highest WUE. The primary reason for the lower WUE in BB is likely due to the sandier soil at the BB site, which leads to greater water percolation losses, thereby reducing the amount of water available for plant uptake.
Stand water use scenarios and the relevance of soil (REW) and air moisture (VPD)
Our analysis demonstrates that TWU and SWU can be accurately modeled using only daily maximum VPD and soil REW as predictors. However, incorporating the maximum daily radial stem shrinkage (MDS) into the TWU model enhances accuracy (compare Tab. S4 and Tab. S5 in Supplementary material). The model quantifies VPD and REW as roughly equally important, though their influence varies: REW primarily limits transpiration in dry years (e.g., 2022), while VPD plays a greater role in humid years (Tab. 5, Tab. S4, Tab. S5 in Supplementary material).
Until the end of this century, most regionalized global climate model ensembles (ReKliEs-De) predict a reduction in growing season rainfall and an increase in daily minimum and maximum temperature (Fig. 4), which would lead to lower soil REW and an increase in VPD. Our simulation of SWU under a shifted temperature and REW regime predicts a general stimulation of site transpiration due to a higher atmospheric demand (VPD). However, this is strongly limited and reduced by soil desiccation and, therefore, lower soil REW. The predicted changes in SWU compared to the dry year 2022 are rather small, as soil moisture was already strongly limiting transpiration, especially in the second half of the growing season ([31]). The following year, 2023, was considerably more humid, but mean temperatures remained higher than the long-term average, and rainfall was lower. However, considering this as a “normal” year, the predicted reduction in SWU under the most extreme scenario (+4 °C, -50% REW) is between -12% at the site RO (rather continental rainfall regime) and -26% at ME (rather oceanic rainfall regime).
Tiktak & Bouten ([46]) reported a 31% reduction in annual SWU in 1976 due to droughts during the 30 years analyzed (1960-1990). This reduction in SWU is primarily a consequence of the trees’ closed stomata to avoid drying out and damage to tissues. However, this inevitably leads to lower CO2 uptake for carbon assimilation and consequently growth, which can also be seen in the right panel of Fig. 3. This ultimately raises the question of how high the maximum reduction in annual or seasonal SWU can be and over how many years before the trees practically starve or can no longer withstand pests. Rainfall exclusion experiments ([15], [53]) show a significant reduction in sap flow of trees, but no impact on growth. Unfortunately, such experiments are very rare and usually limited to young stocks on small sites due to the logistical challenges. Appropriate forest management with adequate thinning would evidently reduce water stress ([2]) and minimize the risks of drought damage.
Conclusions
Random Forest models have proven to be effective tools for closing data gaps in tree water use and project stand water use. Key environmental variables such as vapor pressure deficit, relative extractable water in the soil, and, if available, tree radial changes can serve as strong predictors for tree and stand water use. The year 2022 already presented signs of significant water stress, characterized by low soil water availability and reduced stand water use. Looking ahead, climate projections indicate a continued decline in stand water use, which will likely lead to a corresponding reduction in tree growth and stand productivity, potentially impacting forest health and ecosystem resilience.
List of abbreviations
The following abbreviations have been used throughout the paper:
- BB: Bad Belzig;
- RO: Rottenburg;
- HE: Heinersreuth;
- ME: Merzalben;
- MDS: Maximum daily stem shrinkage;
- PP: Precipitation;
- RCP: Representative Concentration Pathways;
- REW: Relative extractable soil water;
- SPSS: Shared Socio-economic Pathway;
- SRC: Stem radial change;
- SWU: Site water use;
- TWU: Tree water use;
- VPD: Vapor pressure deficit of air;
- VSWC: Volumetric soil water content.
Acknowledgements
This work was supported by the FNR-Waldklimafonds (German Federal Agency on Renewable Resources - Forest Climate Fund/German Federal Ministry of Food and Agriculture and German Ministry for the Environment, Nature Conservation and Nuclear Safety) within the project “Douglas Goes Risk” under the grant no. FKZ 2219WK37B4.
The authors would like to thank all the forestry offices in Bad Belzig, Bayreuth, Trippstadt, and Rottenburg for supporting this study and allowing us to set up measuring devices in the forests. We also thank everyone who actively supported us in the field or contributed ideas for the study. Thanks to the critical remarks of the reviewers, which helped improve the manuscript.
AN contributed to the data curation, formal analysis, methodology, visualization, and writing the original draft; SE contributed to the methodology, field measurements, formal analysis, writing the original draft, and review and editing; RZ, GS, AL, and SH contributed to the conceptualization, project administration, supervision, and review and editing.
References
Gscholar
Gscholar
CrossRef | Gscholar
Gscholar
CrossRef | Gscholar
Gscholar
Gscholar
CrossRef | Gscholar
Authors’ Info
Authors’ Affiliation
Stefan Ehekircher 0000-0002-4133-3173
Göran Spangenberg 0000-0003-2650-2132
Sebastian Hein 0000-0002-4009-9282
University of Applied Forest Sciences, Schadenweilerhof, 72108 Rottenburg am Neckar (Germany)
University of Applied Sciences Erfurt, Forestry and Ecosystem Management, Leipziger Straße 77, 99085 Erfurt (Germany)
Alexander Land 0000-0002-8579-9880
University of Hohenheim, Institute of Biology (190a), Garbenstraße 30, 70599 Stuttgart (Germany)
Corresponding author
Paper Info
Citation
Niessner A, Ehekircher S, Spangenberg G, Zimmermann R, Land A, Hein S (2025). Measured and simulated tree and stand water use of Douglas-fir along a climatic gradient across Germany. iForest 18: 309-318. - doi: 10.3832/ifor4922-018
Academic Editor
Marco Borghetti
Paper history
Received: Jun 08, 2025
Accepted: Sep 30, 2025
First online: Oct 30, 2025
Publication Date: Oct 31, 2025
Publication Time: 1.00 months
Copyright Information
© SISEF - The Italian Society of Silviculture and Forest Ecology 2025
Open Access
This article is distributed under the terms of the Creative Commons Attribution-Non Commercial 4.0 International (https://creativecommons.org/licenses/by-nc/4.0/), which permits unrestricted use, distribution, and reproduction in any medium, provided you give appropriate credit to the original author(s) and the source, provide a link to the Creative Commons license, and indicate if changes were made.

Web Metrics
Breakdown by View Type
Article Usage
Total Article Views: 5276
(from publication date up to now)
Breakdown by View Type
HTML Page Views: 2629
Abstract Page Views: 1400
PDF Downloads: 1106
Citation/Reference Downloads: 1
XML Downloads: 140
Web Metrics
Days since publication: 247
Overall contacts: 5276
Avg. contacts per week: 149.52
Article Citations
Article citations are based on data periodically collected from the Clarivate Web of Science web site
(last update: Mar 2025)
(No citations were found up to date. Please come back later)
Publication Metrics
by Dimensions ©
Articles citing this article
List of the papers citing this article based on CrossRef Cited-by.
Related Contents
iForest Similar Articles
Research Articles
Oak sprouts grow better than seedlings under drought stress
vol. 9, pp. 529-535 (online: 17 March 2016)
Review Papers
Quantifying and modeling water availability in temperate forests: a review of drought and aridity indices
vol. 12, pp. 1-16 (online: 10 January 2019)
Research Articles
Comparison of drought stress indices in beech forests: a modelling study
vol. 9, pp. 635-642 (online: 06 May 2016)
Research Articles
Leaf transpiration of drought tolerant plant can be captured by hyperspectral reflectance using PLSR analysis
vol. 9, pp. 30-37 (online: 05 October 2015)
Research Articles
Response of juvenile progeny of seven forest tree species and their populations to simulated climate change-related stressors, heat, elevated humidity and drought
vol. 11, pp. 374-388 (online: 15 May 2018)
Research Articles
Multi-temporal influence of vegetation on soil respiration in a drought-affected forest
vol. 11, pp. 189-198 (online: 01 March 2018)
Research Articles
Sap flow, leaf-level gas exchange and spectral responses to drought in Pinus sylvestris, Pinus pinea and Pinus halepensis
vol. 10, pp. 204-214 (online: 01 November 2016)
Research Articles
Contrasting holm oak provenances show different field performance but similar resilience to drought events eight years after planting in a Mediterranean environment
vol. 11, pp. 259-266 (online: 29 March 2018)
Research Articles
Coupling daily transpiration modelling with forest management in a semiarid pine plantation
vol. 9, pp. 38-48 (online: 06 August 2015)
Research Articles
Is Pinus pinea growth affected by climate change in western Anatolia?
vol. 18, pp. 93-101 (online: 28 April 2025)
iForest Database Search
Search By Author
Search By Keyword
Google Scholar Search
Citing Articles
Search By Author
Search By Keywords
PubMed Search
Search By Author
Search By Keyword


