
Urban land degradation risks under climate change: a RUSLE-based approach
iForest - Biogeosciences and Forestry, Volume 19, Issue 4, Pages 244-253 (2026)
doi: https://doi.org/10.3832/ifor4898-019
Published: Jul 16, 2026 - Copyright © 2026 SISEF
Research Articles
Abstract
Soil erosion is a critical factor contributing to land degradation, and its dynamics in urban environments is influenced by a combination of anthropogenic activities and climate change. This study evaluates the impact of climate change on soil erosion in Belgrade’s urban landscape using the Revised Universal Soil Loss Equation (RUSLE) model and climate projections from the EURO-CORDEX dataset. The analysis was conducted for the reference period (2001-2019) and projected for three future time frames (2016-2035, 2046-2065, 2081-2100) under two greenhouse gas emission scenarios (RCP4.5 and RCP8.5). The results indicate that the intensity of soil erosion will vary depending on the climate scenario. In the reference year 2019, the average annual soil loss was 4.15 t ha-1 y-1. In future periods, soil erosion is expected to increase under the RCP4.5 scenario, with values ranging from 4.2 to 4.25 t ha-1 y-1. In contrast, the RCP8.5 scenario shows more pronounced fluctuations, ranging from 3.71 to 4.39 t ha-1 y-1. The spatial analysis shows that the most vulnerable areas are those with steep slopes and degraded vegetation cover, while the expansion of impervious surfaces in urban areas further exacerbates the risks of surface runoff and erosion. These findings underscore the urgent need for tailored urban planning strategies and sustainable land management practices in urban areas. The preservation of vegetation cover, the implementation of soil protection measures, and the integration of climate projections into urban development planning can substantially mitigate the adverse effects of erosion. This study provides valuable insights that can support more effective decision-making in land conservation and urban planning in the context of climate change.
Keywords
Soil Erosion, RUSLE Model, Climate Change, Urban Landscape, Land Degradation.
Introduction
Soil erosion poses a global threat to soil and water resources. Rainfall kinetic energy and wind are the primary drivers of degradation, with water erosion being considered the most important ([4]). Taking into account both time-static and time-dynamic parameters, agricultural soils and degraded forests are more sensitive to erosion processes and their intensity than natural meadow-grazing areas ([38]). Numerous studies have shown that anthropogenic activities are the main cause of land use change ([26]). In addition to anthropogenic factors, natural conditions such as lithology, hydrology, topography, climate, and soil properties play a significant role in erosion dynamics ([17]). The intensity of erosion processes is most strongly associated with inappropriate cultivation of agricultural land in areas with tropical and semiarid climates ([50]). However, soil erosion is not only present in agricultural areas but is also increasingly recognized as a phenomenon affecting urban areas.
Urbanization is an inherent feature of civilizational development, with more than half of the world’s population living in cities ([34]). Urbanization can be defined as the concentration of human activity in residential and industrial areas, accompanied by wide-ranging environmental impacts ([21]). This process is further accelerated by climate change. In arid regions, the risk of desertification and soil erosion increases, leading to increased migration from rural to urban areas ([49]), and urban areas are expanding at the expense of the surrounding rural areas ([10]). Urbanization leads to some positive changes such as economic growth and improvement of people’s living standards ([27]), but it also brings negative environmental impacts: intensification of climate change impacts ([36]), increased pollution of all environmental media ([24]), loss of productivity of agricultural land ([20], [45]) and deterioration of public health ([63]), as well as habitat fragmentation and biodiversity loss. Inadequate land use, driven by increasing anthropogenic pressure, significantly accelerates erosion processes ([7]). It is estimated that about 2 billion ha of the world’s total land area are affected by erosion processes caused by human activities ([30]). The increase in urban population leads to an increase in impervious surfaces that are paved, concreted, or extremely compacted due to excessive loading ([58]). In addition, impervious surfaces increase pollutant accumulation and negatively impact surface and groundwater regimes ([56]). Impervious surfaces increase the frequency and intensity of surface runoff, with associated erosion processes ([54]), leading to the congestion of drainage channels, sewage and drainage systems, filling of water sources and water accumulations ([58]), and lowering of groundwater levels ([59]). Intense erosion processes contribute to increased greenhouse gas emissions ([19]), nutrient transport, and the deposition of sterile erosion material on arable land ([29]).
To assess land degradation, it is necessary to identify the hazard zones (zones of erosion production) and the vulnerable zones (zones where the effects of erosion processes are manifested) and to anticipate possible future changes in these processes. To this end, experts worldwide have developed numerous methods, techniques, and innovative approaches. Various empirical, conceptual, and physical models ([11]) are found in the scientific literature for qualitative and quantitative assessment of soil erosion at plot, catchment, and global scales ([57]). These models differ in their complexity, data coverage and ability to predict soil loss ([16]). Recent studies using high-resolution satellite imagery, machine learning techniques, and modern geographic information system (GIS) tools analyzed the impact of global warming on land degradation ([16]).
The aim of this study is to assess the impact of climate change on land degradation in the area of the urban landscape of Belgrade, Serbia, specifically the area defined by the Master Plan of Belgrade (MPB), using the Revised Universal Soil Loss Equation (RUSLE - [53]) and a climate simulation of the regional climate model EURO-CORDEX ([25]). The novelty of this study lies in its combined approach to assessing erosion risks in Belgrade’s urban environment, integrating the RUSLE model with climate projections from the EURO-CORDEX database and GIS-based spatial analyses. This approach provides insights into the spatial patterns of land degradation under climate change conditions and establishes a foundation for incorporating erosion risk into urban planning policies. For this purpose, soil loss was quantified in the reference period 2001-2019, and then precipitation projections were used to estimate the soil loss in three future periods: the near future (2016-2035), the middle of the century (2046-2065), and the end of the century (2081-2100). The analyses were carried out using two selected climate scenarios for greenhouse gas emissions: RCP4.5 (a scenario in which emissions stabilize from 2040 onwards) and RCP8.5 (a constant-increase scenario). Land cover was inventoried using Landsat 8 OLI/TIRS satellite imagery from 2019 and the Random Forest classification method ([5]). Land cover structure was one of the parameters used to assess land degradation, and for all three future periods, the 2019 land cover map was used to assess the impact of climate change on soil erosion, assuming no significant changes in land cover.
The Urban Development Master Plan is a fundamental component of national legislation on urban and spatial planning. It represents a long-term strategy that defines the basic projections of the development and physical planning of urban areas and prescribes the organization of urban spaces construction and protection. One of the basic principles of urban planning is the conservation of areas suitable for agricultural production, natural values, and the environment, while taking into account the environmental and neighboring settlement potentials and constraints. In addition, urban planning must take into account the impact of urban expansion on natural resources and their sustainable use. The results of such planning create a meaningful database that enables efficient and sustainable land use management. This data is necessary to make informed decisions that improve the protection of natural resources and ensure the long-term sustainability of urban areas. The methodology used in this process can be successfully adapted and transferred to other urban areas. Even under varying climatic, geographical, and economic conditions, the principles of land conservation and the protection of natural resources and the environment can be integrated into urban planning to ensure the sustainable development of cities and regions. The application of such strategies in different urban environments allows for the creation of functional, environmentally sustainable, and socially acceptable spaces adapted to modern needs and challenges.
This study contributes to the field of land degradation risk assessment in urban environments by integrating the RUSLE model with climate projections from the EURO-CORDEX database. Although the RUSLE model is frequently employed in rural and agricultural contexts, its utilization within the urban landscape of Belgrade - combined with multi-decadal climate scenarios (RCP4.5 and RCP8.5) - offers a novel perspective on the spatial dynamics of erosion processes under changing climatic conditions. The added value of this research lies in linking climate projections with urban planning principles, thereby establishing a basis for integrating erosion risk assessment into the city’s sustainable development strategies.
Materials and methods
Study area
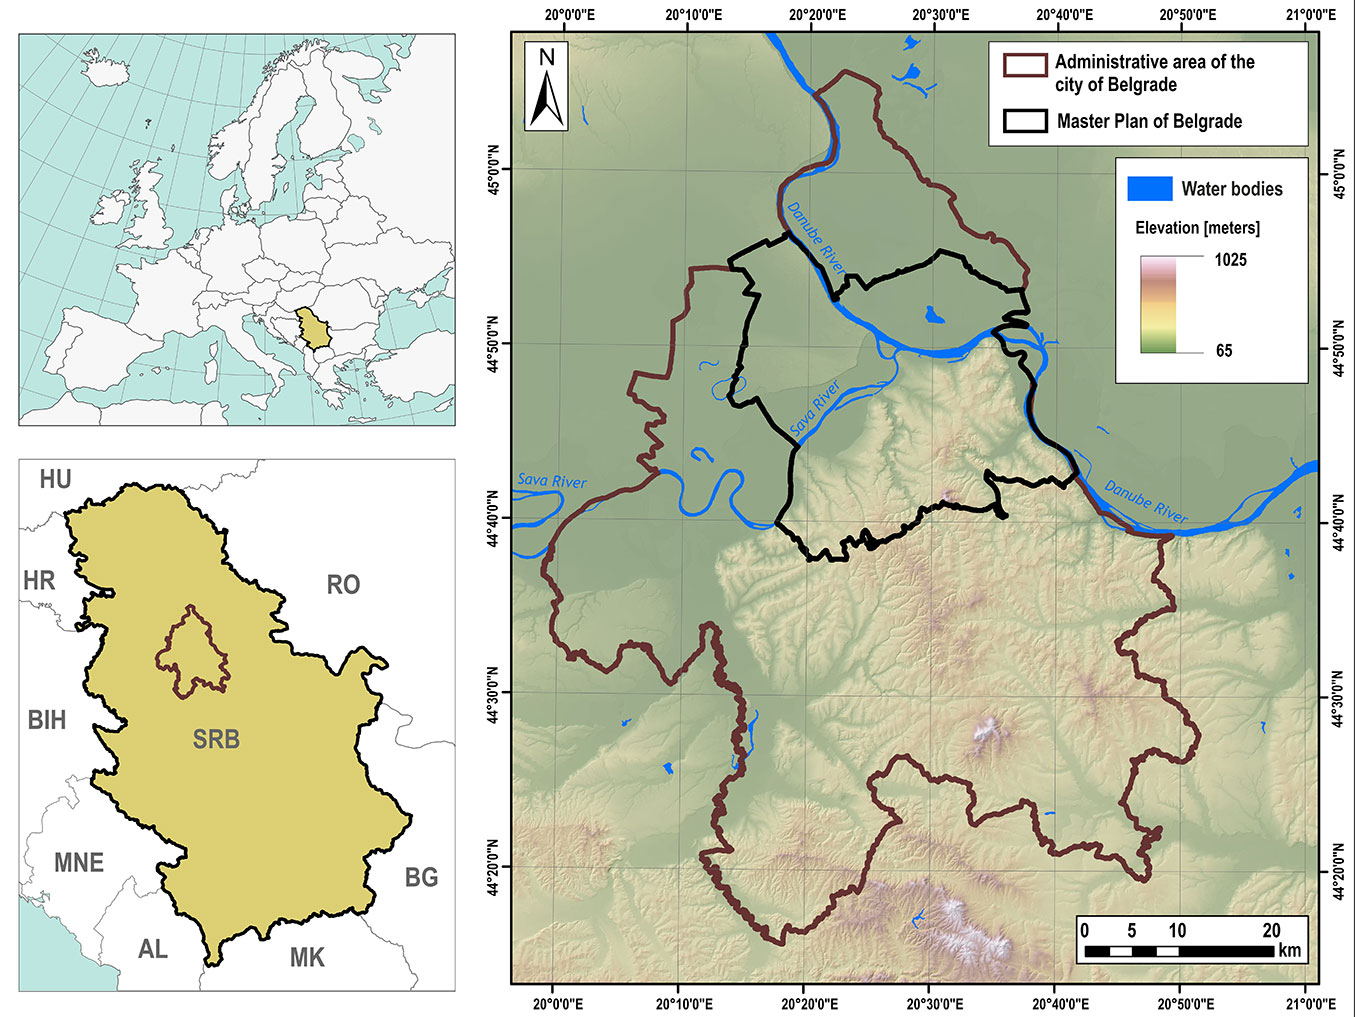
The development of a Master Plan (MP) is part of the national spatial planning regulation, which shapes spatial development processes and serves as a strategic development plan for large cities in the Republic of Serbia. The MP for the capital of Serbia, Belgrade, covers 778.52 km2 and two distinct relief units (Fig. 1). The northern part is characterized by a flat landscape, while the southern part is more complex, featuring typical hilly-to-mountainous relief. The Danube and Sava rivers delineate the boundary between these two relief units, influence the city’s urban microclimate, and serve as receiving waters for urban watercourses. The territory of the MP has a mean altitude of 120 m a.s.l. (ranging from 70 to 500 m a.s.l.), with a dense hydrographic network in the hilly-mountainous part and a complex system of ameliorative channels in the lowland area. Numerous intermittent flows in the southern part of the MP are a key factor in frequent torrential floods. The terrain’s geological structure is complex and influences pedogenesis. It is dominated by chernozem, cambisol, and alluvial deposits, which are the most common soil types ([46], [3]).
Fig. 1 - Study area of the Master Plan of Belgrade, Serbia.
Data sources
Land degradation assessment and soil erosion assessment were carried out using precipitation data, a digital elevation model (DEM), a land cover map, a soil map with information on soil type, sand, clay, silt, and organic carbon content, and representative concentration pathway (RCP) scenarios (Tab. 1).
Tab. 1 - Data inventory for the RUSLE model and data sources.
| Data | Type | Resolution | Duration | Source |
|---|---|---|---|---|
| Annual precipitation data |
Vector and raster | 30 m | 2001 | Republic Hydrometeorological Service of Serbia (RHSS) |
| RCP 4.5 and 8.5 scenarios |
raster | 0.11 deg | 2016-2035, 2046-2065, 2081-2100 | ⇒ https://www.euro-cordex.net/index.php.en |
| Digital elevation model | raster | 25 m | 2015 | EU-DEM ⇒ https://www.euro-cordex.net/index.php.en |
| Land Cover map | raster | 30 m | 10/08/2019 | Landsat 8 OLI/TIRS LC81860292019222LGN00 ⇒ https://www.euro-cordex.net/index.php.en |
| Soil map | Vector | Scale 1:20.000 | 1978 | Institute of Soil Science |
| Soil fraction | Vector and raster | 30 m | 2011, 2012, 2013, 2014, 2019 | University of Belgrade - Faculty of Forestry |
For the reference period (2019), empirically measured climate data from meteorological stations were used for the observation period from 2001 to 2019. This period was selected because the study area includes the Belgrade Urban Development Master Plan, which was in force from 2001 to 2021. As the plan is based on projections for two decades, choosing a period that covers part of the planned time frame ensures the relevance of climate data for the analysis and aligns with the urban and applicable spatial plans during this period. Future time periods represent simulated changes in climate parameters based on climate models from the EURO-CORDEX database under defined reference and future time frames and greenhouse gas emission scenarios ([62], [15]). Climate parameter simulations are based on the EURO-CORDEX database, analyzed under the RCP4.5 and RCP8.5 scenarios for the periods 2016-2035, 2046-2065, and 2081-2100. The spatial distribution of climatic characteristics in the study area for the reference year and future periods was determined using the IDW (Inverse Distance Weighted) interpolation method ([28]). Soil erosion resistance is related to soil properties such as organic matter content, textural composition, structure, and hydraulic conductivity. For the purposes of this study, a digitized soil map was used, while relevant data on soil properties were obtained from literature ([46], [2], [3]) and soil sample analyses used in projects of the University of Belgrade, Faculty of Forestry. A digital terrain model from the pan-European EU-DEM database with a resolution of 25 m was used for the relief analysis and terrain slope modeling. Because Landsat 8 OLI/TIRS satellite images have a spatial resolution of 30 m, the EU-DEM was resampled to 30 m using the bilinear resampling technique in a GIS environment to ensure spatial consistency across all input layers. Land cover classification was performed using Landsat 8 OLI/TIRS imagery in combination with the Random Forest algorithm ([5]) and a set of spectral indices: the Normalized Difference Vegetation Index (NDVI - [12]), the Enhanced Vegetation Index (EVI - [14]), and the Modified Normalized Difference Water Index (MNDWI - [65]) were used for the land cover class inventory. Database compilation, creation, and processing, as well as spatial geostatistical analyses, were performed using ArcGIS Desktop v. 10.8.1 ([32]) and QGIS Desktop v. 2.18.10 ([51]).
Random forest method for land cover classification
For land cover classification, the Random Forest algorithm was applied, which demonstrated efficiency and robustness when working with multispectral data. The classification accuracy was validated using a confusion matrix and the Kappa coefficient, ensuring the reliability of the input layers used in the RUSLE model. The algorithm was not employed to directly quantify erosion processes, but solely as an auxiliary tool for generating thematic land cover maps. Random forest (RF), a widely used ensemble machine learning method, can address both regression and classification problems ([5]). The core concept of this approach is to combine multiple weak classifiers to produce a single, more powerful classifier. In the RF model, the fundamental unit of the ensemble is a decision tree. The method relies on a bagging technique using uniform sampling with replacement, also known as bootstrap sampling. Each tree within the forest is created using a bootstrap sample of the input data, while the remaining data are used for performance evaluation. Once the decision tree forest is developed, the final prediction is derived by aggregating the outputs of all trees. For regression tasks, this means the predictions are averaged, whereas for classification tasks, the majority class is selected ([5]). In this study, the RF classification algorithm implemented in the Sentinel Application Platform (SNAP) was used ([60]). Spectral indices derived from available satellite imagery were incorporated to improve land cover map quality ([1]), as such indices are particularly well-suited for land cover mapping. Specifically, NDVI and EVI were used from the set of vegetation indices, while MNDWI was used to distinguish water bodies from terrestrial land cover classes. A confusion matrix was used to evaluate the accuracy of land-cover classification using the Random Forest (RF) method. This matrix serves as the basis for calculating various accuracy measures, including Overall Accuracy (OA), User Accuracy (UA), Producer Accuracy (PA), and Kappa statistics ([31], [39]). Accuracy assessment was performed at the pixel level using the R programming language ([52]).
Soil erosion assessment with the RUSLE model
In addition to the RUSLE model, various other approaches for erosion assessment are mentioned in the literature, including USPED, WEPP, MMF, EPM (Erosion Potential Method), G2 (Geoland 2), and the InVEST model. The selection of RUSLE for this study was based on its methodological simplicity, broad applicability, compatibility with GIS environments, and the availability of input data for all required factors (R, K, LS, C, and P). An additional advantage of this model is its compatibility with European Union spatial databases ([40], [41], [42]), enabling comparability of results with other regional analyses. Soil erosion for the baseline period was estimated using the RUSLE model, based on historical climate data for 2001-2019 and the 2019 reference land cover map, which was derived from a Landsat 8 OLI/TIRS satellite image using the RF method. The calculation of soil losses was carried out in the GIS environment, with the output as a raster at a spatial resolution of 30 meters. To effectively simulate and predict the future impact of climate change on soil erosion, the average annual precipitation under scenarios RCP4.5 and RCP8.5 for the near future (2016-2035), the middle of the century (2046-2065) and the end of the century (2081-2100) was used as a climate variable. Projected results were then compared against the reference period. The RUSLE model can calculate the mean annual soil loss per unit area as the product of five erosion factors according to the following formula (eqn. 1):
where A is the average annual soil loss (t ha-1 y-1), R is the rainfall erosivity factor (MJ mm ha-1 h-1 y-1), K is the soil erodibility factor (t ha h ha-1 MJ-1 mm-1), LS is the slope length and steepness factor (dimensionless), C is the cover management factor (dimensionless), and P is the conservation support practices factor (dimensionless).
The rainfall erosivity factor (R) represents the erosivity of rainfall, i.e., the interdependence between precipitation and the production of erosion material ([64], [53], [37]). Due to the absence of 30-minute precipitation values, average annual precipitation data were used as follows ([61], [23] - eqn. 2):
where R is the rainfall erosivity (MJ mm ha-1 h-1 y-1), b0 is an empirical coefficient (MJ h-1 month-1), and Pm is the average monthly precipitation (mm month-1). The empirical coefficient ranges from 1.1 to 1.5 ([61]), and a value of 1.1 was chosen for this study. This value was successfully applied in the territory of the Republic of Serbia ([47]).
The resistance of soil to the action of erosion agents is expressed by the erodibility factor (K - [64], [37]). Since factor K is an integrated parameter based on the use of several specific soil properties, the equation of Wischmeier & Smith ([64]) was used (eqn. 3):
where K is the soil erodibility (t ha h ha-1 MJ-1 mm-1); M is a textural factor, defined as the percentage of silt and fine sand content (0.002-0.1 mm) multiplied by the factor: 100 - clay fraction; OM is the organic matter content in percent (%); s is the soil structure class (1: very fine granular, 2: fine granular, 3: medium or coarse granular, 4: blocky, platy or massive); and p is the permeability class (1: very rapid, 2: moderately rapid, 3: moderate, 4: moderately low, 5: slow, 6: very slow). Finally, 0.1317 is a conversion coefficient to SI units.
The slope length and steepness factor (LS) quantifies the influence of these variables on water erosion. The original formula for calculating the LS factor has limitations, as it assumes a standard plot (22.1 m in length, 9% slope - [64]). RUSLE overcomes these limitations by enabling LS calculations for slopes of varying lengths and steepnesses ([53]). In this study, the formula of Desmet & Govers ([13]) was used, which also applies to the European Union ([40] - eqn. 4):
where Ai,j is the contributing area at the inlet of the grid cell i,j measured in m2; D is the grid cell size (in m); xi,j is the the aspect direction of the grid cell; m is the exponent related to the ratio β between rill and interrill erosion (ranging from 0 to 1, approaching zero when the ratio is near zero).
The slope factor S is calculated using the following formula ([35] - eqn. 5):
The cover management factor (C) describes how soil erosion is impacted by the vegetation cover and cultivation conditions ([53]). For the purpose of this study, the C-factor values were derived from an analysis of the classified land cover using the Random Forest machine learning method. Satellite imagery obtained from Landsat missions was used. The C-factor values were assigned as attributes of the classified land-cover vector database, following the methods used in European Union Member States ([41]).
The conservation support practices factor (P) represents the ratio of soil loss under a specific conservation practice to soil loss on slopes tilled in the up-and-down slope direction ([53]). In this study, the P factor was set to 1 across all areas, reflecting the absence of documented conservation measures.
Results and discussion
Land cover classification and accuracy assessment
The land cover map for the reference year (2019) distinguishes six classes of land cover: water bodies, artificial surfaces, forests, shrubs, grasslands, and agricultural areas. All available Landsat spectral bands were used for the classification model. The usefulness of spectral indices in land cover classification has been demonstrated in several studies ([1]); therefore, an additional set of indices (NDVI, EVI, and MNDWI) was included in the classification. After completing the land cover classification procedure and producing a thematic map, an accuracy assessment was conducted to evaluate the quality of the classification using remote sensing. The validation process consisted of comparing reference samples used for training against those used for accuracy assessment. The reference samples for training and accuracy assessment were collected visually and via vectorization for each land-cover category. A total of 288 training polygons and 72 classification accuracy assessment polygons were used for classification. The accuracy of the classified land cover is shown in Tab. 2. According to the confusion matrix, user’s accuracy was lowest for the grassland category (71.26%) and highest for water bodies (99.82%). The producers’ accuracy across categories ranges from 66.67% (artificial surfaces) to 100% (water bodies). Overall accuracy across all categories was 96.91%, and the Kappa statistic was 0.95, indicating near-perfect agreement between classified data and reference samples ([31]). The spatial distribution of land cover types is shown in Fig. S2a (Supplementary material), and their areas in km2 are shown in Tab. 3.
Tab. 2 - A pixel-based evaluation of land cover classification accuracy. Legend for Class ID: 1- Water bodies, 2- Artificial surfaces, 3- Forests, 4- Shrubs, 5- Grasslands, 6-Agricultural areas. (K): Kappa statistics.
| Reference | |||||||||
|---|---|---|---|---|---|---|---|---|---|
| Prediction | Class ID | 1 | 2 | 3 | 4 | 5 | 6 | Total | UA (%) |
| 1 | 1,087 | 2 | 0 | 0 | 0 | 0 | 1,089 | 99.82 | |
| 2 | 0 | 76 | 0 | 10 | 0 | 0 | 86 | 88.37 | |
| 3 | 0 | 0 | 4,646 | 40 | 5 | 10 | 4,701 | 98.83 | |
| 4 | 0 | 14 | 99 | 1,040 | 0 | 0 | 1,153 | 90.20 | |
| 5 | 0 | 10 | 19 | 109 | 915 | 231 | 1,284 | 71.26 | |
| 6 | 0 | 12 | 2 | 12 | 21 | 10,935 | 10,982 | 99.57 | |
| - | Total | 1,087 | 114 | 4,766 | 1.211 | 941 | 11,176 | 19,295 | OA=96.91% |
| PA (%) | 100 | 66.67 | 97.48 | 85.88 | 97.24 | 97.84 | - | K=0.95 | |
Tab. 3 - Areas occupied by different land cover types in 2019.
| Land cover | km2 | % |
|---|---|---|
| Water bodies | 38.69 | 4.97 |
| Artificial surfaces | 234.88 | 30.17 |
| Forests | 75.35 | 9.68 |
| Shrubs | 111.07 | 14.27 |
| Grasslands | 67.14 | 8.62 |
| Agricultural areas | 251.42 | 32.29 |
| Total | 778.54 | 100.00 |
RUSLE model results
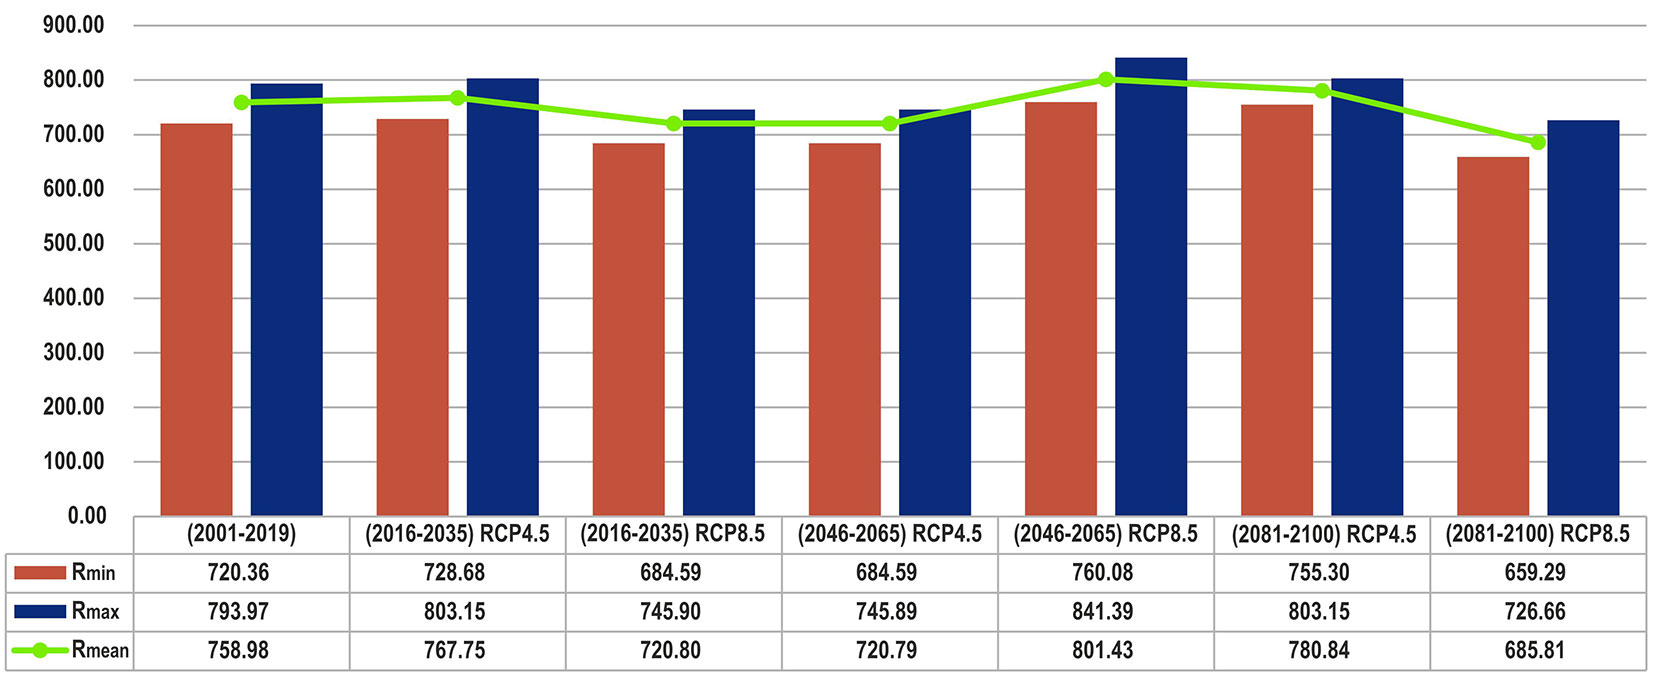
The R factor is a key parameter in estimating the erosion power of rainfall, quantifying the kinetic energy of precipitation and its potential to detach and transport soil. Due to the lack of data on 30-minute rainfall intensity values, an algorithm developed by Van Der Knijff et al. ([61]) and Grimm et al. ([23]) was used to calculate the R factor. This method is frequently used in scientific research to calculate the R factor ([33]) and has been applied several times in studies related to Serbia ([47]). In this study, the minimum (Rmin), mean (Rmean) and maximum (Rmax) values of the R factor were analyzed for the reference year (2019) and three future periods (2016-2035, 2046-2065, 2081-2100) under climate scenarios RCP4.5 and RCP8.5 (Fig. 2). For the reference year (2019), the R factor values are: Rmin= 720.36 MJ mm ha-1 h-1 y-1, Rmean = 758.98 MJ mm ha-1 h-1 y-1, Rmax= 793.97 MJ mm ha-1 h-1 y-1. These values serve as a basis for comparison with simulated future periods. For the period (2016-2035), under the RCP4.5 scenario, the R factor values were higher than in the reference year (Rmin = +1.15%, Rmean = +1.16%, Rmax = +1.16%). Under RCP8.5 for the same period, values were lower (Rmin = -4.96%, Rmean = -5.03%, Rmax = -6.05%). In the period (2046-2065), the values under the RCP4.5 scenario are identical to the values for the period (2016-2035) under the RCP8.5 scenario. The R factor analysis under the RCP8.5 scenario for the period (2046-2065) revealed significantly higher values (Rmin = +5.51%, Rmean = +5.59%, Rmax = +5.97%). For the future period (2081-2100), the values are slightly higher under the RCP4.5 scenario (Rmin = +4.85%, Rmean = +2.88%, Rmax = +1.16%). Under the RCP8.5 scenario for the period (2081-2100), the values are lower compared to the reference period (Rmin = -8.48%, Rmean = -9.64%, Rmax = -8.47%). The spatial distribution of the R-factor for the reference year and the future periods is shown in Fig. S1 (Supplementary material).
Fig. 2 - Minimum, maximum, and mean R factor values for the reference year and future periods under the RCP4.5 and RCP8.5 scenarios.
The mean value of the K factor across the study area was 0.041 t ha h ha-1 MJ-1 mm-1, and thus the investigated soil belongs to the group of highly erodible soils ([64]). The range of K values extends from 0.033 to 0.07 t ha h ha-1 MJ-1 mm-1 for the study area, excluding water bodies, lakes, and urban areas (see Fig. S2a in Supplementary material). The LS factor is a combined factor that reflects the simultaneous influence of slope steepness and length on the occurrence of erosion processes. Values of the topographic factor ranged from 0.03 to 40.25, with a mean of 0.98, and are consistent with the values determined by Panagos et al. ([40]) for individual countries in the European Union (Fig. S2c, Supplementary material). Higher values of the topographic factor LS indicate a greater potential for the initiation and development of erosion processes on the surface ([40]). The values of factor C are presented as attributes on the corresponding land cover map, which was generated from remote sensing data using a supervised classification method. The values of factor C range from 0 to 0.25 with an average value of 0.096 (see Fig. S2d in Supplementary material). These values reflect different types of land use and vegetation cover in the observed area, which is consistent with the results presented at the EU level ([41]). The raster databases for K, LS, and C factors were applied uniformly across the reference year and all future periods under both scenarios. Based on the defined input parameters (R, K, LS, and C), annual soil loss was calculated using the RUSLE model for all time periods. Analysis was restricted to areas subject to active erosion processes (agricultural areas, forests, grasslands, shrublands, and semi-natural areas), while urbanized areas with a high proportion of impervious surfaces, rivers, lakes, and wetlands were excluded, as it is standard practice in European soil loss assessments using the RUSLE2015 model ([43]). The total area subject to erosion analysis was 481.39 km2, equivalent to 61.83% of the total MPB area. To facilitate interpretation, results were supplemented with quantitative descriptions of the figures and tables, with particular attention to comparisons between the two climate scenarios and trends relative to the reference period.
The mean annual soil loss for the reference year (2019) was A = 4.15 t ha-1 y-1, indicating very low erosion intensity. The spatial distribution of soil losses across the MPB area ranged from 0.007 to 295.31 t ha-1 y-1 (Fig. S3a, Supplementary material).
Based on the RCP4.5 and RCP8.5 scenarios, soil losses were estimated for three future periods using the 2019 land cover. This approach enables assessment of the impact of climate change on soil erosion, assuming no significant change in land cover. Fig. S3b-g (Supplementary material) show the predicted soil erosion rates for both scenarios (RCP4.5 and RCP8.5) and three time periods (2016-2035, 2046-2065, 2081-2100) using the RUSLE model. For the period 2016-2035, an increase in the production of erosion material - ranging from 0.0076 to 298.7 t ha-1 y-1, with an average of 4.2 t ha-1 y-1 - is projected under the RCP4.5 scenario. Under RCP8.5, a reduction in erosion rate is projected for the same period, with a range of 0.007 to 272.12 t ha-1 y-1 and an average of 3.89 t ha-1 y-1. For the period 2046-2065, the range of values under the RCP4.5 scenario is identical to that for the period 2016-2035 (0.007 to 272.12 t ha-1 y-1), with an average value of 3.89 t ha-1 y-1. Under the RCP8.5 scenario, however, a significant increase in the erosion rate is predicted, ranging from 0.0079 to 311.06 t ha-1 y-1 and an average value of 4.39 t ha-1 y-1. For the period 2081-2100, the estimated erosion rates under the RCP4.5 scenario range from 0.0077 to 299.65 t ha-1 y-1, with an average value of 4.25 t ha-1 y-1. Under the RCP8.5 scenario, a reduction in the erosion rate is expected for the same period, ranging from 0.0067 to 260.70 t ha-1 y-1 and averaging 3.71 t ha-1 y-1.
The analysis revealed changes in the minimum, maximum, and average soil erosion values compared to the reference year 2019 (Tab. 4). Under the RCP4.5 scenario, a gradual increase in erosion values is evident across all time periods. The highest value was recorded in the first projected interval (2016-2035), after which values stabilized and remained at a similar level over the following decades. The minimum values in this scenario also show a slight upward trend, indicating a relatively stable increase in erosion under moderate climate change. The RCP8.5 scenario, on the other hand, is characterized by more dynamic values. In the initial period (2016-2035), all indicators declined, with the lowest minimum erosion recorded during this interval. In the following period (2046-2065), however, there is a sharp increase in all categories - the minimum, maximum, and average values. In the last observed interval (2081-2100), the most significant decrease in erosion-related soil losses was recorded across the entire studied area, with the maximum loss value being the lowest among all periods. These developments reflect a complex interplay between climate factors and erosion processes, particularly under the RCP8.5 scenario, which exhibits the greatest fluctuations. The different trends under the two scenarios highlight the need for more detailed monitoring and modeling of erosion risks associated with future climate change.
Tab. 4 - The minimum, maximum, and average values of expected soil losses.
| Value | A (2019) (t ha-1 y-1) |
ΔA % (2016-2035) |
ΔA % (2046-2065) |
ΔA % (2081-2100) |
|||
|---|---|---|---|---|---|---|---|
| RCP4.5 | RCP8.5 | RCP4.5 | RCP8.5 | RCP4.5 | RCP8.5 | ||
| Amin | 0.00753 | 1.06 | -7.04 | -6.64 | 4.91 | 2.26 | -10.49 |
| Amax | 295.31 | 1.16 | -7.85 | -7.85 | 5.33 | 1.47 | -11.72 |
| Amean | 4.15 | 1.16 | -6.25 | -6.25 | 5.64 | 2.26 | -10.71 |
The analysis of the spatial distribution of erosion degradation categories in the study area reveals the presence of all classes in all three future periods, indicating that the system is persistently exposed to varying levels of soil degradation (Fig. 3). Based on the results in Tab. 5, it is also possible to obtain an overview of changes in areas belonging to individual categories, providing deeper insight into the dynamics of erosion processes in the context of climate change. The spatial structure of erosion is largely governed by morphometric characteristics, particularly slope gradient and land management type. Under RCP4.5 in the near future (2016-2035), areas with very low erosion decrease while more intense erosion categories expand, indicating a deterioration of conditions under moderate climate change. In contrast, the RCP8.5 scenario showed a more favorable picture in the same period, with a pronounced presence of the weakest erosion categories, which may be related to the modeled climatic conditions in this period. In the coming decades (2046-2065), the dynamics change: while a stable pattern is maintained under the RCP4.5 scenario, there is a clear shift towards increased severe and excessive erosion under the RCP8.5 scenario. The excessive erosion reaches its greatest spatial extent during this period, suggesting a possible synergy between intense precipitation and the terrain’s unfavorable morphology. In the 2081-2100 period, under the RCP4.5 scenario, gradual degradation continues, with a slight decrease in areas with very weak erosion and an increase in other categories. At the same time, the RCP8.5 scenario shows a return to the dominance of very weak erosion, which could be due to long-term changes in climate patterns. The contrasting trends between the two scenarios underscore the complex and sometimes counterintuitive nature of climate change’s impacts on erosion. While one scenario may lead to a short-term improvement, the long-term consequences may be significantly more negative. These results underscore the importance of tailored land management measures and the need for an integrated approach that incorporates climate projections into erosion-control planning.
Fig. 3 - Soil erosion categories based on the reference period (2019) and the three future periods under the scenarios RCP4.5 and RCP8.5.
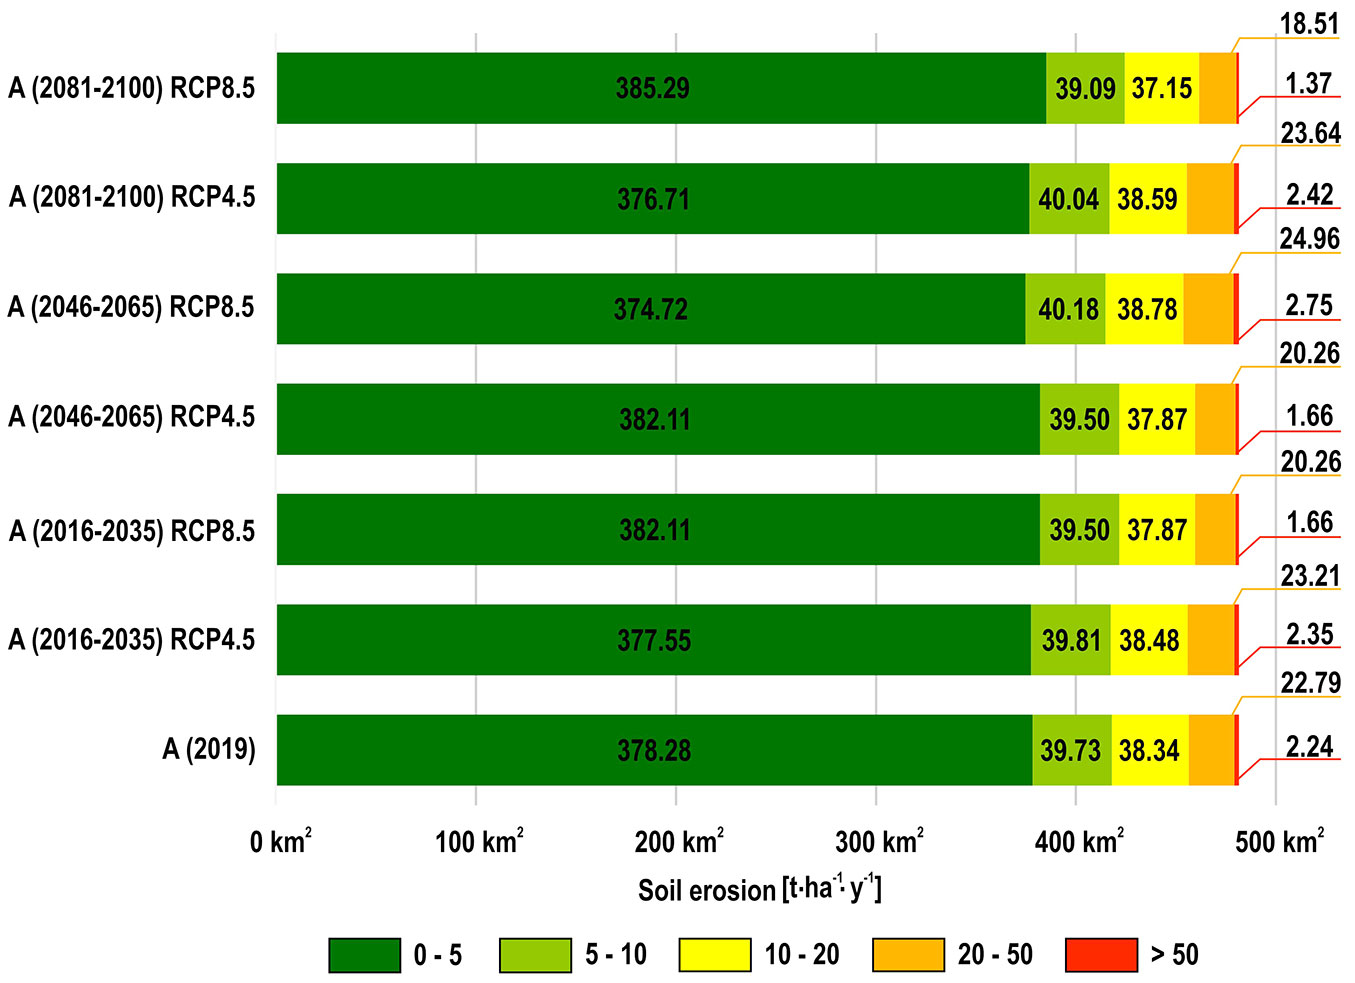
Tab. 5 - The changes in percentage shares of soil erosion categories based on the reference period (2019) and the three future periods under the scenarios RCP4.5 and RCP8.5.
| Erosion type | A (2019) | ΔA % (2016-2035) |
ΔA % (2046-2065) |
ΔA % (2081-2100) |
||||
|---|---|---|---|---|---|---|---|---|
| Area (km2) | % | RCP4.5 | RCP8.5 | RCP4.5 | RCP8.5 | RCP4.5 | RCP8.5 | |
| Very weak (0-5) | 378.28 | 78.58 | -0.20 | 1.01 | 1.01 | -0.94 | -0.42 | 1.85 |
| Weak (5-10) | 39.73 | 8.25 | 0.18 | -0.59 | -0.59 | 1.13 | 0.76 | -1.63 |
| Medium (10-20) | 38.34 | 7.96 | 0.37 | -1.23 | -1.23 | 1.15 | 0.65 | -3.11 |
| Severe (20-50) | 22.79 | 4.73 | 1.84 | -11.11 | -11.11 | 9.49 | 3.73 | -18.80 |
| Excessive >50 | 2.24 | 0.47 | 4.70 | -26.16 | -26.16 | 22.47 | 7.74 | -39.13 |
Spatial analysis of erosion processes was further used to examine soil losses across different land cover types. As soil erosion rates for near- and further-future periods were calculated using the 2019 land cover map, assuming no land-cover change, the observed variation in erosion rates reflects the isolated effect of climate change. Based on 2019 results, an estimate of soil erosion rates by land cover type is presented for all three future periods under the climate scenarios RCP4.5 and RCP8.5 (Fig. 4). The results indicate that soil losses vary substantially across land cover categories, time periods, and climate scenarios.
Fig. 4 - Average soil erosion losses by land cover types.
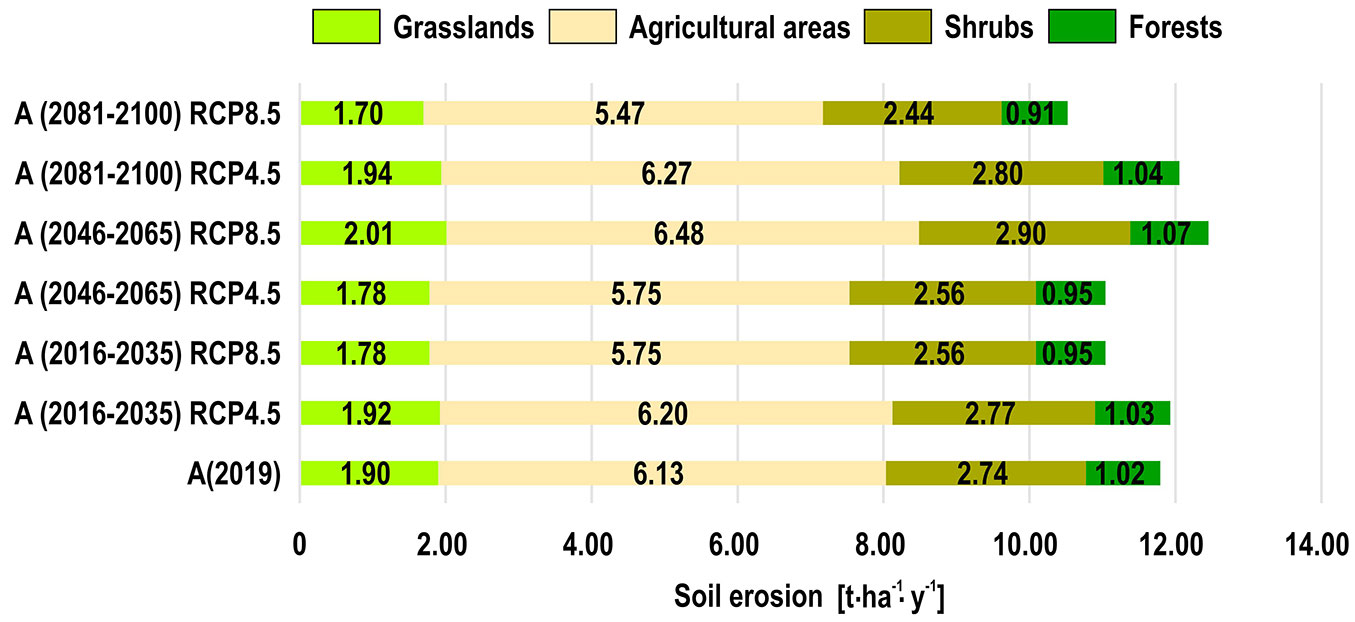
A comparison of the two scenarios shows that the RCP4.5 scenario predicts increased soil loss in the first (2016-2035) and third (2081-2100) periods. In contrast, the second RCP8.5 scenario predicts a significant increase in soil loss in the second (2046-2065) period, while there is a significant decrease in the first (2016-2035) and in the third (2081-2100) periods. Agricultural surfaces are the most susceptible to erosion and exhibit the highest soil losses across all analyzed time periods and scenarios ([38]). This indicates the need to adopt sustainable agricultural practices, such as contouring, terracing, and agroforestry, to reduce soil erosion ([54]). Meadows and shrublands exhibit moderate soil loss, reflecting their intermediate resilience to erosion processes. Although meadows are less susceptible to erosion than agricultural surfaces, they require careful management to maintain their structure and function ([9], [18]). Shrubs offer additional protection against erosion through their dense vegetation but remain susceptible to erosion during extreme rainfall or under improper management ([8]). Forests are characterized by the lowest soil loss, which confirms their key role in reducing erosion. Forest vegetation reduces the speed of surface runoff, increases water infiltration, and stabilizes the soil. These effects are particularly important in hilly and mountainous areas where the risk of soil erosion is the highest. Forests also provide additional environmental benefits, such as biodiversity conservation and microclimate regulation. Similarly, studies in the Mediterranean region have shown that meadows and shrubs have a greater protective effect against soil erosion than agricultural areas, while forests are most effective at reducing erosion losses ([8], [6]). These results confirm the importance of preserving forest ecosystems and implementing appropriate soil protection measures on agricultural land and across other land-cover categories. Gianinetto et al. ([22]) concluded that without appropriate land management and land-use policies, climate change will lead to increased soil loss by 2050, followed by a partial decrease from 2050 to 2100. In addition, these authors noted that changes in soil management, such as abandoning tillage or converting land use from cropland to pasture or forest, can reduce soil erosion by more than 90%, an effect far greater than that of climate change alone ([22]). This means that changes in land cover, land use, and land management practices are likely to have a greater impact on soil erosion than precipitation patterns ([55]).
In this study, model validation was carried out through a combination of qualitative and comparative procedures. Given the lack of systematic erosion measurements in the urban area of Belgrade, a qualitative validation approach was applied based on a spatial comparison of the identified erosion zones with known locations of torrential streams, flood-prone areas, and recorded erosion rills. This enabled to assess of the spatial accuracy of model predictions. Additionally, the results were compared with reference values and spatial patterns reported in regional studies conducted in Southeastern Europe ([42], [47]), thereby confirming the consistency of both the model estimates and the spatial distribution of erosion classes. Based on the assessment of soil loss using the G2 (Geoland 2) erosion model in the MPB area, the results agreed with those of the RUSLE model, with average loss values ranging from 4.11 t ha-1 y-1 in 2001 to 3.63 t ha-1 y-1 in 2019 ([48]). Although empirical verification from field sedimentation measurements is currently unavailable, quantitative validation is planned at selected pilot locations in subsequent phases of the research. This would enable a comparison between model estimates and actual data on erosion material production, further confirming the robustness and applicability of the RUSLE model in urban environments. The uncertainties in the model outputs primarily relate to the variability of the R (rainfall erosivity) and C (vegetation cover) factors. Future research will include a sensitivity analysis by varying these factors within realistic bounds in order to assess the stability of the model projections. Such an approach facilitates reliability assessment and enables a more realistic interpretation of long-term erosion risk scenarios. Although this study is primarily focused on the quantitative assessment of erosion risks, future analyses will also incorporate qualitative elements, including examinations of planning documents and consultations with relevant urban planning institutions. In this way, the modeling results will be complemented with local insights, enhancing their relevance for planning and policy practice.
To date, most studies on erosion processes and sediment production have focused on rural areas ([29], [20], [45]), while research on urban conditions remains comparatively limited. This gap has led to the lack of integrated databases and inadequate identification of critical source areas in urban settings. Key challenges in this field include the poorly-developed methodological frameworks for modeling urban soil erosion and the limited use of appropriate erosion models. Addressing these gaps will enable the spatial and quantitative simulation of different scenarios under both current and projected climatic conditions. The results indicate significant differences in the spatial distribution of erosion risk across climate scenarios and temporal horizons. These changes have direct implications for urban planning, particularly regarding the management of green and infrastructural areas. The identified zones of increased erosion activity spatially overlap with planned infrastructural corridors and peripheral urban areas within the General Urban Plan of Belgrade, highlighting the need to strengthen land protection measures. The implementation of green infrastructure solutions (e.g., vegetation belts, green roofs, infiltration surfaces) could substantially reduce surface runoff and mitigate erosion. The assumption of unchanged land cover was introduced to isolate the effects of climate change from the influence of urbanization. However, future research should incorporate dynamic land-use projections to enable a more accurate assessment of the interaction between urban development and erosion processes. To verify the model results, a spatial comparison of erosion zones was conducted with known locations of torrential streams, flood-prone areas, and recorded erosion rills within the urban landscape of Belgrade. The observed overlap indicates the realistic spatial accuracy of the model, confirming its applicability even under complex urban conditions. Nevertheless, the limited availability of empirical data on erosion processes poses a challenge to comprehensive validation, and future research will therefore focus on collecting and analyzing field data on sedimentation and erosion events.
Advantages and limitations
Although the RUSLE model was originally developed for erosion assessment in agricultural landscapes, its application in urban systems enables the identification of areas with potential erosion risk. In urban environments, erosion processes are influenced by a complex interplay of natural and anthropogenic factors, including terrain slope, soil type, vegetation cover, and the extent of impervious surfaces. In this study, the model was applied exclusively to permeable zones (e.g., forested, grassland, agricultural, and partially developed areas), which mitigates the limitations associated with applying RUSLE to fully urbanized surfaces. This approach aligns with recommendations from recent studies that confirm the validity of the RUSLE model under urban conditions ([43], [33], [6]). Although sensitivity analysis was not part of the initial research design, the importance of evaluating the robustness of model output is fully acknowledged. The main uncertainties arise from the variability of the R (rainfall erosivity) and C (vegetation cover) factors. Future research will therefore include a basic sensitivity analysis by varying these key factors within ±10% to quantify potential deviations in model projections. Such an approach would allow for a more accurate interpretation of the model’s reliability and support its practical application in land protection planning.
One of the key limitations of the study concerns the assumption of unchanged land cover until the end of the 21st century. This methodological simplification was employed to isolate the effects of climate change and to analyze variation in erosion processes solely as a function of changes in the rainfall regime. Although it is well known that the structure of land cover in urban areas changes with the expansion of built-up zones, this approach enables clearer differentiation of the climatic component from the influence of urbanization. Future studies should incorporate dynamic land-cover change models (e.g., MOLUSCE, InVEST) to further enhance the predictive accuracy of erosion-risk scenarios. Validation of RUSLE model results in urban areas presents a methodological challenge, primarily due to the limited availability of field data on erosion processes. In this study, indirect validation was conducted by comparing K and LS factor values with those from reference European studies ([44], [40]), thereby confirming the consistency of the model results in both spatial distribution and erosion intensity. In the next phase, empirical verification is planned through analysis of field data and historical reports on torrential events and floods in the urban area of Belgrade, which will further confirm the reliability of the model estimates.
Conclusions
Soil erosion is one of the major threats to soil and water resources, with anthropogenic activities and climate change among its primary drivers. Although erosion processes have traditionally been considered a problem in rural and agricultural areas, the results of this study confirm that urbanization significantly increases erosion intensity, especially amid increasing impervious surfaces and inadequate land management.
Our results indicate that erosion intensity will vary across climate change scenarios, with significant increases in soil loss projected during certain periods, especially in areas with steep slopes and degraded vegetation cover. The comparison of data under greenhouse gas emission scenarios (RCP4.5 and RCP8.5) shows that different climate change trajectories will produce different effects on erosion processes, with higher-emission scenarios predicting more intense changes during certain time periods.
The results of this study emphasize the need to implement sustainable land management strategies, including maintaining vegetation cover, applying erosion control measures, and adapting urban policies to reduce future negative impacts of erosion. This points to the need for an integrated approach to urban planning and management that simultaneously contributes to the conservation of natural resources and to sustainable land use.
Although this research is primarily grounded in quantitative modeling of erosion processes, future analyses could be substantially enhanced by integrating qualitative and participatory elements, particularly through collaboration with urban planning institutions, local authorities, and professional services, to translate modeling results into practical spatial planning tools.
The findings of this research have direct applicability within existing urban planning instruments, notably the Master Plan of Belgrade (MPB 2041) and the Climate Change Adaptation Strategy of the Republic of Serbia. The identified erosion-prone zones can serve as a basis for defining areas with construction restrictions, planning green corridors, and implementing natural retention surfaces. In this regard, the RUSLE model, combined with climate scenarios, can serve as an effective tool for enhancing sustainable land management in urban environments.
Acknowledgments
This study was funded by the Ministry of Science, Technological Development and Innovation of the Republic of Serbia, agreement no. 451-03-137/2025-03/200169.
References
Gscholar
Gscholar
CrossRef | Gscholar
CrossRef | Gscholar
Gscholar
Gscholar
Gscholar
Gscholar
Gscholar
Gscholar
Gscholar

Authors’ Info
Authors’ Affiliation
Nikola Zivanović 0000-0003-0340-5516
Katarina Lazarević 0000-0002-6540-8133
Ratko Ristić 0000-0001-6817-2800
Mirjana Todosijević 0000-0001-7099-7254
Tijana Vulević 0000-0003-2417-653x
University of Belgrade, Faculty of Forestry, Department of Ecological Engineering in Soil and Water Resources Protection, Belgrade (Serbia)
University of Belgrade, Faculty of Forestry, Department of Landscape Architecture and Horticulture, Belgrade (Serbia)
Corresponding author
Paper Info
Citation
Polovina S, Radić B, Zivanović N, Lazarević K, Ristić R, Todosijević M, Vulević T (2026). Urban land degradation risks under climate change: a RUSLE-based approach. iForest 19: 244-253. - doi: 10.3832/ifor4898-019
Academic Editor
Lorenzo Mw Rossi
Paper history
Received: May 12, 2025
Accepted: Apr 28, 2026
First online: Jul 16, 2026
Publication Date: Aug 31, 2026
Publication Time: 2.63 months
Copyright Information
© SISEF - The Italian Society of Silviculture and Forest Ecology 2026
Open Access
This article is distributed under the terms of the Creative Commons Attribution-Non Commercial 4.0 International (https://creativecommons.org/licenses/by-nc/4.0/), which permits unrestricted use, distribution, and reproduction in any medium, provided you give appropriate credit to the original author(s) and the source, provide a link to the Creative Commons license, and indicate if changes were made.

Web Metrics
Breakdown by View Type
Article Usage
Total Article Views: 2036
(from publication date up to now)
Breakdown by View Type
HTML Page Views: 653
Abstract Page Views: 702
PDF Downloads: 582
Citation/Reference Downloads: 1
XML Downloads: 98
Web Metrics
Days since publication: 92
Overall contacts: 2036
Avg. contacts per week: 154.91
Article Citations
Article citations are based on data periodically collected from the Clarivate Web of Science web site
(last update: Jul 2026)
(No citations were found up to date. Please come back later)
Publication Metrics
by Dimensions ©
Articles citing this article
List of the papers citing this article based on CrossRef Cited-by.
Related Contents
iForest Similar Articles
Research Articles
Assessment of land sensitivity to degradation using MEDALUS model - a case study of Grdelica Gorge and Vranjska Valley (southeastern Serbia)
vol. 15, pp. 163-170 (online: 07 May 2022)
Research Articles
The concept of green infrastructure and urban landscape planning: a challenge for urban forestry planning in Belgrade, Serbia
vol. 11, pp. 491-498 (online: 18 July 2018)
Research Articles
Evaluation of urban forest landscape health: a case study of the Nanguo Peach Garden, China
vol. 13, pp. 175-184 (online: 02 May 2020)
Research Articles
The impact of land use on future water balance - A simple approach for analysing climate change effects
vol. 14, pp. 175-185 (online: 13 April 2021)
Review Papers
Green Infrastructure as a tool to support spatial planning in European urban regions
vol. 6, pp. 102-108 (online: 05 March 2013)
Research Articles
Factors of soil CO2 emission in boreal forests: evidence from Central Siberia
vol. 16, pp. 86-94 (online: 19 March 2023)
Research Articles
Slope shape effect on runoff and soil erosion under natural rainfall conditions
vol. 7, pp. 110-114 (online: 18 December 2013)
Review Papers
Soil fungal communities across land use types
vol. 13, pp. 548-558 (online: 23 November 2020)
Research Articles
Effects of tree species, stand age and land-use change on soil carbon and nitrogen stock rates in northwestern Turkey
vol. 9, pp. 165-170 (online: 18 June 2015)
Research Articles
Comparison of soil CO2 emissions between short-rotation coppice poplar stands and arable lands
vol. 11, pp. 199-205 (online: 01 March 2018)
iForest Database Search
Search By Author
Search By Keyword
Google Scholar Search
Citing Articles
Search By Author
Search By Keywords
PubMed Search
Search By Author
Search By Keyword