
Verification technique for a photo-optical volume measuring system for stacks of timber logs
iForest - Biogeosciences and Forestry, Volume 19, Issue 5, Pages 352-358 (2026)
doi: https://doi.org/10.3832/ifor4869-019
Published: Sep 05, 2026 - Copyright © 2026 SISEF
Research Articles
Abstract
Accurate volume measurement of stacked timber logs is essential for the timber industry. Photo-optical Automated Volume Measuring Systems (AVMS) offer efficient alternatives to manual methods but require verification to ensure reliability. This paper presents a simple, reliable, and easily implementable verification method for AVMS, based on measuring the wood stack front surface area. The proposed method utilizes reference models, calibrated using traceable working standards, to simulate timber log stacks with defined contours. This involves comparing the AVM’s measured area to the reference model’s area, enabling the determination of area measurement errors. The study investigates the selection of reference instruments, proposes a comprehensive AVMS verification procedure, and evaluates the method’s metrological characteristics. Laboratory tests involving 110 AVMS units revealed a repeatability of 0.46% and a total uncertainty of approximately 1.1%. The method successfully identified shortcomings in commercially available AVMS, including non-compliance with manufacturer-declared errors and design imperfections related to camera limitations. The developed method can be used in industry, metrological supervision, and scientific research to ensure accurate and reliable measurements of wood stacks and the long-term reliability of AVMS. This study also highlights the need to further improve photo-optical measurement systems to increase their reliability and accuracy.
Keywords
Photo-optical Measuring Systems, Volume, Stacked Timber Logs, Verification, Standards Calibration, Conformity Assessment
Introduction
Accurate measurement of timber stacks is crucial for the timber industry, especially for financial transactions and logistical planning ([17]). Recent advancements in sensor and camera technology have led to the development of photo-optical measurement methods ([2], [14]). Automated measurements significantly reduce the time and effort required ([3]). These systems typically capture images of timber stacks and use image-processing algorithms to determine dimensions, volume, and other relevant parameters ([12]). The software identifies the outer boundary of the timber stack in the image, defining the two-dimensional area of the stack’s front surface. Advanced algorithms can provide more accurate and transparent measurements compared to manual methods, minimizing the risk of mistakes associated with manual calculations ([4], [23]). Detailed records of measurements and corresponding stack images enable the collection of valuable data for forest management and research ([6], [4]). Despite their advantages, photo-optical systems still face certain challenges. For example, accurately measuring complex stack shapes can be challenging for some systems ([19]).
Adverse weather conditions such as rain, snow, or poor lighting can affect image quality and measurement accuracy ([1]). Regular inspection of photo-optical AVMS can help prevent significant measurement errors by enabling timely maintenance or recalibration. Researchers have evaluated the reliability of these new methods ([16]), identified factors contributing to measurement deviations ([12], [20]), and compared systems from various manufacturers ([17]). However, little attention has been given to the verification procedures for such systems. Essential elements include: selecting reference standards and ensuring their traceability; implementing the principle of comparing two measuring instruments and assessing key metrological characteristics; and determining appropriate measurement conditions.
A conformity assessment process represents a commitment to safety, quality, and fair competition, benefiting manufacturers, regulators, and consumers ([13]). It evaluates whether a product meets the requirements of relevant legal acts, standards, and technical specifications ([5]). Conformity assessment is not merely a bureaucratic hurdle, as it offers significant advantages for all parties involved. For manufacturers, it provides a gateway to legal market access ([24]). By demonstrating compliance, manufacturers can avoid fines and legal disputes, and they gain a competitive edge through increased customer confidence ([11]). The assessment process itself can be a valuable tool, helping manufacturers identify and rectify weaknesses in their production processes, which can lead to greater efficiency and cost reduction ([9]). Regulatory bodies also benefit, as conformity assessment helps ensure that only safe and reliable products reach consumers. By identifying non-compliant products, regulators can take action against manufacturers who disregard regulations. Data gathered through conformity assessments inform the development and refinement of future regulations and standards ([7]). Ultimately, conformity assessment provides a vital layer of assurance that the products consumers purchase are safe, function as intended, and meet the advertised quality.
Regular verification (if legally required) or calibration, along with routine maintenance, is necessary to ensure ongoing measurement accuracy and reliability. Conformity assessment procedures are carried out with traceability to national or international measurement standards ([8]). This means that the system’s measurements must be compared to reference values. In practice, the measured dimensions are compared to known reference values to evaluate the system’s accuracy. Conformity assessment procedures for photo-optical systems may use different terminology across national legal frameworks. In some countries, these systems are classified as legal metrology instruments, while in others they are considered under industrial metrology. In this paper, we refer to the conformity assessment procedure for these systems (when treated as objects of legal metrology) as verification, and we establish traceability to standards through calibration. The implementation of these procedures remains essentially similar in all cases ([21]).
The objectives of this work are (i) to assess the key metrological characteristics in the verification of photo-optical measurement systems; (ii) to propose simple, reliable, and implementable solutions for verifying photo-optical systems used to measure the area of wood stacks, and to integrate them into a common geometric dimension traceability framework; this includes developing a verification methodology with a clear sequence of actions, selecting appropriate reference instruments and calibrating a reference “model”, and quantitatively assessing the method’s reliability; (iii) to evaluate a series of measuring instruments, determine the compliance of photo-optical measurement systems with their manufacturer-declared metrological characteristics, and identify shortcomings related to camera limitations and software operation.
Methods
Theoretical study
Photo-optical systems capture multiple images of a timber stack’s front face. Software then stitches these images together to create a complete digital representation of the stack’s face. The software identifies the outer boundary of the woodpile in the image, defining the two-dimensional area of the stack’s face. These systems employ various algorithms to estimate the woodpile’s volume based on the captured area.
Metrological characteristics of a photo-optical system
The key metrological characteristics of these systems are the area measurement error and the measurement range of the timber stack’s front surface area. These parameters are directly related to the measurement process itself. Additional factors pertain to the algorithms used for volume calculation. The calculated total volume accounts for both the solid wood and the air spaces between the logs. A conversion factor k accounts for the difference between the volume of the stacked timber and the solid wood content. The ratio of solid wood to total stack volume can vary between ~50% and ~80%, depending on the type and shape of the wood ([22]).
The combined standard uncertainty of a volume estimation using such a system consists of three components: (i) uncertainty in the front surface area of the logs (the surface perpendicular to the log length); (ii) uncertainty in the length of the stacked logs; and (iii) uncertainty in the conversion factor. The standard uncertainty of the front surface area is equal to u(A) = ± δA/√3, where ± δA is the maximum permissible area error of the system as declared by the manufacturer. Different wood species vary in shape, bark thickness, and straightness, all of which influence stacking characteristics. For instance, crooked logs create more air gaps than straight logs. Methods for determining the conversion factor k include using published data or tables of typical k values for different wood types and conditions ([18]), as well as employing image analysis techniques (in some advanced systems) to estimate the fill factor by analyzing the gaps between logs. The uncertainty associated with the conversion factor k is critical to accurate volume estimation of stacked timber ([19]). The standard uncertainty of k can be derived from its maximum error and can be calculated as u(k) = ± δk/√3. If the error of the conversion factor δk = ± 0.05 and the conversion factor ranges from 0.5 to 0.8, then the standard uncertainty of the conversion factor is equal to 4%-10%, depending on the type and shape of the wood. Typically, the accepted log length in practice is slightly greater than the average log length, with an extra allowance of 5-10 cm added ([18]). In this analysis, we assume there is no uncertainty in the length measurement, taking its uncertainty as zero (u(l) = 0).
The relative error of volume estimation with the photo-optical system is calculated using k=√3 for a rectangular distribution according to (eqn. 1):
Based on the above considerations, the relative volume estimation error for a photo-optical system can range roughly from 3% to 10%, depending on the type and shape of the wood ([10], [12], [19], [23]). If the volume calculation algorithm does not use the conversion factor k, the volume estimation error depends only on the area measurement error.
Main elements of the verification procedure
As mentioned earlier, the final result calculated by photo-optical systems is a volume, obtained as the product of the measured area, the conversion factor, and the log length. For verification purposes, this volume can be effectively equated to the measured area by setting k = 1 and L = 1. These two factors are set to unity because they are not directly measured by the system but rather are predefined (by agreement or by image analysis results). Therefore, verification focuses on measuring the stack’s end-face area as determined by the instrument. This same area is also measured using reference instruments, and the measurement error is calculated and compared to the manufacturer’s permissible error specification.
Reference models with geometric dimensions near the instrument’s specified minimum and maximum measurable areas are tested to cover the full measurement range of the photo-optical system. The system is considered compliant when the area measurement errors at both the minimum and maximum test areas remain within the acceptable error limits. Taking all of this into account, the main elements of the verification procedure are summarized in Tab. 1.
Tab. 1 - Main elements of the verification procedure for log stack photo-optical systems.
| Conformity assessment parameters | Front surface area A of logs |
| Area measurement range | |
| Standards selection | Identifying suitable reference standards |
| Construction of log stack templates/models | |
| Calibration of log template area | |
| Main stages of method implementation | Measurement of the area bounded by the contour of the stack template with a photo-optical system (selected different contour areas are measured at different distances |
| It is assumed that the volume of a stacked log is calculated according to the formula: V = A · k · L, where k and L are 1 during verification | |
| Evaluation of the error of the template/model area and its comparison with the permissible error of AVMS: δA ≤δApermissible |
Key considerations for reference instrument selection
When selecting a reference instrument for verification, several key factors must be considered to ensure accurate and reliable measurements. First, the reference instrument should be traceable to national or international standards and must have a valid calibration certificate from an accredited laboratory. Second, to minimize the impact of the reference instrument’s uncertainty on the overall measurement uncertainty, the reference instrument’s uncertainty should be at least three times smaller than the uncertainty (or maximum error) of the instrument being tested ([15]). Thus, during the selection process, the standard’s calibration uncertainty is directly compared to the photo-optical system’s permissible error.
The reference model’s area is calculated from measured lengths, so directly comparing the uncertainty of a length-measuring standard (e.g., a laser distance meter) to the permissible area error of the AVMS is not straightforward. We therefore relate the reference instrument’s calibration uncertainty to the uncertainties in the measured lengths that define the area. Appendix 1 (Supplementary material) details the theoretical derivation of the calibration criteria for standards, based on the relationship between length measurement uncertainty and the permissible area error for rectangular log stack models. For log stack AVMS, the relative error of the total log pile area δA is typically determined ([6], [19]).
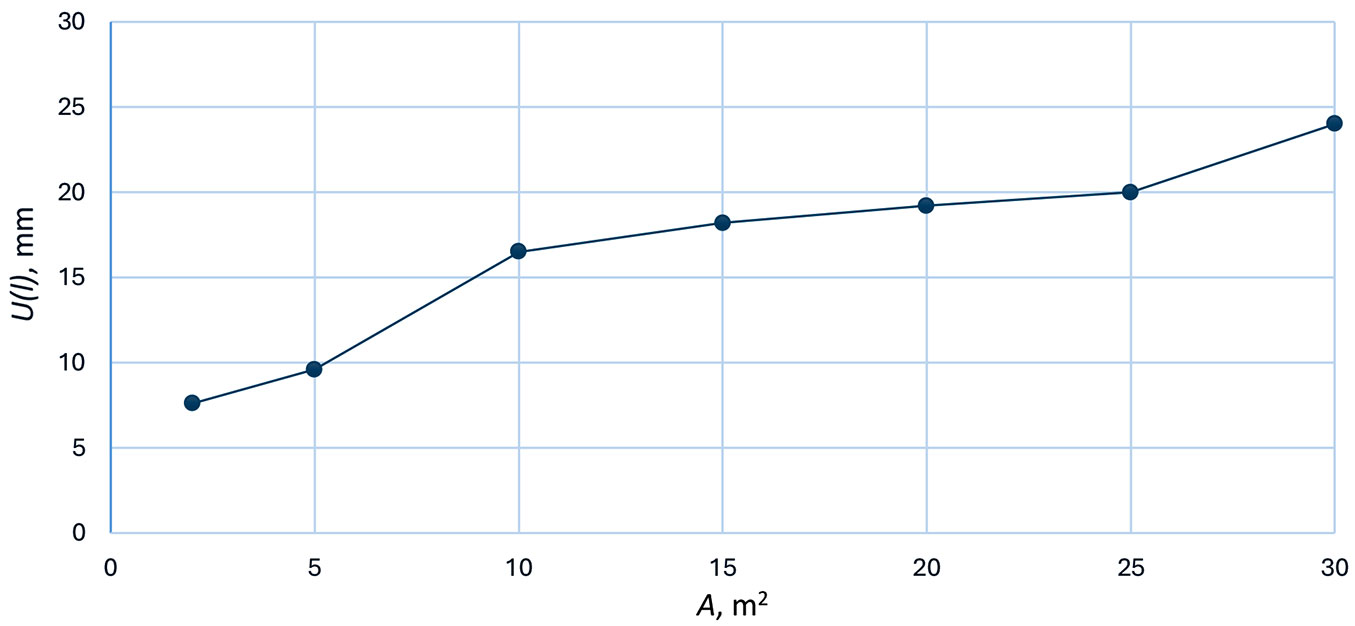
The calibration technique utilizes two primary categories of measuring instruments. A ruler, tape measure, or laser meter is employed to measure the edges of the log stack model. The length of the reference measure LR must be greater than or equal to the largest side of the model contour L. Furthermore, the expanded uncertainty U(LR) of these measuring instruments must be less than or equal to the value determined by the following (eqn. 2):
where δApermissible is the relative permissible error of AVMS, and a and b are the lengths of the sides of the rectangular model (Fig. 1), expressed in meters.
Fig. 1 - Dependence of the expanded uncertainty of length reference standards on the measured area.
Log stack templates, or models, serve as reference standards for verifying the AVMS. The reference area of the model contour Amod ranges from 2 to 20 m2. The expanded uncertainty of the model area U(Amod) must be less than or equal to one-third of the relative permissible error of AVMS: U(Amod) ≤ δApermissible / 3. The uncertainties and errors are given in either absolute or relative terms, aligning with the technical specifications provided by photo-optical system manufacturers. When selecting standards according to the aforementioned criteria, it is crucial to verify that the target error ratio is achieved after calibrating the model’s contour area. This area is calibrated during the AVMS verification process.
Proposed method for photo-optical system verification
This section outlines the process for verifying AVMS used to measure the volume of timber log stacks. The operating principle of an AVMS relies on a combination of image analysis and mathematical calculation. Because the system’s software analyzes an image to determine the area within a defined contour, verification compares the measured area of that contour with a corresponding reference value.
A specially constructed reference model provides the reference value by simulating a timber log stack with a known contour area. The area of this model can be accurately measured using manual length measurement instruments. The model must be calibrated under the same environmental conditions as the AVMS under test.
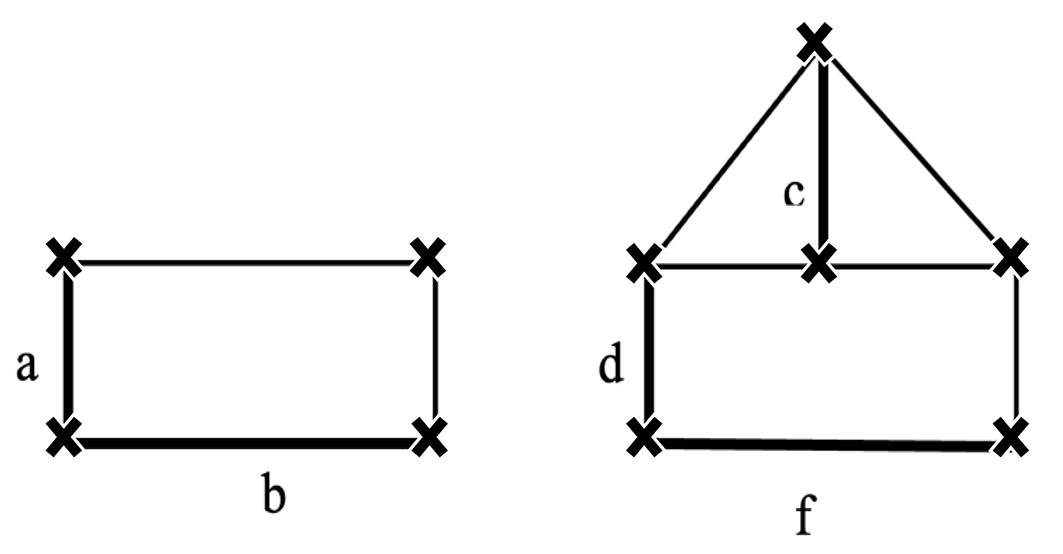
For accurate measurements, the model should be mounted on a flat, vertical plane parallel to the plane of the AVMS’s imaging system. The reference models should represent different points across the device’s measurement range in terms of log stack area. To ensure and assess reproducibility, the model areas are measured at various distances from the device. We propose using two reference models with distinct contour shapes. Their areas should be close to the minimum and maximum area limits that the device under test can measure. For example, as illustrated in Fig. 2, one model could have an area of approximately 4-8 m2 and the other around 10-14 m2, representing different stack shapes at the low and high ends of the instrument’s range.
Fig. 2 - Examples of formed rectangular and polygonal models.
Measurement of the area bounded by the contour of the model with a reference measuring instrument
The edges of the constructed rectangular or polygonal models must be identified as shown in Fig. 2. These edges are highlighted and designated as a, b, c, d, and f. The lengths of the edges La, Lb, Lc, Ld, and Lf are measured using a reference instrument (e.g., a tape or laser distance meter). Lengths are recorded in meters to three decimal places. Each edge is measured five times, and the average length is calculated according to the following formula (eqn. 3):
where hat{L}x is the average edge length in meters, x is an index denoting the edge a, b, c, d, or f of the model’s contour, i is an index representing the measurement number, i = 1, …, 5; and Δs is the calibration error of the reference measuring instrument, obtained from its calibration certificate.
The areas of the models are calculated using the following equations (eqn. 4, eqn. 5):
The area uncertainty was calculated in accordance with the ISO/OIML principles of uncertainty propagation. The total standard measurement uncertainty for each model contour edge length is calculated as detailed in Appendix 2 (Supplementary material). The expanded uncertainty of each model’s area is then obtained using the following equation (eqn. 6):
where j is an index denoting the shape of the model, either rectangular or polygonal.
The expanded uncertainties of the areas bounded by the contours of the formed models must meet the criteria U(Aj) ≤ δApermissible/3, where δApermissible is the relative maximum permissible error of the AVMS. If this condition is not met for a given model, the model’s contour needs to be adjusted (e.g., use a smaller or simpler shape) and the uncertainty recalculated. The model contours should be refined until the expanded uncertainty of their area measurements meets the specified criterion.
Application of the proposed method
For the verification procedure of the log stack AVMS, a simulated log stack template (reference model) was constructed and used (Fig. 3). This model was calibrated under the same environmental conditions as the AVMS and constructed on a smooth, vertical plane. Laser levels ensured accurate alignment of the model’s edges. For rectangular reference models, two horizontal and one vertical laser level were used, providing leveling accuracy of about ±1 mm to ±1.5 mm per 10 m in both horizontal and vertical directions.
Fig. 3 - Establishing the reference perimeter using laser levels.
For the initial system test, area measurements were performed at a randomly chosen distance from the photographed plane. This verified the system’s ability to account for varying distances. The system must correctly recognize the captured image as the outline of a pile of logs. To verify the AVMS ability to calculate volume, we set the corresponding values of log length L and the density factor k. For each combination of L and k, the expected volume V is calculated using the formula V = A · k · L.
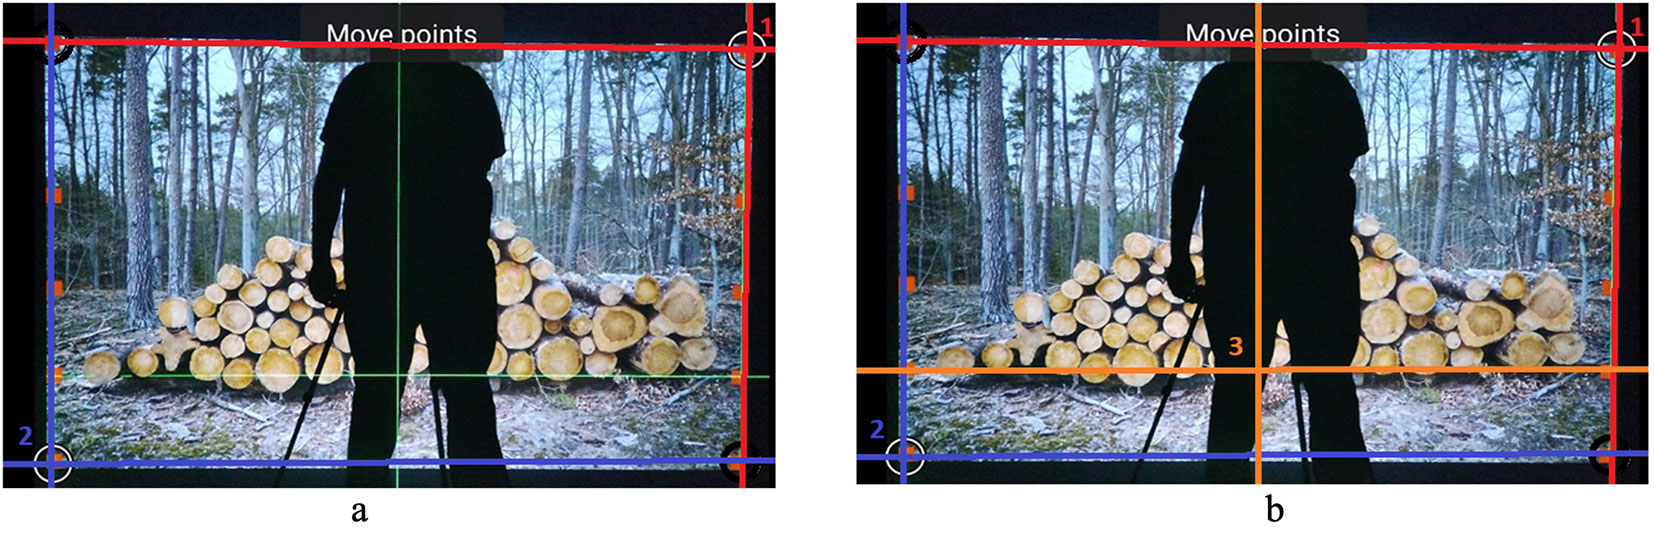
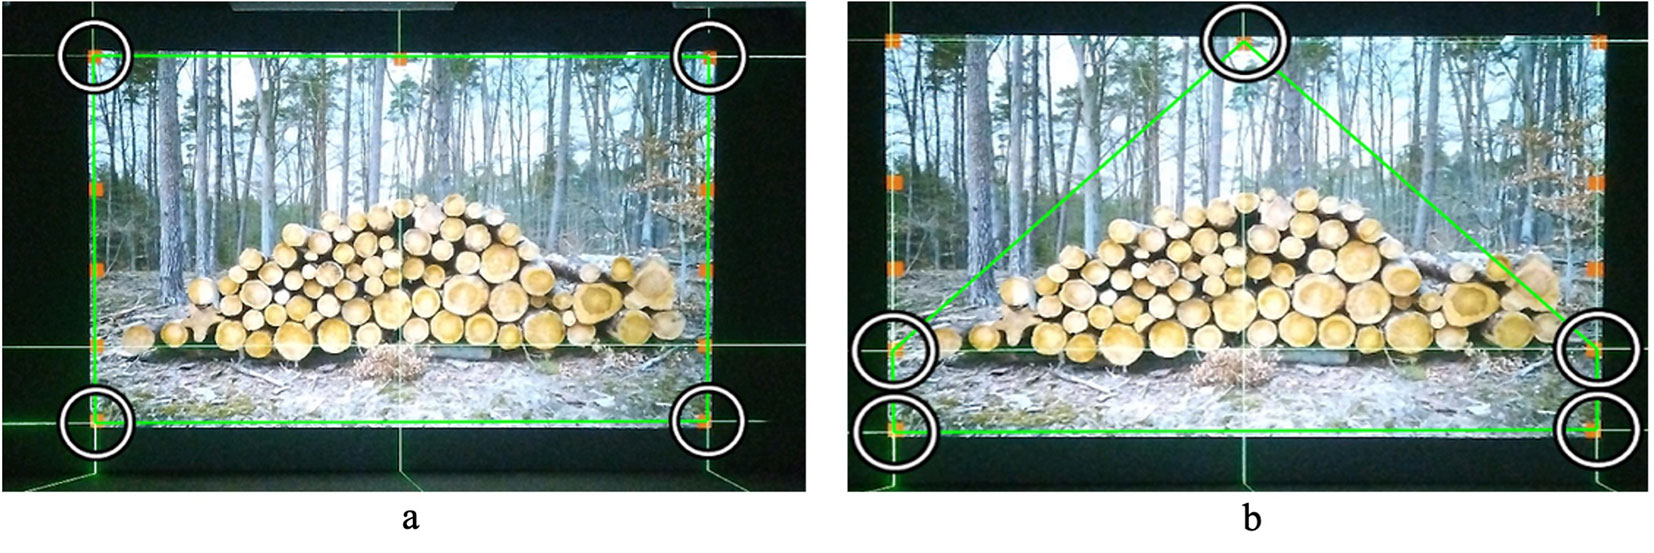
A photograph of an actual log stack was projected onto the same vertical plane as the reference model to activate the measurement system’s edge-detection algorithm (i.e., to ensure the system “sees” a realistic log arrangement within the reference contour). A reference outline was then established using three laser levels. Two laser levels defined a large outer rectangle: the intersection of their vertical and horizontal laser lines was aligned with the predetermined reference corner points (lower-left and upper-right) of the desired outline, as shown in Fig. 3a. This created the perimeter of the outer rectangular reference area. The third laser level created an internal horizontal reference line. Its vertical and horizontal beams were aligned approximately with the midpoint of the projected log stack’s top horizontal edge, at roughly 25%-40% of the total height from the bottom of the projection (Fig. 3b).
The required geometric dimensions of the reference outline were then measured using a laser distance meter, using the intersections of the laser lines as reference points. From these measurements, the areas of both the rectangular and polygonal reference shapes were calculated. Fig. 4a shows the reference points for the rectangular area, and Fig. 4b shows the reference points for the polygonal area.
Fig. 4 - The reference points for the rectangular and polygonal area.
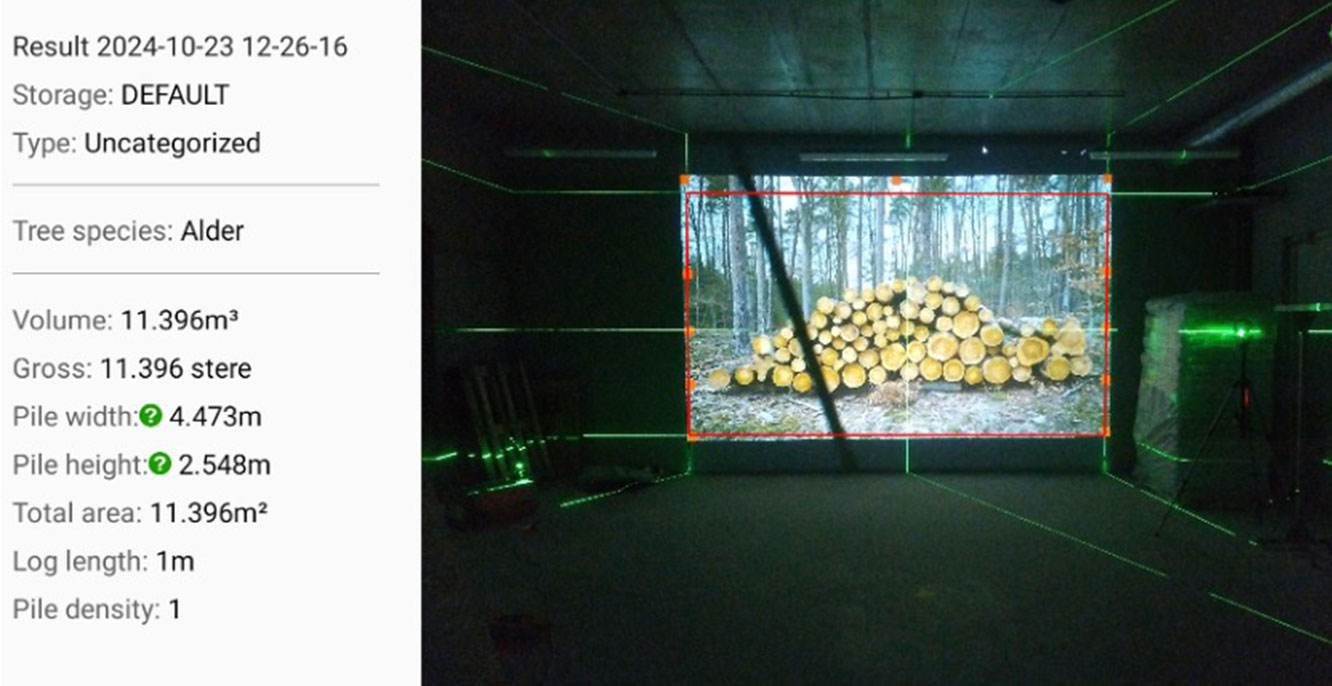
The areas of the reference model contours were also measured using a reference laser distance meter with 1 mm resolution, a systematic calibration error of -0.03 mm, and an expanded uncertainty of 0.8 mm. During the measurement of each contour edge, the readings were corrected by subtracting the reference instrument’s calibration error, applying the -(-0.03 mm) = +0.03 mm correction where appropriate. The pile width (m), pile height (m), and total area (m2) as determined by the AVMS were recorded on a tablet computer (see Fig. 5 for an example of the recorded results display).
Fig. 5 - Display of the recorded results on the tablet.
Two operators carried out the tests on separate batches of AVMS devices. The first batch contained 48 photo-optical systems, and the second batch contained 62, for a total of 110 devices tested. The devices under test are photo-optical volume measurement systems for timber log stacks, each employing at least two stereocameras. According to the manufacturer, the device measures the cross-sectional area of a log stack by detecting its contour (using an algorithm). Then it calculates the volume based on the log length and a filling (density) coefficient. The manufacturer-declared metrological specification is an area measurement error of ±3%. The device has certain operating limitations, including a valid working distance from the stack (min. 3 m, max. 8 m), a minimum ambient light requirement (> 2 lux), and a tolerance for camera alignment (the camera’s image plane must be within ±5° of parallel to the log stack end-face or truck trailer).
For all verification measurements, the AVMS was set to its “Contour” operating mode, with the log length L = 1 m and the stack density coefficient k = 1 (100%). The system allows the detected pile contour to be adjusted via user-selected boundary points (Fig. 4). The captured image of the model with the outlined contour, along with any manual contour adjustments, was saved in the measurement results report for each test.
To evaluate the errors of each device under test, the area enclosed by the contour detected by the AVMS was compared to the corresponding area measured by the reference method. Measurements with the device under test were performed for both reference model shapes at two distances: approximately 3.3 m and approximately 7.1 m from the model’s vertical plane. Two measurements were taken in each case for each distance and model shape. The calculated relative deviation of the area for each model at different distances is equal to: δAsystem = 100 · (Asystem - Amodel) / Asystem, where Asystem is the area value measured by the AVMS, and Amodel is the reference area value of the model contour calculated by eqn. 4 and eqn. 5. The relative deviation δAsystem of each measurement must not exceed the permissible error declared δApermissible by the manufacturer.
Results and discussion
The verification process consists of two main parts: (i) calibrating (measuring) the simulated reference model’s area; (ii) comparing the device-under-test’s results to the reference measurements. Before examining device performance, we also consider the calibration results for the reference model areas. Tab. 2presents the measured areas of the reference model contours and their uncertainties.
Tab. 2 - Summary of uncertainty budget for contour area measurement with a working standard. (σ): standard uncertainty; (σc): combined standard uncertainty; (W): sensitivity coefficient; (σc·W): component of the combined standard uncertainty, evaluated for its contribution.
| Sources of uncertainty | Value (m) |
σ (m) |
σc (m) |
W (m) | σc·W (m2) | |||
|---|---|---|---|---|---|---|---|---|
| A rect | A poly | A rect | A poly | |||||
| Calibration of a standard (Δs ± Us) | -0.00003 | 0.00041 | - | - | - | - | - | |
| Resolution (Δr) | 0.001 | 0.00041 | - | - | - | - | - | |
| Contour edge measurements | a | 2.612 | 0.00032 | 0.00059 | 4.3776 | - | 0.00258 | - |
| b | 4.3776 | 0.0006 | 0.00078 | 2.612 | - | 0.00204 | - | |
| c | 2.0626 | 0.00075 | 0.0009 | - | 2.1888 | - | 0.00197 | |
| d | 0.5494 | 0.00051 | 0.00072 | - | 4.3776 | - | 0.00315 | |
| f | 4.3776 | 0.0006 | 0.00078 | - | 1.5807 | - | 0.00123 | |
| Standard combined uncertainties for measuring areas : uc(Arect) = 0.00330 m2, uc(Apoly) = 0.00247 m2 | ||||||||
| The areas bounded by the contours of the models: Arect_mod = 11.434 m2, Apoly_mod= 6.920 m2 | ||||||||
| The expanded uncertainty of the bounded area: U(Arect)= 0.058 %, U(Apoly)= 0.071 % | ||||||||
Our results show that conventional working standards with a scale division of about 1 mm can be effectively used to measure a simulated reference model’s dimensions. When using such common measuring tools, it was not necessary to apply any additional correction factors from the reference instrument’s calibration certificate to the raw measurements, as the small systematic error of the standard was negligible at this scale. The correlation between opposite edge measurements of the rectangular models was insignificant, so covariance terms between edges could be neglected in the uncertainty evaluation for area calibration.
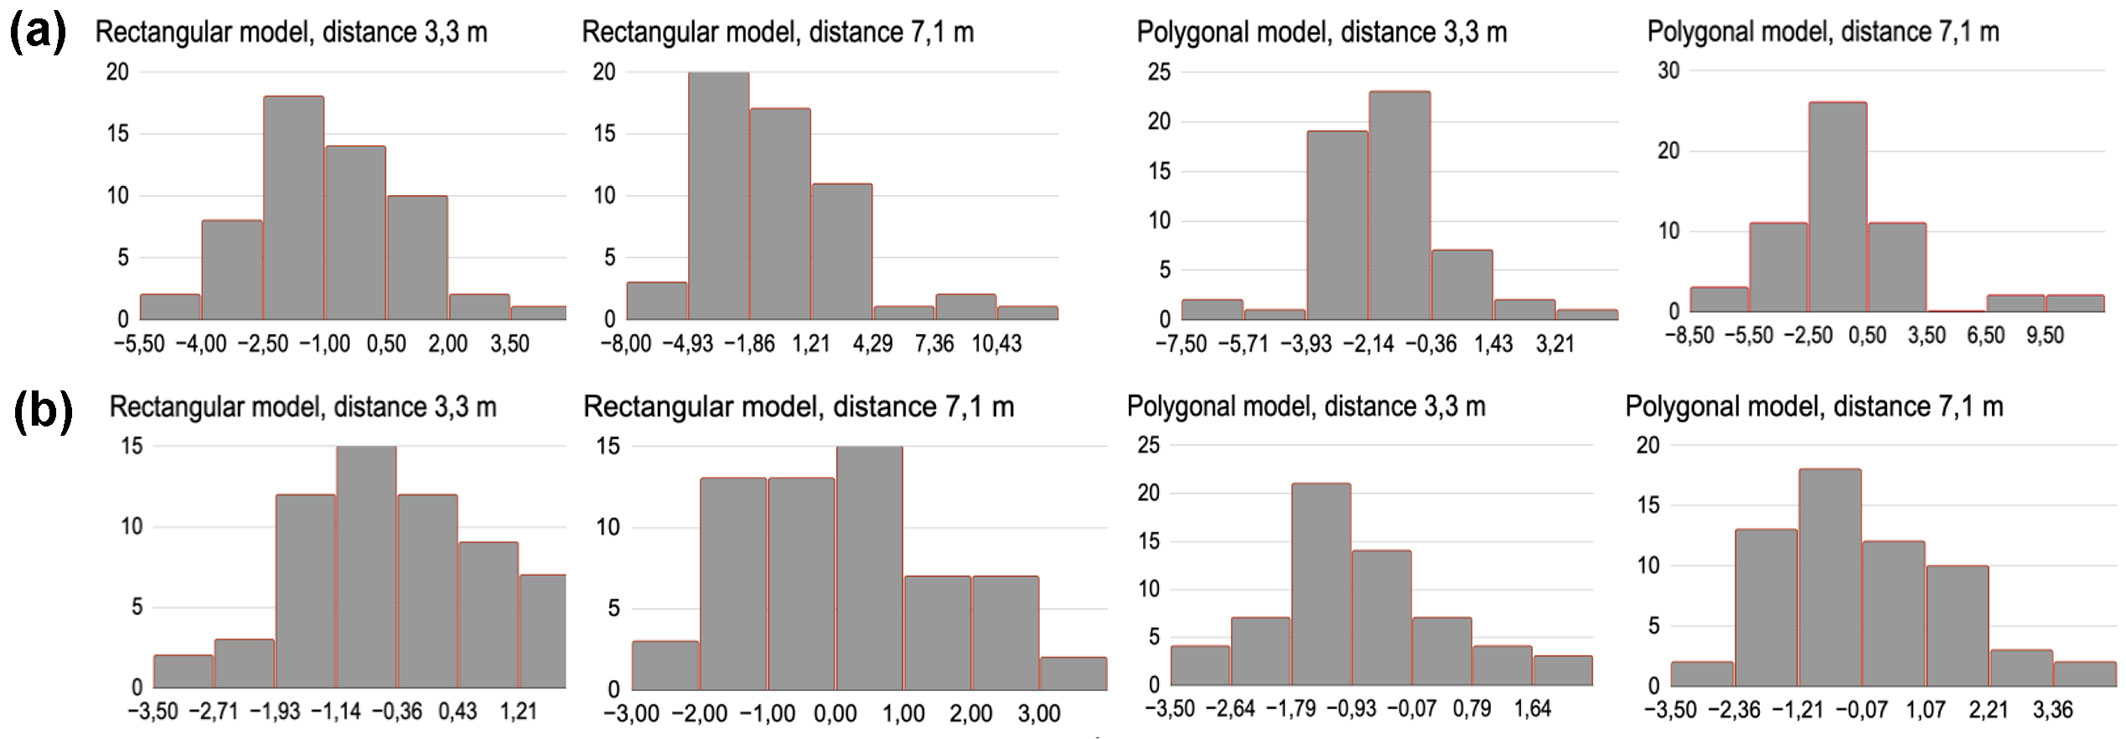
For each AVMS device under test (from both batches), the relative area deviation δ was calculated for both reference models at both test distances. Fig. 6summarizes the combined results for all 110 tests. Out of 110 photo-optical systems, 12% (13 systems) did not meet the manufacturer’s declared ±3% permissible error for area measurement. Overall, the results are approximately normally distributed, indicating that the measurement errors are predominantly random, with no strong systematic bias across devices. However, the distribution of area deviations for the first batch of devices is skewed toward negative values, indicating that those systems tended to underestimate the area. In contrast, the distribution for the second batch is skewed toward positive values, indicating that those devices tended to overestimate the area. We suspect these between-batch biases stem from slight differences in camera alignment or calibration among the devices, especially noticeable when photographs were taken from farther away.
Fig. 6 - Summarized results of area evaluation errors for all samples of both batches (a and b): relative area error on the x-axis, number of samples on the y-axis.
To evaluate the overall reliability of the verification method, we assessed not only individual device errors but also the method’s repeatability and reproducibility. The standard deviation of repeated area measurements (reflecting short-term repeatability) varied with area size and camera distance. For reference model areas between about 6 m2 and 12 m2, the standard deviation of the AVMS’s area readings ranged from roughly 0.2% to 0.3%. The method’s reproducibility, evaluated by varying conditions such as distance and operator and examining variation in results, was approximately 0.46%.
The overall uncertainty of the verification method includes the uncertainty in determining the reference model’s area, the method’s repeatability, and its reproducibility. Taking all these components into account, the total expanded uncertainty of the verification method is approximately 1.1%. The relative expanded uncertainty can be expressed by the following (eqn. 7):
where umod is the standard uncertainty of contour area measurement with a working standard, urepeat is the uncertainty due to repeatability based on a calculation of a standard deviation of area measurement obtained from multiple measurements, and ureprod is the standard deviation of multiple repeatability test results where the conditions of measurement have been changed. To calculate the overall uncertainty, we used the maximum observed values of these components as a conservative estimate.
This verification method reliably ensures the performance of photo-optical systems when manufacturers declare an allowable area error of 3% or greater for timber stack end-face measurements. This holds true provided that a 1:3 uncertainty ratio between the reference standard and the device under test is maintained during reference instrument selection ([19]).
Conclusions
This study presents the key aspects of conformity assessment procedures for photo-optical volume measurement systems used for log stacks. It describes a practical methodology, validated under laboratory conditions, applied to AVMS in the context of metrological supervision (verification). The proposed procedure ensures that AVMS comply with legal requirements by guaranteeing traceability to internationally recognized units.
A simple, reliable, and easy-to-implement verification method for photo-optical AVMS for measuring the area of wood stacks has been developed and tested. The method is based on reference models whose areas are measured using working standards with fine scale divisions (0.5-1 mm). The procedure covers various aspects of AVMS verification, including identifying key performance characteristics, selecting suitable reference instruments, simulating and calibrating reference models, evaluating measurement characteristics, and processing the results.
We comprehensively evaluated the metrological performance of the method. Its reproducibility is high (on the order of <1%), and the total uncertainty is about 1.1% (relative, expanded). Using this method, we identified several shortcomings in current commercially available AVMS, including instances of non-compliance with the manufacturers’ declared error specifications and some design limitations, particularly related to camera alignment and imaging. Nonetheless, the verification method allows us to test and confirm the accuracy of existing AVMS (with manufacturer-declared area errors of 3% or more).
The findings of this study are relevant to developing new standards and guidelines in this field. International organizations such as ISO and IEC continue to develop standards to meet the needs of emerging technologies. Harmonizing standards across regions reduces duplication of effort and facilitates global trade by ensuring products are evaluated using consistent criteria.
Overall, the proposed verification technique is a valuable tool for ensuring the accuracy and reliability of AVMS in the timber industry. Its application can improve measurement accuracy, help detect potential problems in AVMS, and contribute to more efficient and fair timber trade. Future research and development should focus on further mitigating camera-related limitations and improving image-processing algorithms in photo-optical measurement systems to enhance AVMS accuracy and reliability. It is worth noting that this verification method enables performance testing in laboratory conditions rather than in the field, significantly reducing the economic burden on AVMS operators and contributing to environmental goals, e.g., by avoiding unnecessary travel or machine operation, thereby reducing emissions.
Acknowledgements
The authors are grateful to Timbeter OÜ for their support and cooperation in field data collection.
References
Gscholar
CrossRef | Gscholar
Online | Gscholar

Authors’ Info
Authors’ Affiliation
Paulius Kaškonas 0000-0002-6218-6432
Benas Gabrielis Urbonavičius 0000-0002-4779-101X
Gintautas Balčiunas 0000-0001-9749-5780
Justina Dobiliene
Edita Raudiene 0000-0003-0368-0825
Darius Gailius
Institute of Metrology, Kaunas University of Technology, Studentu 50, Kaunas LT-51368 (Lithuania)
Corresponding author
Paper Info
Citation
Meškuotiene A, Kaškonas P, Urbonavičius BG, Balčiunas G, Dobiliene J, Raudiene E, Gailius D (2026). Verification technique for a photo-optical volume measuring system for stacks of timber logs. iForest 19: 352-358. - doi: 10.3832/ifor4869-019
Academic Editor
Luigi Todaro
Paper history
Received: Apr 10, 2025
Accepted: Jul 06, 2026
First online: Sep 05, 2026
Publication Date: Oct 31, 2026
Publication Time: 2.03 months
Copyright Information
© SISEF - The Italian Society of Silviculture and Forest Ecology 2026
Open Access
This article is distributed under the terms of the Creative Commons Attribution-Non Commercial 4.0 International (https://creativecommons.org/licenses/by-nc/4.0/), which permits unrestricted use, distribution, and reproduction in any medium, provided you give appropriate credit to the original author(s) and the source, provide a link to the Creative Commons license, and indicate if changes were made.

Web Metrics
Breakdown by View Type
Article Usage
Total Article Views: 1268
(from publication date up to now)
Breakdown by View Type
HTML Page Views: 463
Abstract Page Views: 388
PDF Downloads: 347
Citation/Reference Downloads: 0
XML Downloads: 70
Web Metrics
Days since publication: 49
Overall contacts: 1268
Avg. contacts per week: 181.14
Article Citations
Article citations are based on data periodically collected from the Clarivate Web of Science web site
(last update: Jul 2026)
(No citations were found up to date. Please come back later)
Publication Metrics
by Dimensions ©
Articles citing this article
List of the papers citing this article based on CrossRef Cited-by.
Related Contents
iForest Similar Articles
Research Articles
Comparison of wood stack volume determination between manual, photo-optical, iPad-LiDAR and handheld-LiDAR based measurement methods
vol. 16, pp. 243-252 (online: 23 August 2023)
Research Articles
Fuel consumption comparison of two forwarders in lowland forests of pedunculate oak
vol. 12, pp. 125-131 (online: 11 February 2019)
Research Articles
Deploying an early-stage Cyber-Physical System for the implementation of Forestry 4.0 in a New Zealand timber harvesting context
vol. 17, pp. 353-359 (online: 13 November 2024)
Research Articles
Use of terrestrial laser scanning to evaluate the spatial distribution of soil disturbance by skidding operations
vol. 8, pp. 386-393 (online: 08 October 2014)
Research Articles
Comparison of alternative harvesting systems for selective thinning in a Mediterranean pine afforestation (Pinus halepensis Mill.) for bioenergy use
vol. 14, pp. 465-472 (online: 16 October 2021)
Research Articles
Examining the evolution and convergence of wood modification and environmental impact assessment in research
vol. 10, pp. 879-885 (online: 06 November 2017)
Research Articles
The potential of using xylarium wood samples for wood density calculations: a comparison of approaches for volume measurement
vol. 4, pp. 150-159 (online: 11 August 2011)
Research Articles
Modifying harvesting time as a tool to reduce nutrient export by timber extraction: a case study in planted teak (Tectona grandis L.f.) forests in Costa Rica
vol. 9, pp. 729-735 (online: 03 June 2016)
Research Articles
Shear modulus of old timber
vol. 10, pp. 446-450 (online: 24 March 2017)
Research Articles
Comparison of timber-house technologies and initiatives supporting use of timber in Slovenia and in Sweden - the state of the art
vol. 10, pp. 930-938 (online: 07 December 2017)
iForest Database Search
Google Scholar Search
Citing Articles
Search By Author
Search By Keywords