Seasonal dynamics of Cryptostroma corticale conidial spread
iForest - Biogeosciences and Forestry, Volume 18, Issue 2, Pages 79-86 (2025)
doi: https://doi.org/10.3832/ifor4676-018
Published: Apr 17, 2025 - Copyright © 2025 SISEF
Research Articles
Abstract
Cryptostroma corticale, the causal agent of sooty bark disease (SBD) in maples, is a typical tree pathogen that emerged as a result of climate change. In Central Europe, it primarily affects sycamore maple, with airborne conidia infecting fresh bark wounds, allowing the fungus to penetrate the wood. C. corticale may survive in an endophytic phase until the tree is stressed by drought and/or long periods of above-average temperatures. After such periods, it begins to develop stromata under the bark. When the covering layer of bark is peeled off, infective airborne conidia are spread over distances of up to hundreds of kilometers. Apart from infecting trees, these conidia can also cause hypersensitive pneumonitis in humans. To describe the seasonal spore dispersal pattern of C. corticale, an automatic volumetric spore trap was installed from March to November 2022 in an SBD-affected locality close to Brno, Czech Republic. Samples were analyzed by qPCR, and a logistic regression model was fitted to express the spore occurrence probability based on meteorological variables. The model revealed a positive effect of wind speed on spore abundance and a negative impact of temperature and surface moisture. The highest abundance of spores was recorded in spring. Negligible numbers of conidia were observed during the summer, followed by a slight increase in the early autumn and a subsequent drop after the end of October. Practitioners are advised to avoid any bark or wood damage during windy and dry weather throughout the growing season. Arboriculture care should be planned for winter or windless, hot, and wetter days throughout the growing season when spore concentrations are lowest, thereby reducing the risk of spreading the disease and provoking allergic reactions in humans.
Keywords
Sycamore Maple, Spore Trap, Air Sampling, qPCR, Molecular Detection, Sooty Bark Disease, SBD
Introduction
Cryptostroma corticale (Ellis & Everhart) Gregory & Waller was first described as Coniosporium corticale by Ellis and Everhart in 1889 from the bark of a dead sugar maple (Acer saccharum Marshall) in London (Ontario, Canada). It was later discovered to be the causal agent of sooty bark disease by Gregory ([24]) and Gregory & Waller ([26]) in 1945 after multiple sycamores were observed to be diseased in Wanstead Park, Essex, London, UK and subsequently renamed Cryptostroma corticale. The pathogen began to spread across Europe in the 1950s, initially reaching France and Italy ([49], [9]), and Germany by 1964 ([39]). More recently, sooty bark disease (SBD) has been reported in Switzerland ([19]), Austria ([10]), Germany ([35]), the Netherlands ([20]), Bulgaria ([4]), the Czech Republic ([31]), Slovakia ([32]), Belgium ([21]), Slovenia ([38]) and most recently Russia ([23]) and Italy ([42]).
The literature reports a clear association between SBD outbreaks and extremely warm and dry years ([26], [36], [46], [39], [3], [1], [50], [15], [14], [2]). Muller et al. ([37]) emphasized the potential role of global climate change in SBD outbreaks. In Europe, C. corticale, the causal agent of SBD, occurs mainly on sycamore maple (A. pseudoplatanus L.), but it has also been isolated from A. platanoides L., A. negundo L. ([43]), A. campestre L. ([31], [42]) and Aesculus hippocastanum L. ([6]). Thirteen species of maple are susceptible, with A. nigrum F.Michx. the most vulnerable ([15]). C. corticale invades the host primarily via branch stubs after wind damage ([26]) and via fresh wounds in the bark ([46]). Once in the tree, the fungus spreads radially through medullary rays and, to a lesser extent, longitudinally via xylem vessels. However, the fungus primarily resides in the phloem and cambium ([26]). It can survive many years as an endophyte ([30], [41]) and eventually invade the heartwood ([15]). The switch to the pathogenic stage typically occurs when the tree experiences extreme conditions, such as dry and hot weather during the summer, which also favors the growth of the fungus ([26], [14]). Symptoms of the disease begin with wilting leaves, progressing to general dieback, and eventually, build-up of fungal stroma under the bark once the fungus has reached the cambial zone ([26]). Infection in the tree is typically accompanied by brown-green, sharply edged-stains in the wood ([26], [31]). The mature stroma of an adult tree is expected to liberate approximately 5 × 10¹³ (soot-like) airborne conidia ([26]). The outer bark gradually peels away, and conidia are dispersed by wind over long distances ([26], [37]). For example, Muller et al. ([37]) found conidia in air samples 310 kilometers from the closest infected locality. Although the dark stromata are usually very apparent, the presence of C. corticale can be overlooked for years ([31]). This may be due to the long-lasting endophytic stage ([30], [41]), to epiphytic mosses consistently covering the bark of maples and obscuring the stromata in some areas ([7]), or due to other pathogens or saprophytes producing black stromata on or under the bark of the trees ([31], [29]). The spores of C. corticale can also be dangerous for humans, with reports of workers in intensive contact with diseased maples developing hypersensitive pneumonitis ([45], [18], [39], [5]). The World Health Organization names the disease Maple Bark Stripper Lung ([48]), emphasizing the need to control the current global spread of the disease.
Efficient control of SBD spread must be based on detailed knowledge of the temporal and spatial variation in the abundance of C. corticale conidia. This information is essential for effective management strategies of infected forest stands and municipal green spaces, which focus on protecting the health of both maple trees and humans ([8], [37]). With this in mind, this study aimed to investigate how concentrations of C. corticale conidia vary in relation to weather conditions during a single season.
Material and methods
Experimental plot
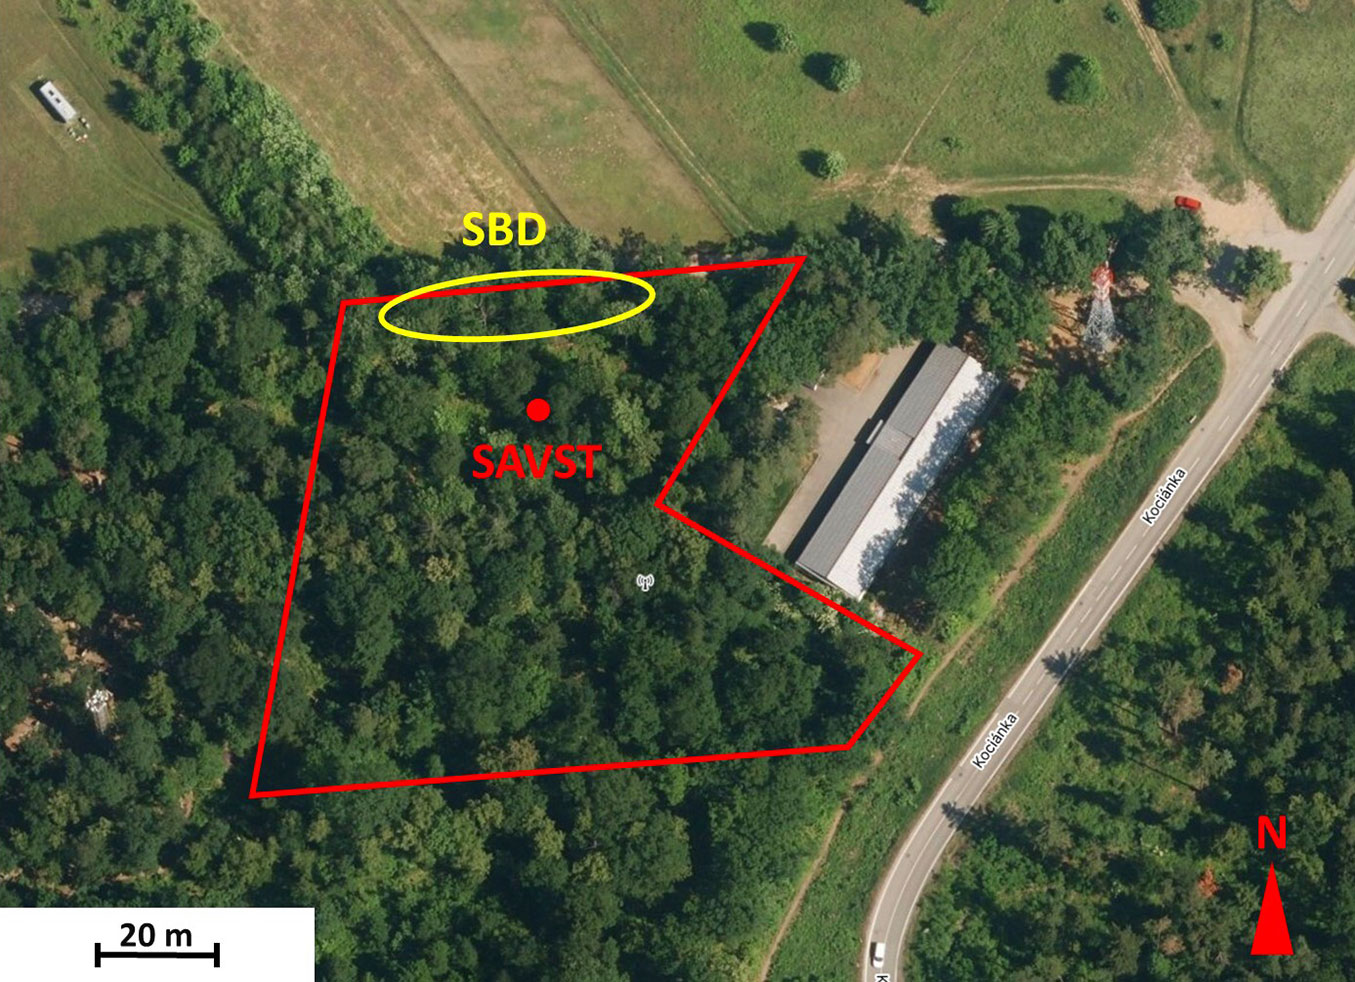
The sampling plot Brno-Sadová is located in the vicinity of Brno, Czech Republic (49.2468° N, 16.6141° E, 360 m a.s.l.). It is part of an 11-hectare large forest complex called Forest enterprise “Masaryk Forest”, Krtiny, and it is managed by Mendel University in Brno. In the past, it already served as an experimental plot for various fields of research ([11]). The plot area is approximately 0.75 hectares and is delimited by a fence. It has been a poorly managed, mixed forest planted in 1928. The most common tree species is Tilia cordata (24%), followed by Quercus petrea (20%), Acer platanoides (14%), A. pseudoplatanus (10%), Fraxinus excelsior (10%), A. campestre (7%), Cerasus avium (5%), Pinus sylvestris (4%), Pseudotsuga menziesii (3%) and one tree each of Carpinus betulus, Sorbus torminalis, Robinia pseudoacacia, Cornus mas and Ulmus glabra. The understory is very dense due to a loose canopy and fertile soil built on loess clays, and it is mostly composed of regenerating maples (mostly A. campestre), Ligustrum vulgare, Rubus sp., and other species. The 18 growing sycamores (A. pseudoplatanus) are represented partly by small trees from natural regeneration and partly by mature trees with a breast height diameter of up to 46 cm and a height of almost 30 m. Most of the mature trees (eight) are concentrated along the path at the northern border of the locality (Fig. 1). They exhibit varying degrees of dieback, with some of their polycormic stems completely dead. One of the stems was covered with stromata of C. corticale, as well as one fallen branch. There were more visible black stromata in the upper crown. However, they were not accessible to identify them correctly. The frequent occurrence of black stromata of Eutypa maura and Biscogniauxia sp. made distant identification difficult. The conidia of the pathogen, taken from the stromata, were identified microscopically.
Fig. 1 - Map of the sampling plot. The fenced sampling locality is marked with a red line; the red circle shows the position of the air sampler (SAVST), and the yellow ellipse is in the position of sycamores with dieback and sooty bark disease symptoms.
Air sampling
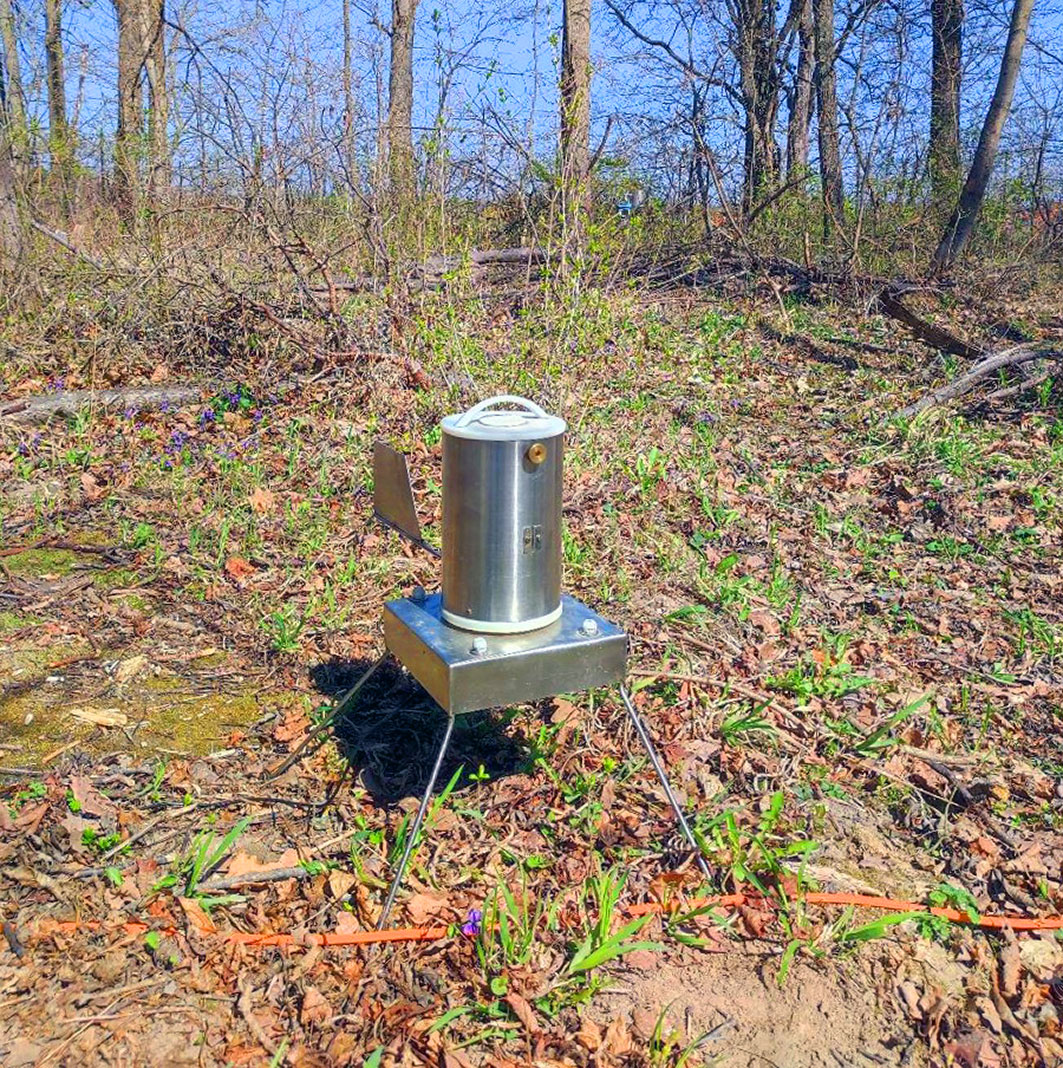
A seven-day automatic volumetric spore trap (AVST - AMET, Velké Bílovice, Czechia) based on principles published by Hirst ([28]) was used to assess the concentration of the air inoculum (Fig. 2). A detailed description of the device can be found in Dvorák et al. ([17]); the sampling rate of the AVST was 14 liters of air per minute. It was installed on the ground with the orifice ca. 30 cm above ground level and powered from 230 V electric network available in an adjacent building. The distance from the closest known source of inoculum was about 20 m (Fig. 1). At least every third week from March 16 to November 22, 2022 the AVST sampled. It was loaded with Melinex (polyester) tape covered by a thin layer of petroleum jelly. The exposed tape was removed after seven days, cut into pieces corresponding to 24-hour samples, and placed in 2 ml microtubes. The samples were then stored at -20 °C before further processing.
Fig. 2 - Automatic volumetric spore trap (AMET, Velké Bílovice, Czechia), installed to sample the air 30 cm above the ground in an unmanaged mixed forest infected with the sooty bark disease.
Next to the AVST a weather station (AMET, Velké Bílovice, Czechia) was installed 1 m above the ground. It recorded air temperature, relative air humidity, precipitation, and leaf moisture every hour. The leaf moisture values were obtained from measurements of the electric conductivity of a filter paper exposed to environmental conditions. The datalogger recorded values from 0 (dry paper) to 1 (wet paper).
DNA extraction and qPCR
DNA was extracted from 112 exposed tape sections in microtubes using the protocol described by Dvorák ([16]). An empty microtube was added to every extraction run as a negative control of DNA extraction.
All qPCR reactions were performed on Lightcycler 480® Instrument II (Roche Diagnostics, Rotkreuz, Switzerland) using 96-well plates. Each well contained 10 µl of a reaction mixture of the following composition: 5 μl Light Cycler 480 Probes master (Roche), oligonucleotides according to Muller et al. ([37]), i.e., primers ccITS2-F and SBD3-R in final concentration 0.3 µM, hydrolysis probe with dual labeling FAM-BHQ in final concentration 0.1 µM, 2 µl template DNA and PCR-clean water up to the final 10 µl volume. The cycling conditions respected the prescription of the producer of the Light Cycler 480 Probes master and requirements of Muller et al. ([37]): predenaturation 95 °C, 5 min; 42 cycles of denaturation at 95 °C, 10 s, annealing at 62 °C, 45 s, extension and fluorescence acquisition at 72 °C, 1 s; final cooling at the end of the reaction at 40 °C, 10 s.
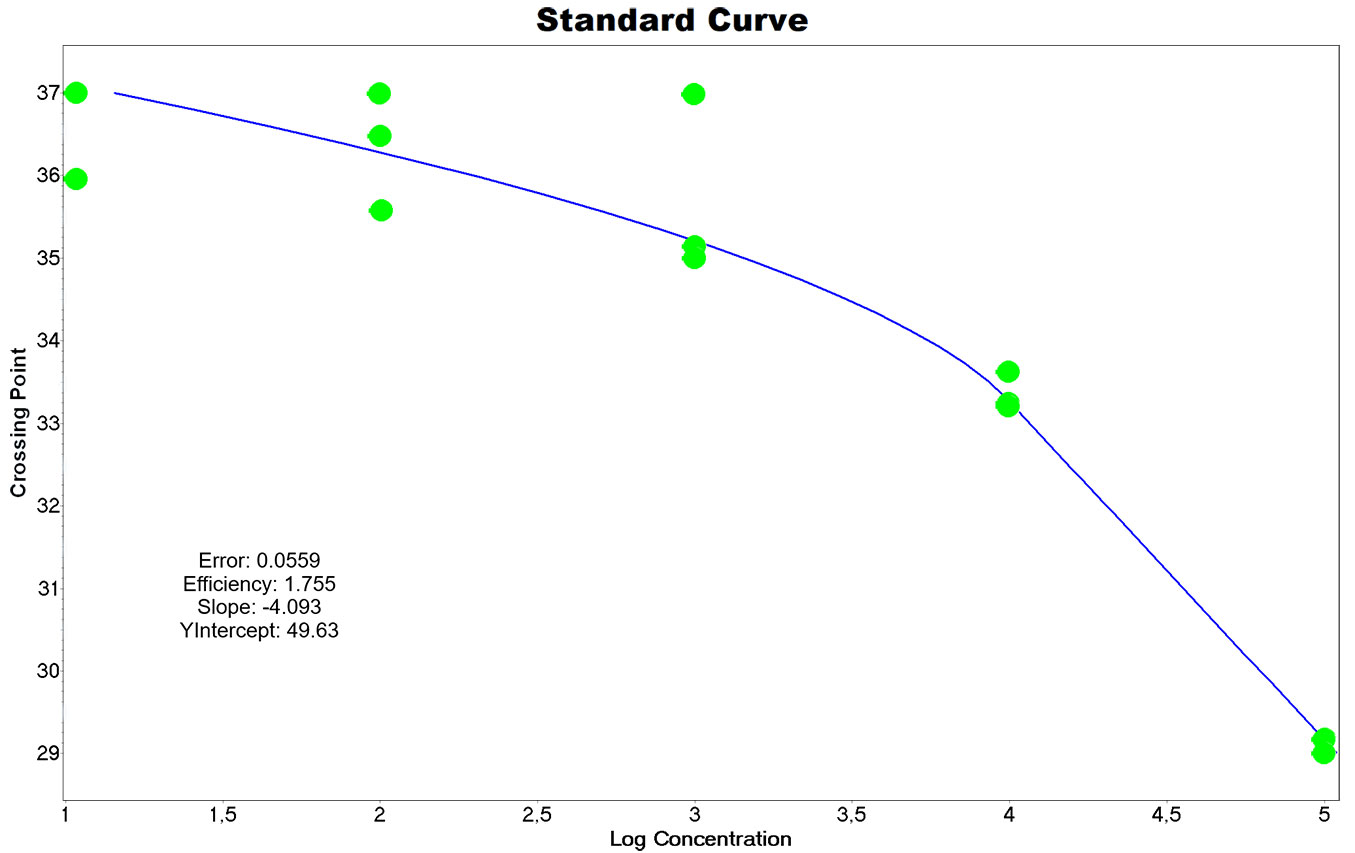
Absolute quantification was performed via serial dilutions of a conidial suspension to accurately estimate the amount of conidia in each air sample. The suspension was obtained by dipping the fresh stroma into distilled water. The concentration of the conidial suspension was estimated microscopically using a hemocytometer, and consequently, five serial dilutions of 105 - 10 spores in 2 ml microtubes were prepared. For a proper simulation of air samples, clean Melinex tape covered with petroleum jelly was added to each microtube. Suspensions in microtubes were subjected to DNA extraction and qPCR run using the same protocol as for the air samples. For each qPCR run, the DNA extracts from the suspensions were assigned as standards, creating a standard curve that was used via the Light Cycler software as the external quantification curve for every qPCR run. The standard curve and its parameters are displayed in Fig. 3. According to the ambiguous quantification of samples with Cp higher than 36, samples were assigned as positive if at least two of the three technical repetitions achieved the Cp (= number of the cycle when the fluorescence achieved its second derivative maximum, defined and calculated by the software) lower than 37 and it was quantified having the Cp less than 36. The quantity was calculated by the Light Cycler software as the mean of the positive Cp values.
Fig. 3 - Standard curve of serial dilutions of conidial suspensions. The chart and the displayed parameters were generated by LightCycler® 480 Software release 1.5.62 SP3. According to the manufacturer’s instructions, the error value should not exceed 0.2. The efficiency of the reaction 1.755 corresponds to 88% (efficiency 2.0 would mean 100%). Due to big dispersion and unclear trend after 36th cycle, only samples with Cp lower than 36 were quantified. Samples with Cp from 37 were considered negative.
Statistical analysis
To investigate the relationship between detected spores and weather conditions, a generalized linear model (GLM) was employed. In our case specifically, a multiple binary logistic regression model was used (eqn. 1 - eqn. 2):
or (eqn. 3):
where the response variable y is the binary presence/absence of spores in the sample. The following explanatory variables were included in particular columns of matrix X. In the case of the full model, the explanatory variables were: daily mean air temperature (°C), daily mean relative air humidity (%), daily precipitation (mm), leaf moisture (V), daily sunlight duration (min), month of a year, minimum and maximum daily temperature (°C) and daily mean wind speed (m s-1). Sunlight duration and wind speed data were obtained through the Open-Meteo API ([51]), submitting the GPS coordinates of the sampling spot. The full model’s formula was as follows (eqn. 4):
where π indicates the probability of spore occurrence and βi [i = 0, 1, ..., p] are the regression coefficients associated with the reference group and the explanatory variables. Since the logistic regression model expressing the presence of spores contains a categorical time variable (i.e., the month of the year: March - III, April - IV, etc.), we present in Tab. 1the so-called Odds ratio, which is determined as exp(βi). To characterize the predictive power of the model, we use RTjur2 with a range of values (0;1), which can be considered asymptotically equivalent to the index of determination (R2) used in conventional linear models ([44]).
Tab. 1 - Estimated multivariable binary logistic regression parameters expressed as Odds ratios (1 = no spore occurrence probability change estimated, 0.94 = 6% decrease, 1.16 = 16% increase), standard errors, 95% confidence intervals and the p-values for the reduced final model (* = significant). The Intercept presents the reference predictors (= values of March). The lowest AIC (Akaike Information Criterion) value indicated the best model.
| Reduced final model -Predictors | Binary response: spores present/absent (1/0) | ||
|---|---|---|---|
| Odds Ratios | 95% C. I. (asymptotic) |
P-value (based on Wald) |
|
| (Intercept) | 1.23 | 0.12 - 12.09 | 0.859 |
| Average temperature | 0.94 | 0.80 - 1.09 | 0.418 |
| Leave moisture | 0.30 | 0.05 - 1.63 | 0.174 |
| April | 0.21 | 0.04 - 0.87 | 0.040* |
| May | 0.32 | 0.03 - 3.33 | 0.344 |
| June | 0.93 | 0.07 - 11.70 | 0.952 |
| July | 0.05 | 0.00 - 0.75 | 0.045* |
| August | 0.38 | 0.03 - 5.16 | 0.468 |
| September | 0.09 | 0.00 - 1.01 | 0.076 |
| October | 1.12 | 0.16 - 8.51 | 0.906 |
| November | 0.00 | NA | 0.988 |
| Wind speed | 1.16 | 1.02 - 1.35 | 0.029* |
| Observations | 112 | ||
| R 2 Tjur | 0.277 | ||
| AIC | 142.139 | ||
Consequently, a backward elimination was used to derive the final logistic regression model ([27]) from the full model and reach the maximal parsimony. To select the best regression model, the Akaike Information Criterion (AIC) was used. The model with the lowest AIC was used for the best interpretation of relationships between spore occurrence and environmental variables. To roughly evaluate the significance of particular explanatory variables, we used Wald’s classical asymptotic test, typically linked to linear models. It was not used for the reduction of variables in the final regression model.
All numerical computations were performed in the R ver. 4.4.0 programming environment ([40]).
Results
Quantification of spores and seasonal dynamics
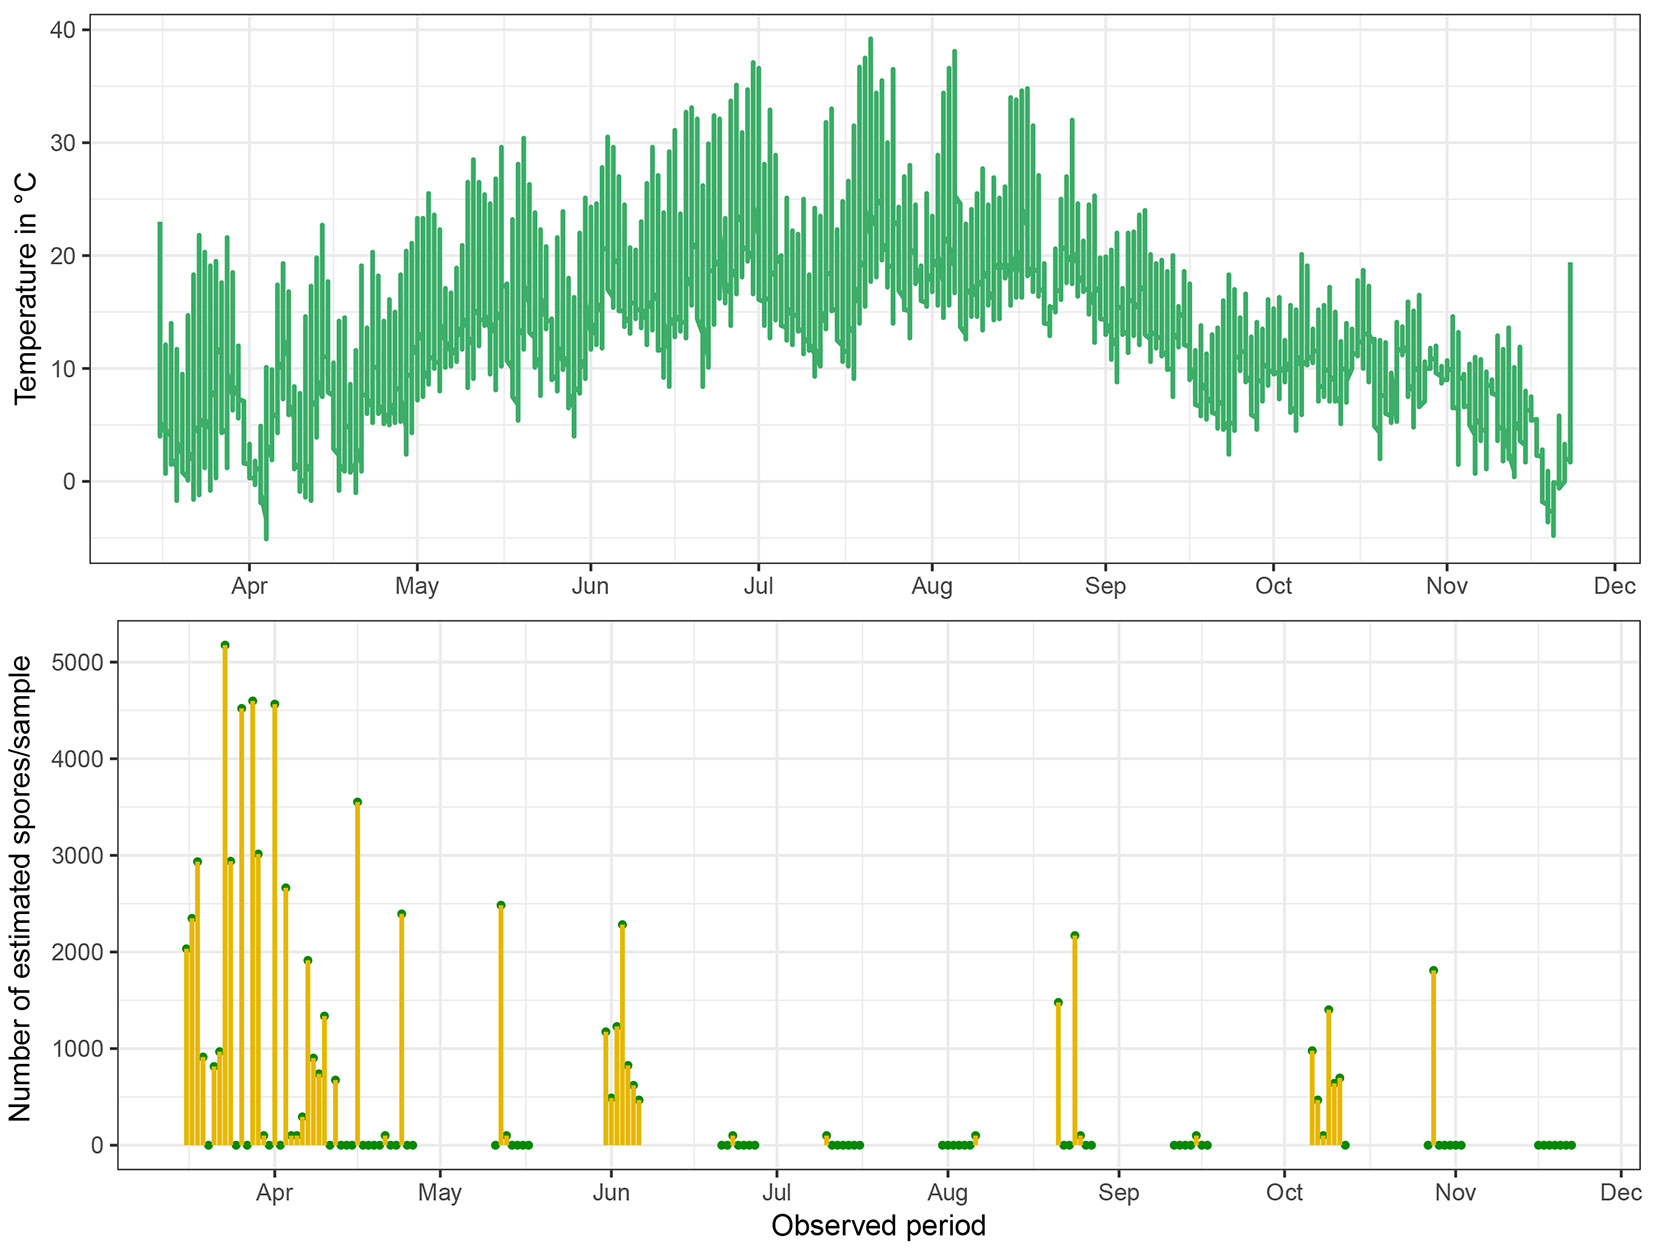
During the sampling season, 112 days were covered by 16 samplings (Fig. 4). The inoculum of C. corticale was found in samples from 48 sampling days, and it was possible to quantify it in samples from 37 days. The highest concentration of conidia was obtained on March 23, with 5176 conidia per sample, equivalent to an average concentration of 257 conidia per cubic meter of air. On the other hand, the lowest quantifiable amount of conidia in a sample was 294, corresponding to approximately 14 conidia per cubic meter of air. Generally, the peak period of conidial spread was observed in early spring, specifically during the first month of sampling, from mid-March to mid-April, when 71% of the samples were positive. During the following spring period until June 6, the concentration of conidia decreased in both quantity and frequency, with only 46% of the samples being positive. During the summer period, from June 21 to September 17, the presence of inoculum further decreased to 20%, with periods of no positive detection lasting up to 12 days. Nevertheless, autumn began with an increase in sporulation from October 6 to 28, with 78% of samples testing positive. After October 28, the sporulation ceased, and no conidia were detected until the end of sampling on November 22.
Fig. 4 - Daily mean air temperature (upper) and the number of estimated spores per day (lower) throughout the entire sampling season. Positive unquantified detections are displayed as 100 spores per sample. Comparing the courses of variables, the opposite trend is evident, i.e., low or no sporulation was recorded during hot summer months.
General Linear Models
The resulting multiple binary logistic model, which included the complete set of predictor variables (full model - for brevity, not shown), significantly improved the explanation of the relationship between spore presence and weather characteristics compared to the model without predictors (null model - p-value = 0.0008947), achieving an AIC of 147.393. To achieve maximal parsimony, we employed a backward elimination procedure and obtained a final reduced logistic regression model with an AIC of 142.139.
Tab. 2 - Analysis of deviance for null, full, and reduced logistic regression models. (df): degrees of freedom.
| Model | Residual df |
Residual Deviance |
df | Deviance | p-value |
|---|---|---|---|---|---|
| Null model | 111 | 152.97 | - | - | - |
| Full model | 95 | 113.3 | 16 | 39.585 | 0.0008947 |
| Reduced final model | 100 | 118.14 | -5 | -4.753 | 0.4467814 |
The reduced model (Tab. 1) with a smaller set of predictor variables (daily mean average temperature, daily mean leave moisture, sampling months, and daily mean wind speed) did not differ significantly from the full model (p-value = 0.446 - more details in Tab. 2) and therefore may be preferred due to its simplicity and computational efficiency. The following equation gives the formula for the reduced logistic model (eqn. 5):
where Tav is the average temperature, Mleaf is the leaf moisture, WS is the wind speed, and Si is a dummy variable for the estimated effect of the i-th month [i = Apr, May, …, Nov]; e.g., modelling probability of sporulation in June: SJune = 1, all other Si = 0.
The β0 is an estimated value of the reference level representing sampling in March (0 °C), windless and dry surface of leaves. The resulting odds ratios for the particular regression coefficients, e.g., exp(βi) [i = 0, 1, 2, ..., 12], are provided in the first column of Tab. 1. Thus, exp(0.20498194) = 1.23 is the chance of spore occurrence under the reference conditions.
The results from the final reduced logistic regression model (Tab. 1) revealed that a 1 °C increase in daily mean average temperature is associated with a 6% decrease in the odds of spore occurrence, holding all other variables constant. The percentage of the decrement was calculated as the difference from 1.00. Similarly, complete wetting of dry leaves corresponds to a 70% decrease in the odds of spore occurrence. Conversely, a 1 m s-1 increase in wind speed is associated with an approximately 16% increase in the odds of spore occurrence. For categorical variables representing the month of the year, interpretation is based on the reference month of March. For example, in July, the odds of spore occurrence correspond to a 95% decrease compared to spore occurrence under reference conditions in March, holding all other variables at a constant value. This effect was found to be significant (p-value = 0.040).
The precision of the odds ratio estimates of the months’ effects (Tab. 1) varied and was generally lower compared to the estimates for the effects of meteorological variables. For example, the 95% confidence interval for the odds ratio of average temperature was 0.80-1.09; for wind speed, it was 1.02-1.35; and for April, 0.04-0.85. A zero value of the estimate, indicating no significant effect, was observed in November due to a total lack of spores in the air samples.
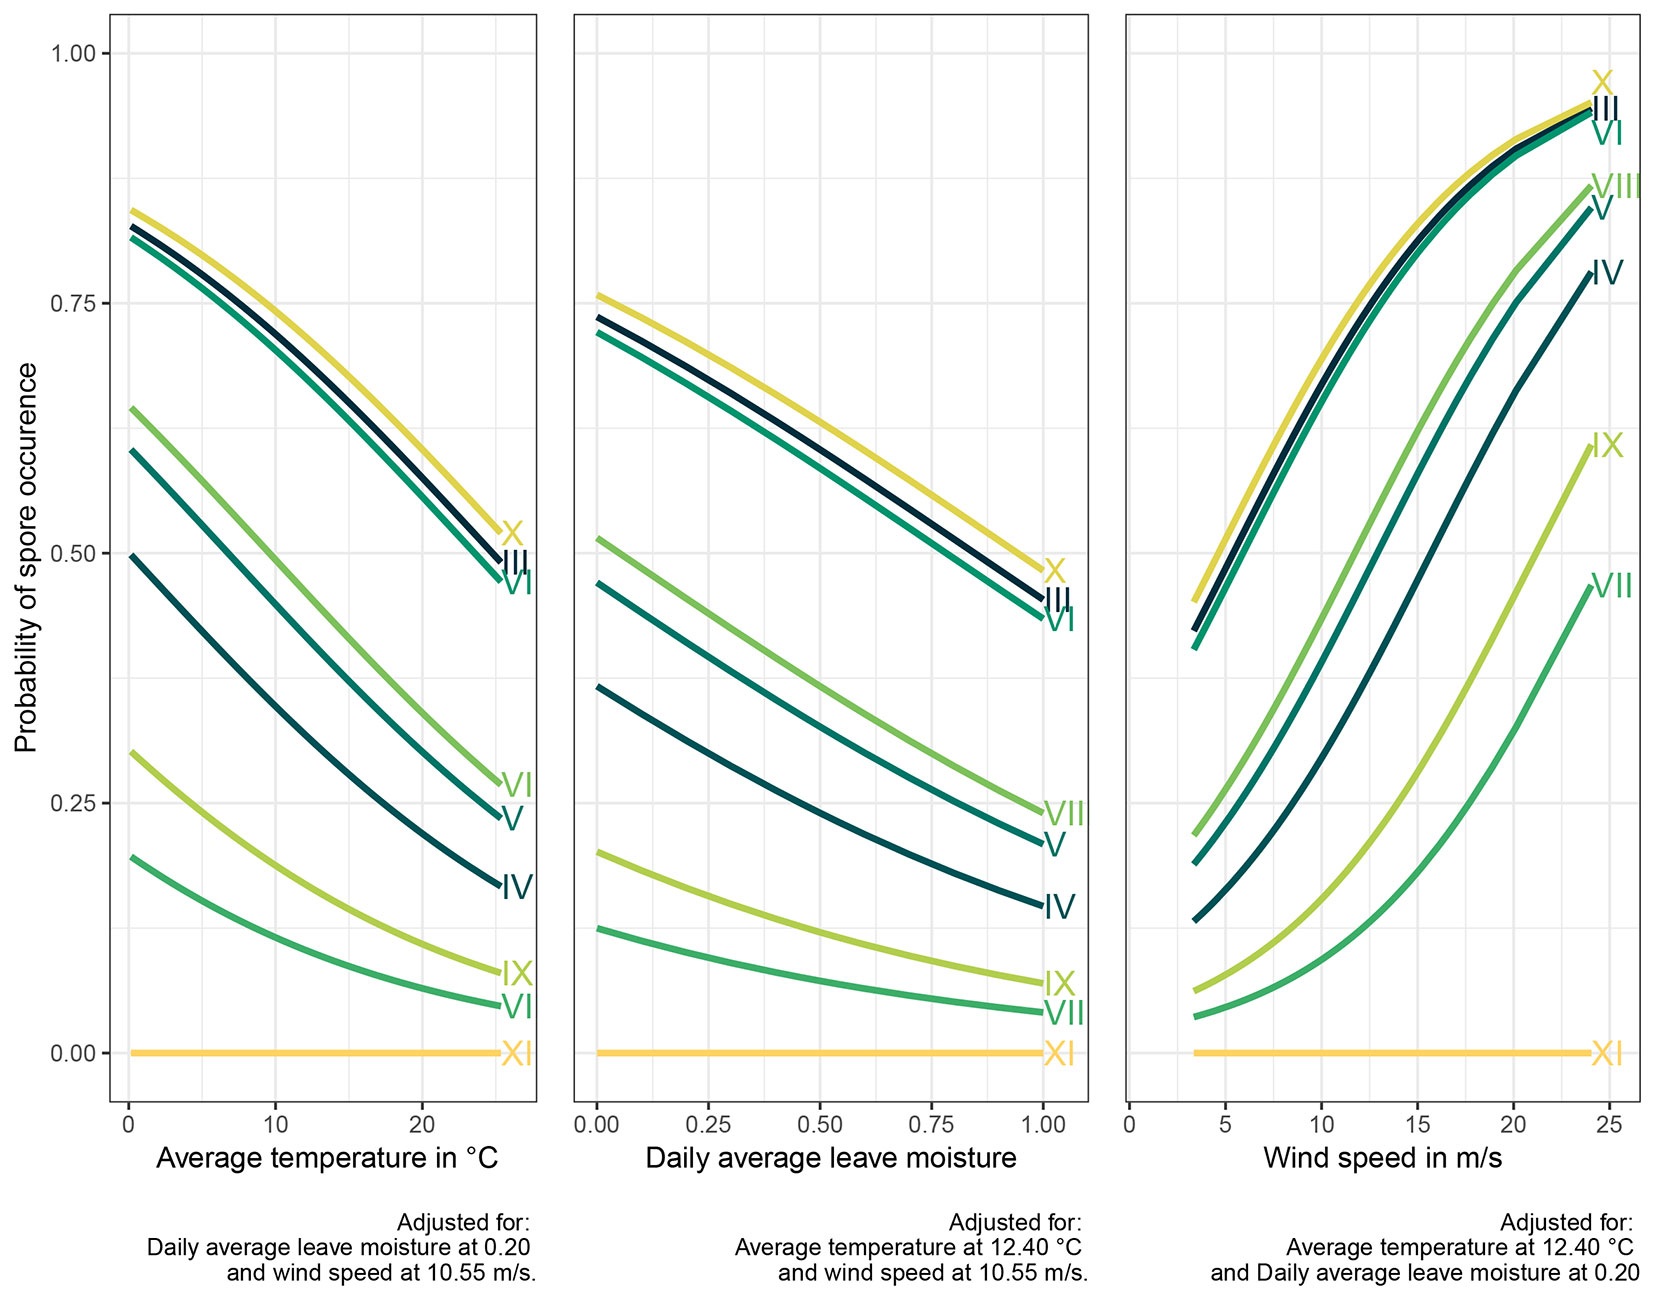
To further elucidate the relationship between spore occurrence and weather conditions, graphs were constructed (Fig. 5) depicting individual predictions of spore occurrence probabilities as a function of each explanatory variable (other variables adjusted to the average level) and the corresponding months of the sampling period. Each curve within each graph represents a predicted probability of spore occurrence for a specific month, denoted by Roman numerals.
Fig. 5 - Spore occurrence probabilities related to three selected meteorological variables in particular months of sampling (marked with Roman numbers). The strongest influence of the wind speed (right panel) on the likelihood of spore occurrence is evident.
Discussion
The results of this work confirm the presence of C. corticale in Czechia, as reported by Koukol et al. ([31]). They dated the current infection wave in the Czech Republic to 2005, following a severe drought in 2003. The data of Koukol et al. ([31]) are limited to the Prague area (Central Bohemia). Still, a recent publication ([37]) has also reported the detection of C. corticale in air samples from Brno (Moravia). The sampling spot with infected trees in this study was located only 4.8 km north of the location sampled in the survey by Muller et al. ([37]). Therefore, it probably served as one of the sources of the detected inoculum.
Sampling for this study was limited to the 2022 vegetation period, which is a limitation for generalizing the conclusions. However, this is the first time a periodic seasonal air sampling was performed in Czechia. The first positive detection of C. corticale in Czech air samples was reported by Muller et al. ([37]). However, they tested only ten samples from June to September 2018, yielding four positive results. One of them was sampled in June, another in August, and the remaining two in September. As found in this study, the cessation of conidial spread by the end of June until the beginning of August is consistent with the results of Muller et al. ([37]).
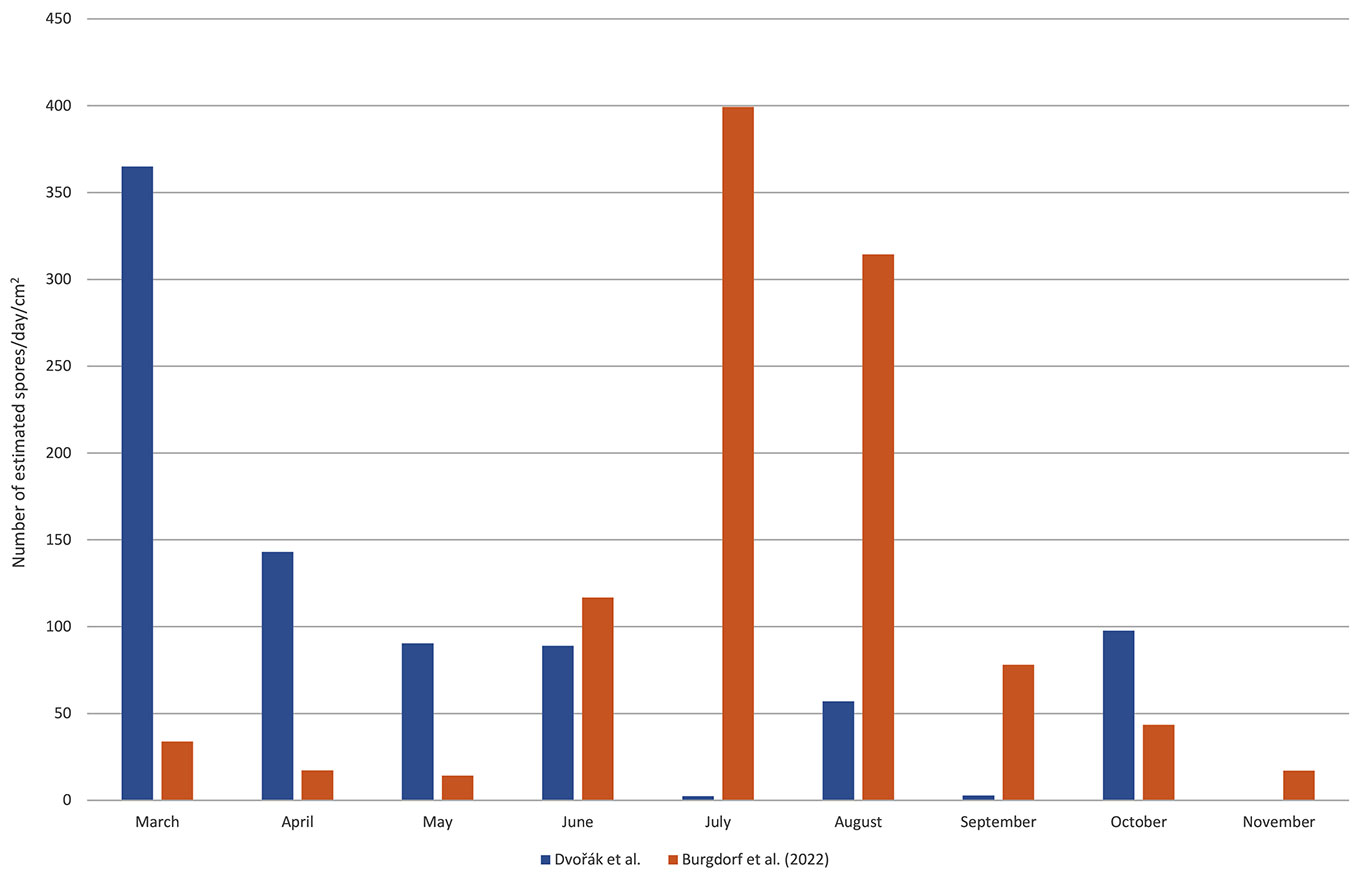
On the contrary, Burgdorf et al. ([8]) investigated airborne C. corticale conidia in Germany (near Würzburg, 474 km to the west from our sampling spot) in 2019, showing the highest concentrations in July and August (Fig. 6). They described their sampling locality as a dry and warm area, and the weather during the sampling season 2019 as above average warm and dry. They concluded that such conditions were favorable for the fungus to sporulate. Our model, however, showed a decreasing probability of spore occurrence with growing air temperature. This trend is also apparent in the graphs (Fig. 5). Therefore, it is possible that the cessation of sporulation in July and the relatively low spore counts recorded in August and September at our locality were caused by higher temperatures of the air compared to Würzburg (June-August mean daily temperature: 21.5-21.6 °C in Brno vs. 20.4-20.9 °C in Würzburg - [8], [12]).
Fig. 6 - Mean spore counts captured per day per cm2. To compare the results of this study with a similar study by Burgdorf et al. ([8]), data of our sampling (estimates of spore counts) were recalculated according to the Melinex tape surface corresponding to each day to obtain average spore counts per day for each month.
Our model did not indicate any importance of precipitation. However, rainfall has a significantly negative effect on the leave moisture values, which partially depends on the rain. The total rainfall June-August measured at our sampling spot was 289 mm, which was several times higher than in Würzburg, where it was only 109 mm ([22]). As the dry weather with low precipitations is considered favorable for sporulation ([8]), this could be another important reason for the cessation of sporulation during the summer months in our locality.
Another possible reason for the aforementioned difference in results could be attributable to different sampling technique. Burgdorf et al. ([8]) sampled with passive, wind-oriented spore traps two meters above the ground. Although these self-made spore traps followed the wind direction very well, capture of such small conidia like C. corticale (4-6 × 3.5-4 µm - [26]) on a sticky surface without active air-intake might be more difficult ([24], [33], [13]). However, it proved to be well-functional and, in the peak period from June to September, exceeded the AVST spore counts per square centimeter per day (Fig. 6). In our case, the AVST was placed at a much lower height (30 cm above the ground) in comparison to Burgdorf et al. ([8]), who sampled at a height of 2 m above the ground. Therefore, the AVST in our study was not sampling the inoculum of C. corticale at higher height. According to a study on the vertical pattern of conidial spread ([8]), it is evident that the abundance of C. corticale conidia changes significantly in the vertical direction throughout the season. The authors described a general increase in spore abundance at higher heights in autumn compared to spring. This phenomenon could partly elucidate the differences in spore concentration dynamics.
On the other hand, the results of Muller et al. ([37]) confirmed our seasonal spore dispersal dynamics. Similarly to our study, they did not detect any C. corticale inoculum in July 2018 in Brno, while the mean temperature in June-August varied between 20.4 and 22.2 °C ([12]), i.e., slightly higher than during the sampling in Würzburg ([8]). Unfortunately, the study by Muller et al. ([37]) is based on limited data for this particular locality, which is insufficient for a comprehensive description of any dynamics. Moreover, the AVST differed significantly in terms of sampling height, which was approximately 25 m (personal communication).
The most influencing meteorological factor identified by our model was wind speed. Higher wind speed leads to a higher probability of spore occurrence, and this supports the indications of Burgdorf et al. ([8]) that turbulent wind in the autumn season may play a role in the increased abundance of spores at higher height. In our locality, the majority of the stromata were found on dead wood near the ground; therefore, the faster wind played a crucial role in releasing the conidia from the stromata, allowing them to escape from the laminar boundary layer of still air and become dispersed in the turbulent air currents ([25]). This finding supports the well-known airborne character of C. corticale propagules ([26], [31], [8]).
The leaf moisture had also a significant effect on the probability of spore occurrence. Although there is no apparent relation between leaves and C. corticale conidia, this factor can be interpreted as the moisture of any surface, as the sensor measures the wetness of a filter paper inserted between electrodes of the climatic station. The key dry or wet surfaces in this study were probably the stromata, and the model showed a negative influence of moisture on the spore incidence. This effect has already been described by other authors ([34], [33]), who proved that wet-dry cycles result in the highest active ejection of ascospores from apothecia of Pyrenopeziza brassicae. A similar phenomenon was described in a phoma stem canker fungus, Leptosphaeria maculans ([47]). Our data does not describe the meteorological dynamics preceding the spore occurrence. Therefore, the stromata were detected as already dry at the moment of spore detection.
Conclusions
In this study, unlike the growth of C. corticale dieback and other SBD symptoms development, the presence of conidia in the air seems to be suppressed by high air temperatures. On the other hand, faster wind strongly supports the probability of inoculum occurrence, as well as the dry surface of stromata. Based on both our results and information from other authors, it is possible to conclude direct practical advice for foresters and especially arborists to decrease the spread of SBD. The risk of C. corticale infection decreases under certain conditions when the concentration of conidia in the air is lower and when there are fewer gateways for the conidia to infect the wounded stems. Therefore, we recommend to: (i) concentrate most of the arboriculture treatment and harvest of endangering maple trees in the autumn and winter time, when the occurrence of spores is minimal (especially up to two meters above the ground) and wounding dormant trees is much less harmful; (ii) avoid cuttings during windy, cold and dry days; (iii) avoid incautious cutting causing excessive damage to bark and uncovering the wood at any time; (iv) wear protective gear, especially a mask to protect workers from the inhalation of spores during cutting of infected trees to avoid maple-bark-stripper’s lung damages.
Authors’ ontribution
MD conceived the study, helped with field sampling and laboratory analyses, and wrote the manuscript; KJ carried out the field sampling and laboratory analyses, and wrote the first draft as her master thesis; MR performed the statistical analyses and contributed to the manuscript.
Acknowledgment
This work has been supported by the European Union’s Horizon 2020 Programme for Research & Innovation under grant agreement no. 771271 (HOMED, “HOlistic Management of Emergent Forest Pests and Diseases”).
We thank Dr. Martin Mullet for the careful language and formal revision of the Abstract and Introduction sections.
References
Gscholar
Gscholar
Gscholar
Gscholar
Gscholar
Gscholar
Gscholar
Gscholar
Gscholar
Gscholar
CrossRef | Gscholar
Gscholar
Gscholar
Gscholar
Authors’ Info
Authors’ Affiliation
Katerina Janovská
Department of Forest Protection and Wildlife Management, Faculty of Forestry and Wood Technology, Mendel University in Brno, Zemedelská 3, 613 00 Brno (Czech Republic)
Department of Genetics and Agricultural Biotechnologies, Faculty of Agriculture and Technology, University of South Bohemia, Studentská 1668, 370 05 Ceské Budejovice (Czech Republic)
Corresponding author
Paper Info
Citation
Dvorák M, Janovská K, Rost M (2025). Seasonal dynamics of Cryptostroma corticale conidial spread. iForest 18: 79-86. - doi: 10.3832/ifor4676-018
Academic Editor
Alberto Santini
Paper history
Received: Jun 27, 2024
Accepted: Feb 03, 2025
First online: Apr 17, 2025
Publication Date: Apr 30, 2025
Publication Time: 2.43 months
Copyright Information
© SISEF - The Italian Society of Silviculture and Forest Ecology 2025
Open Access
This article is distributed under the terms of the Creative Commons Attribution-Non Commercial 4.0 International (https://creativecommons.org/licenses/by-nc/4.0/), which permits unrestricted use, distribution, and reproduction in any medium, provided you give appropriate credit to the original author(s) and the source, provide a link to the Creative Commons license, and indicate if changes were made.

Web Metrics
Breakdown by View Type
Article Usage
Total Article Views: 6295
(from publication date up to now)
Breakdown by View Type
HTML Page Views: 2105
Abstract Page Views: 1875
PDF Downloads: 2091
Citation/Reference Downloads: 1
XML Downloads: 223
Web Metrics
Days since publication: 391
Overall contacts: 6295
Avg. contacts per week: 112.70
Article Citations
Article citations are based on data periodically collected from the Clarivate Web of Science web site
(last update: Mar 2025)
(No citations were found up to date. Please come back later)
Publication Metrics
by Dimensions ©
Articles citing this article
List of the papers citing this article based on CrossRef Cited-by.
Related Contents
iForest Similar Articles
Short Communications
Detection and quantification of the air inoculum of Caliciopsis pinea in a plantation of Pinus radiata in Italy
vol. 12, pp. 193-198 (online: 10 April 2019)
Review Papers
Dutch elm disease and elm bark beetles: a century of association
vol. 8, pp. 126-134 (online: 07 August 2014)
Research Articles
Spread intensity and invasiveness of sycamore maple (Acer pseudoplatanus L.) in Lithuanian forests
vol. 8, pp. 693-699 (online: 19 March 2015)
Review Papers
Genomics of the Dutch elm disease pathosystem: are we there yet?
vol. 8, pp. 149-157 (online: 07 August 2014)
Research Articles
Hygroscopicity of the bark of selected forest tree species
vol. 10, pp. 220-226 (online: 06 November 2016)
Research Articles
Latent infection of Biscogniauxia nummularia in Fagus sylvatica: a possible bioindicator of beech health conditions
vol. 9, pp. 49-54 (online: 18 June 2015)
Review Papers
Avoidance by early flushing: a new perspective on Dutch elm disease research
vol. 2, pp. 143-153 (online: 30 July 2009)
Research Articles
Monitoring of the incidence of Dutch Elm Disease and mortality in experimental plantations of French Ulmus minor clones
vol. 15, pp. 289-298 (online: 29 July 2022)
Research Articles
Effect of stand density on longitudinal variation of wood and bark growth in fast-growing Eucalyptus plantations
vol. 12, pp. 527-532 (online: 12 December 2019)
Research Articles
Real-Time PCR for Ceratocystis platani detection: in-depth validation to assess the diagnostic potential and include additional technical options
vol. 11, pp. 499-509 (online: 18 July 2018)
iForest Database Search
Search By Author
Search By Keyword
Google Scholar Search
Citing Articles
Search By Author
Search By Keywords
PubMed Search
Search By Author
Search By Keyword


