Kinetic, morphophysiological, and biochemical parameters as a strategy to select clones of Eucalyptus spp. more efficient in phosphorus uptake
iForest - Biogeosciences and Forestry, Volume 18, Issue 4, Pages 212-222 (2025)
doi: https://doi.org/10.3832/ifor4643-018
Published: Aug 09, 2025 - Copyright © 2025 SISEF
Research Articles
Abstract
Eucalyptus clones are typically selected based on their rooting capacity, wood quality, and resistance to drought, frost, and disease. However, kinetic, morphophysiological, and biochemical parameters that determine the uptake efficiency of nutrients such as phosphorus (P) are often not considered in breeding programs. This study aimed to select Eucalyptus clones based on P uptake efficiency using kinetic, morphophysiological, and biochemical parameters. The experiment was set up in a 2 × 3 factorial arrangement, the first factor being P levels: 16.5 mg P L-1 (high P) and 4.65 mg P L-1 (low P) in half-strength Hoagland’s nutrient solution, and the second factor being three Eucalyptus spp. clones (E. saligna, E. urograndis, and E. dunnii), with six replications per treatment. Kinetic parameters (Vmax, Km, Cmin and I), as well as morphological parameters in shoots and roots, biomass production, P concentrations in tissues, photosynthetic parameters, chlorophyll a fluorescence, photosynthetic pigments, metabolic enzyme activity and oxidative stress were evaluated. Eucalyptus saligna showed the highest P influx rates and the lowest values of Cmin, while E. urograndis presented the lowest values of Km under low P supply. Both E. saligna and E. urograndis resulted more efficient at phosphorus uptake, indicating P absorption efficiency at low concentrations. Eucalyptus dunnii showed the highest values of Km and Cmin for P, indicating adaptation to environments with greater P availability. Thus, P kinetic parameters could be used in Eucalyptus selection and breeding programs, as they assist in predicting P uptake in environments with different concentrations of this nutrient.
Keywords
Eucalypts Clones, Maximum Uptake Rate (Vmax), Michaelis-Menten Constant (Km), Minimum Concentration (Cmin), P Uptake Efficiency
Introduction
Eucalyptus is the most widely planted genus of hardwood trees around the world ([43]), consisting of about 700 species native to Australia and Indonesia, along with several hybrids developed to exploit different plant characteristics. Fast growth and adaptability to a wide range of tropical and subtropical regions, combined with the versatile properties of wood for energy, lamination, sawmilling, paper, and cellulose, ensure its prominent position in the current forestry landscape ([29]).
Eucalyptus saligna Smith, Eucalyptus dunnii Maiden, and the hybrid E. urograndis are clones grown in forest stands around the world. Both E. dunnii and E. saligna are economically important due to their tolerance to cold and frost, fast growth, and high-quality wood ([27]). Eucalyptus urograndis adapts well to various environmental conditions, exhibiting excellent productivity rates and desirable wood characteristics for multiple industrial purposes ([32]).
Eucalyptus clones used in commercial plantations are usually selected based on wood quality, productivity, rooting capacity, tolerance to drought, cold, frost, pests, and diseases ([27]). However, Eucalyptus trees are typically grown in soils with low natural fertility and high phosphorus (P) adsorption capacity in functional groups of reactive soil particles, such as iron (Fe), aluminum (Al), and manganese (Mn) oxides ([34]). Therefore, applying phosphate fertilizers to soils is necessary to increase P availability, supplying the demand of plants such as the Eucalyptus. Currently, plant production is highly dependent on phosphate fertilizers. It is estimated that approximately 20 million tons of P per year are used worldwide, with a usage of less than 10% ([4]).
For the above reason, it would be desirable to select or develop nutritionally efficient genotypes that can grow and produce even in soils with low fertility ([39], [45]). This approach would decrease the amount of P required in the field, cut down on production costs and reduce the potential risk of soil and water contamination. Moreover, P reserves in the world are limited, and it is estimated that the deposit of phosphate rocks will be depleted in just 50 years ([3]). To this end, the use of genotypes with greater capacity for nutrient uptake may be a viable strategy to enhance the efficiency of fertilizers, allowing a reduction in the doses currently used. Thus, using kinetic patterns of nutrient uptake as criteria for selecting genotypes may be a key method to maximize nutritional efficiency in plantations. Furthermore, such research could help identify genotypes capable of producing in areas with low soil fertility.
Kinetic parameters related to the uptake efficiency of nutrients, such as P, are traditionally not considered in the selection of Eucalyptus clones, though P is the primary nutrient that affects the growth and development of this species. This is because P within the plant is a key component in the synthesis of nucleic acids, proteins, hormones, adenosine monophosphate, activation and deactivation of enzymes, redox reactions, and carbohydrate metabolism ([9]).
The kinetic parameters of nutrient uptake are represented by the maximum uptake rate (Vmax), Michaelis-Menten constant (Km), minimum concentration (Cmin), and influx rate (I) ([33]). Such parameters allow us to predict greater or lesser efficiency of ion (e.g., phosphate) uptake by plant roots at a given concentration in the medium ([5]). Vmax represents the maximum uptake rate of the membrane transporters ([16]), and I refers to the flow or the rate of ion uptake in a solution with a specific concentration (C). Therefore, C refers to the concentration of the ion of interest present in solution at the time of collection ([39]). The constant Cmin is the minimum ion concentration in the kinetic period, and Km refers to the affinity coefficient of the transporter for solute ([16]).
In addition to these parameters, analyzing the morphological characteristics of the root system allows us to correlate the depletion of P forms in the solution with the genetic characteristics of the plant. This is because changes in root morphological characteristics may indicate which plants are better adapted to environments with low nutrient availability ([10], [23]). Physiological and biochemical characteristics can also be important parameters in determining nutritional efficiency, as biomass production and plant growth are directly related to photosynthetic rates, pigment content, and antioxidant defense capacity ([51]).
Kinetic parameters can help to identify plants that are better adapted to different edaphoclimatic conditions ([26]). It is expected that Eucalyptus clones have different phosphate uptake capacities, and this will reflect on nutrient uptake and use efficiency, and consequently on morphophysiological and biochemical responses during growth and production. As a result, the ideal Eucalyptus clone would be one with high I and Vmax as well as low Cmin and Km.
This study aimed to select Eucalyptus clones based on P uptake efficiency using kinetic, morphophysiological and biochemical parameters. Our results may contribute to the selection of Eucalyptus clones with higher nutrient uptake efficiency and to identifying those better adapted to the edaphoclimatic conditions of each region, increasing productivity and reducing fertilization costs.
Material and methods
Study area and plant material
The experiment was conducted in a greenhouse at the Department of Soils of the Federal University of Santa Maria (UFSM), Santa Maria, Rio Grande do Sul, southern Brazil (29° 43′ 07″ S, 53° 42′ 29.5″ W). The average temperature inside the greenhouse was 25 °C, and the relative humidity was approximately 60%.
The Eucalyptus spp. (E. saligna, E. urograndis and E. dunnii) clones used in this study were provided by the CMPC (Celulose Riograndense) company. The rooted minicuttings were produced through vegetative propagation in a clonal minigarden system, following the methodology employed by the company itself. Shortly after collection, the minicuttings were subjected to rooting in the greenhouse. The minicuttings were 12-cm long with two upper buds. The leaves had their leaf area reduced by 50% to preserve the photosynthetic area and reduce transpiration. The rooted minicuttings were cultivated in 55-cm3 polypropylene tubes. The substrate used for rooted minicuttings production was Carolina Soil®, composed of peat, Sphagnum spp., and vermiculite with the addition of 30% carbonized rice husk. Base fertilization was carried out with Osmocote®, a six-month controlled release fertilizer (CRF) composed of 15% N; 9% P2O5; 12% KCl; 1% Mg, 2.3% S; 0.05% Cu; 0.06% Mn; 0.45% Fe, and 0.2% Mo.
The initial characterization of six plants from each Eucalyptus clone was conducted (Tab. 1) on the ninetieth day after rooting. The remaining rooted minicuttings were kept in a greenhouse for seven days to acclimatize. During this period, the rooted minicuttings were irrigated every day until the experiment was set up.
Tab. 1 - Morpho-physiological characterization of Eucalyptus clones 90 days after rooting. (SDW): Shoot dry weight (g plant-1); (RDW): root dry weight (g plant-1); (H): height (cm); (DC): stem diameter (mm); (NF): number of leaves; (Leaf A): leaf area (cm2); (Fv/Fm): maximum quantum yield of PSII.
| Clones | SDW(g plant-1) | RDW(g plant-1) | H (cm) |
DC (mm) |
NF | Leaf A (cm2) |
Fv/Fm |
|---|---|---|---|---|---|---|---|
| E. saligna | 1.08 ± 0.01 | 0.42 ± 0.04 | 24.5 ± 1.4 | 2.65 ± 0.46 | 7 ± 1.4 | 115 ± 7 | 0.794 ± 0.01 |
| E. urograndis | 1.12 ± 0.03 | 0.47 ± 0.01 | 26.5 ± 2.5 | 3.85 ± 0.61 | 11 ± 1.3 | 120 ± 8 | 0.735 ± 0.02 |
| E. dunnii | 1.13 ± 0.01 | 0.38 ± 0.01 | 27.1 ± 3.3 | 2.96 ± 0.41 | 19 ± 4.5 | 110 ± 4 | 0.770 ± 0.01 |
Experimental design
The Eucalyptus rooted minicuttings were removed from the tubes, and the roots were carefully washed to remove the surrounding substrate 98 days after rooting. The roots were then immersed in pots containing 6 L of full-strength Hoagland’s nutrient solution, where they remained for seven days until this first step of acclimatization was complete. The full-strength nutrient solution contained (in mg L-1) NO3-=196; NH4+ = 14; P = 31; K = 234; Ca = 160; Mg = 48.6; S = 70; Fe-EDTA = 5; Cu = 0.02; Zn = 0.15; Mn = 0.5; B = 0.5; and Mo = 0.01.
A sheet of Styrofoam with a hole in the middle was placed on top of each pot, allowing the plant to grow through it. The styrofoam sheet helped plant fixation and reduce evaporation of the solution in each pot. Aeration of the solution in each container was done via PVC microtubes connected to an air compressor. The microtubes were inserted into the solution through the styrofoam sheet in each pot.
The experiment was set up in a completely randomized design. A 2 × 3 factorial scheme was adopted, with the first factor being P levels: 16.5 mg P L-1 (high P) and 4.65 mg P L-1 (low P) in half-strength Hoagland’s nutrient solution, and the second factor being three clones of Eucalyptus spp. (E. saligna, E. urograndis and E. dunnii) with six replications per treatment, totaling 36 experimental units. Each replication consisted of one plant per pot. The P concentrations and the strength levels of the elements present in the nutrient solution were determined through preliminary tests and previous experiments conducted in our laboratory, after reviewing scientific literature and adapting protocols used by the GEPACES research group ([38], [39], [26]).
After seven days of acclimatization in full-strength nutrient solution, the two levels of P (high and low) were added in half-strength nutrient solution, where plants remained for additional 21 days, completing the second acclimatization period. During this period, the solution was renewed every five days and the pH was adjusted to 6.0 ± 0.2 every two days by adding 1 mol L-1 HCl or 1 mol L-1 NaOH.
After the periods of acclimatization, the clones were induced to deplete nutrient reserves in a 0.03 mol L-1 calcium sulfate (CaSO4) solution for 30 days, totaling 58 days of cultivation in a hydroponic system. This solution was used to maintain the electrochemical potential of cell membranes and preserve cell wall integrity ([38]).
Kinetics of net phosphate uptake
After 30 days of depletion of nutrient reserves in CaSO4 (0.03 mol L-1), the clones were transferred to a half-strength Hoagland’s nutrient solution containing 16.5 mg P L-1 (high P) and 4.65 mg P L-1 (low P) along with other nutrients. The clones were kept under these conditions for one hour to simulate plant growth in the soil, which constantly absorb nutrients, following the kinetic model suggested by Claassen & Barber ([12]). The solution was subsequently replaced, maintaining two levels of P and the same nutrient concentration as half-strength Hoagland’s solution, for the collection of aliquots of the solution itself.
The solution was collected for a 72-h period. Fifteen milliliters of solution from each container were collected at time zero (0), when the half-strength Hoagland’s solution was replaced. Then, 15 mL aliquots were collected every six hours during the first 24 hours (0; 6; 12; 18; 24h), every three hours between 24 and 48 hours, and every hour between 48 and 72 hours. The solutions were then frozen at -10 °C and stored for subsequent P analysis. The phosphorus content of the solution aliquots collected during the 72-h period was determined by colorimetry using a UV-visible spectrophotometer (SF325NM, Bel Engineering, Italy), according to the methodology described by Murphy & Riley ([36]).
The kinetic parameters (Vmax and Km) were calculated according to P concentrations in the solution, initial and final solution volumes in pots, and root weight values using the Influxo software. The Cmin was determined based on P concentrations in the nutrient solution during the 72-h evaluation period. Influx rate (I) was calculated (eqn. 1) according to Michaelis-Menten and modified by Nielsen & Barber ([37]):
where Vmax is the maximum uptake rate of membrane transporters, C is the concentration in solution at the time of collection, Cmin is the minimum concentration over the 72 hours, and Km is the coefficient of transporter affinity for solute.
Photosynthetic parameters
After 56 days of cultivation in the hydroponic system, during the period of depletion of internal reserves, we analyzed the physiological parameters of the photosynthetic apparatus of each plant. These analyses took place from 8:00 am to 10:30 am with an infrared gas analyzer (IRGA, Infrared gas analyzer, Mod. Li-COR® 6400 XT). During this time, photosynthetic rate (A), transpiration rate (E), intercellular CO2 concentration (Ci), and water use efficiency (WUE) were determined at an ambient CO2 concentration of 400 μmol mol-1 at 20-25 °C, 50 ± 5% relative humidity and photon flux density of 1500 μmol m-2 s-1.
Chlorophyll a fluorescence
Chlorophyll a fluorescence was also determined after 56 days of cultivation using a portable light-modulated fluorometer (Junior-Pam Chlorophyll Fluorometer, Walz Mess-und-Regeltechnik, Germany). Measurements were taken from fully expanded leaves of each plant on a sunny day between 8:00 am and 10:30 am. Before these measurements, the leaves were dark-adapted for 30 min to determine initial fluorescence (Fo). Subsequently, the leaves were subjected to a saturating light pulse (10.000 µmol m-2 s-1) for 0.6 s to determine maximum fluorescence (Fm). The electron transport rate (ETRm) was determined from the fluorescence induction curve (1.500 mmol m-2 s-1). Lastly, the maximum quantum yield of PSII (Fv/Fm) was calculated as the ratio between variable fluorescence (Fv = Fm- Fo) and maximum fluorescence.
Morphological parameters
Three plants from each treatment were collected for growth analysis, totaling 18 plants. Before the experiment’s installation and at its conclusion, the shoot height and main root length of the plants were measured using a millimeter ruler. Based on these measurements, we calculated root increase (RI - eqn. 2) and height increase (HI - eqn. 3)
where Linit and Lfin are the initial and final length of the main root, respectively, while Hinit and Hfin are the initial and final height of the plants, respectively.
After evaluating the kinetic period of 72 hours, plants were removed from the nutrient solution, separated into shoots and roots and the remaining solution in each pot was measured. Leaf area was determined using WinRhizo Pro® 2013 software (Regent Instrument Inc., Canada) coupled to an EPSON Expression 11000® scanner equipped with additional light (TPU) and a resolution of 200 dpi. The leaf area of each plant was calculated (cm2 plant-1) from the digitized images. Morphological characterization of the root system was performed using images scanned with WinRhizo Pro 2013 software, coupled to an EPSON Expression 11000 scanner, at a resolution of 600 dpi. Digitized images were used to determine values for total root length (cm plant-1), root surface area (cm2 plant-1), root volume (cm3 plant-1), and average root diameter (mm).
The leaves and roots were then dried in a forced air circulation oven (65 ± 1 °C) until constant weight was reached. Subsequently, the samples were weighed on a precision digital scale (0.0001 g) to determine shoot dry weight (SDW), root dry weight (RDW), and total dry weight (TDW = SDW + RDW).
Tissue P analysis
Immediately after weighing, the dry mass of shoots and roots was ground in a Wiley mill and the tissue was passed through a 2 mm sieve. It was then submitted to nitroperchloric digestion ([15]). The P content in the extract was determined by the method of Murphy & Riley ([36]) in a UV-visible spectrophotometer (1105, Bel Photonics) at 880 nm. Phosphorus (P) accumulation in leaves, roots and the total plant was determined based on the P concentration in each organ and the respective biomass. For leaves and roots, the value was obtained by multiplying the P concentration by the corresponding dry biomass. Total P accumulation in the plant was calculated by the sum of the values obtained for leaves and roots.
The following efficiency indices for P were determined ([44]): P absorption efficiency (PAE - eqn. 4), P use efficiency in roots (Root PUE - eqn. 5), in shoots (Shoot PUE - eqn. 6) and the total P use efficiency (Total PUE - eqn. 7):
where Pacc plants is the P accumulation in plants (µg), Pacc roots is the P accumulation in roots (µg); Pacc shoots is the P accumulation in shoots (µg), RDW is the root dry weight (mg), SDW is the shoot dry weight (mg), and TDW is the total dry weight (mg).
Biochemical parameters
After evaluating the 72-h kinetic period, three plants from each treatment were also collected for biochemical analysis, totaling 18 plants. Fresh samples of leaves and roots were frozen (-80 °C) and subsequently macerated with liquid N to determine the biochemical parameters. Chlorophylls a and b and carotenoids were extracted according to the method of Hiscox & Israelstam ([20]). Total chlorophyll was obtained by summing chlorophyll a and chlorophyll b. Guaiacol peroxidase (POD) activity was determined according to Zeraik et al. ([50]) using guaiacol as substrate. Results were expressed in units of enzyme per mg of protein (U mg-1 protein). Superoxide dismutase (SOD) activity was determined using the spectrophotometric method described by Giannopolitis & Ries ([18]). The unit of SOD was defined as the amount of enzyme that inhibits NBT photoreduction by 50% ([6]). Acid phosphatase activity was determined according to the method described by Tabaldi et al. ([46]). The reaction was initiated by adding the substrate (PPi) at a final concentration of 3.0 mM and terminated by adding 200 μL of 10% trichloroacetic acid (TCA) to a final concentration of 5%. Inorganic phosphate (Pi) was quantified at 630 nm, using malachite green as a colorimetric reagent and KH2PO4 as a standard for the calibration curve. Hydrogen peroxide levels were determined according to Loreto & Velikova ([31]) and expressed as μmol g-1 fresh weight. Lipid peroxidation levels were determined by the concentration of malondialdehyde (MDA), following the method by El-Moshaty et al. ([14]) and expressed as nmol of MDA mg-1 of protein.
Statistical analysis
The results of the morphophysiological and biochemical parameters were subjected to homogeneity and normality tests. The data were then processed and analyzed using the R software ([42]). When the effects of treatments were significant, the results of I, Vmax, Km, and Cmin for each Eucalyptus clone were compared using the Tukey test (p<0.05). The difference in P concentrations over 72 hours for each clone was compared by Student’s t-test (p<0.05).
To verify the effects of the treatments on the response parameters, we submitted the data to a multivariate analysis of principal components (PCA) using the “FactoExtra” package ([24]) and the R software ([42]).
Results
Morphological parameters
A significant interaction (p≤0.05) was observed between the factors (P levels × Eucalyptus clones) for shoot and total dry weight, leaf area, main root increase, and average root diameter. This indicates that the combination of the factors influenced the expression of these characteristics (Fig. 1 and Fig. S1d in Supplementary material).
Fig. 1 - Mean values of (a) shoot dry weight (SDW), (b) root dry weight (RDW), (c) total dry weight (TDW), (d) leaf area, (e) shoot height increase (HI), (f) and main root increase (RI) in Eucalyptus clones grown in Hoagland’s nutrient solution with low (green columns) and high (brown columns) P availability after 30 days of depletion of internal reserves. Means followed by lowercase letters differ (p<0.05) between P levels in the Eucalyptus clone after Student’s t-test. Means followed by capital letters differ (p<0.05) between Eucalyptus clones within the P level after the Tukey test. Bars represent mean ± standard deviation.
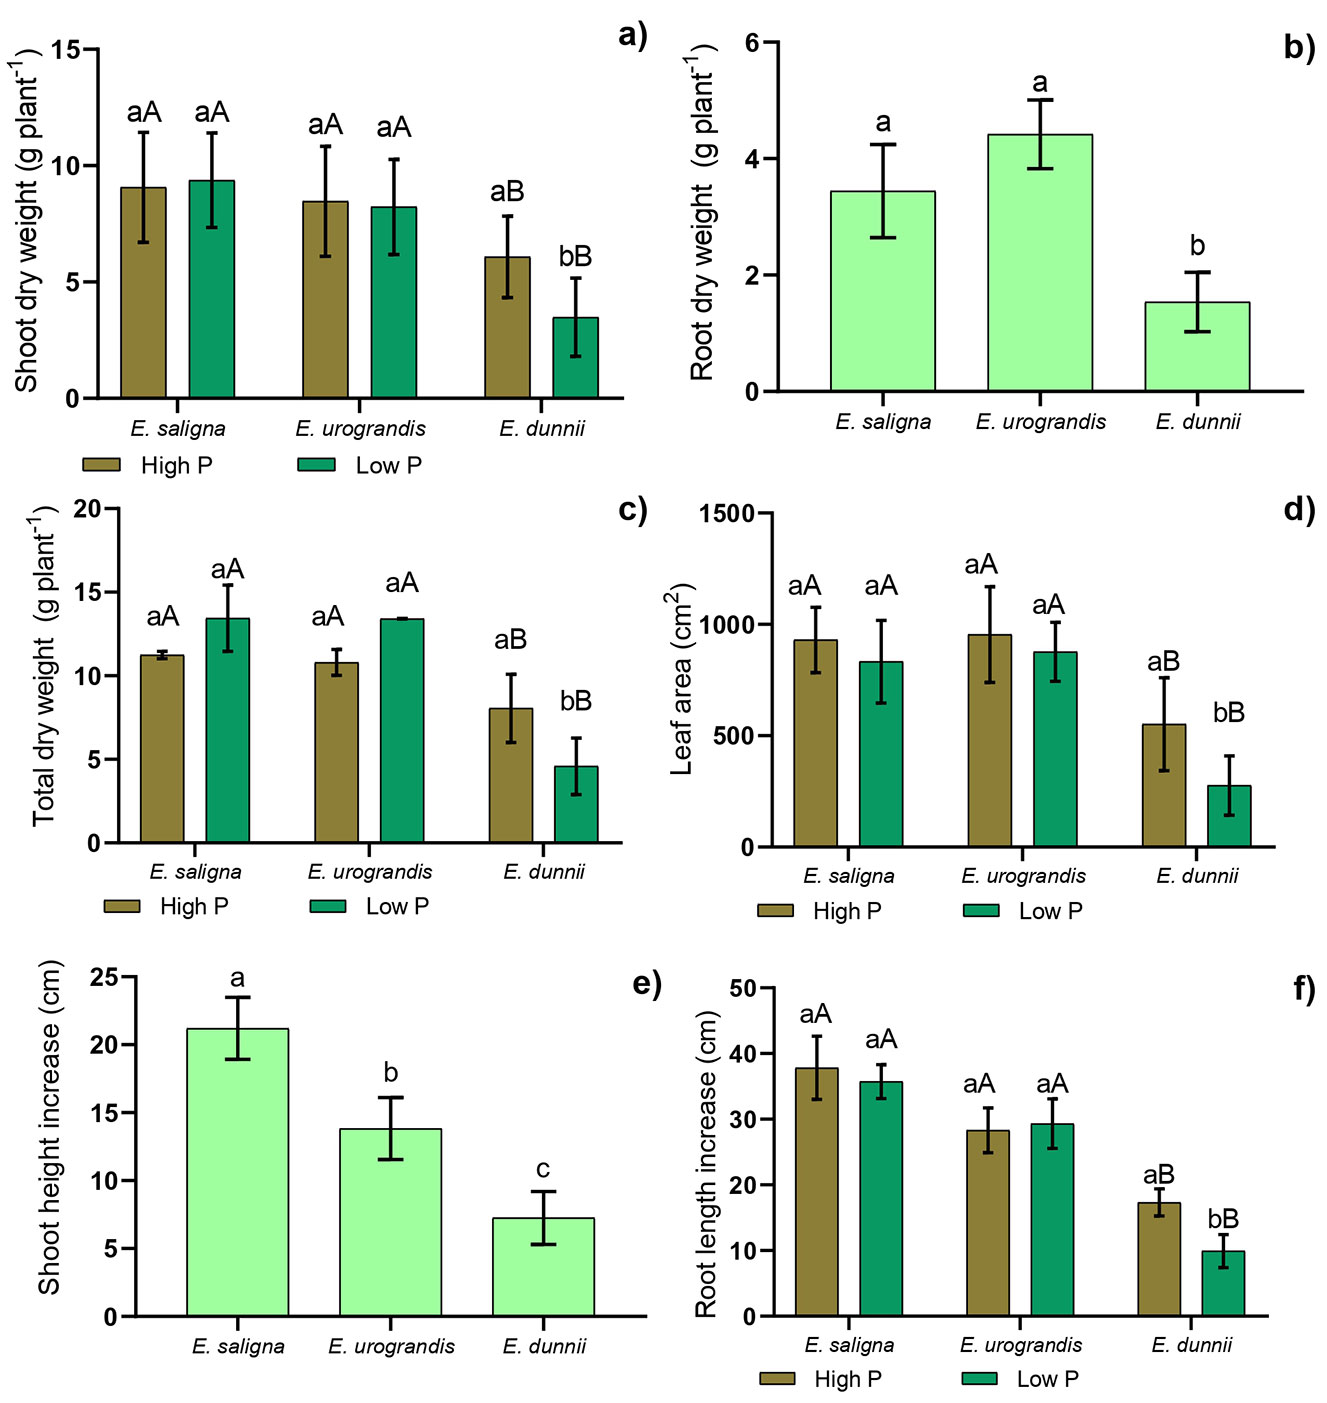
When comparing P levels, we found that E. saligna and E. urograndis showed no significant differences for shoot and total dry weight, leaf area, and main root increase. Still, the lowest values for these parameters were found in E. dunnii under low P (Fig. 1a, Fig. 1c, Fig. 1d, Fig. 1f). Furthermore, we observed that the low P supply promoted a reduction in these parameters for E. dunnii (Fig. 1a, Fig. 1c, Fig. 1d, Fig. 1f).
There was no significant interaction among the clones within each P level for root dry weight, shoot height increase (Fig. 1b and Fig. 11e), root length, root surface area, and root volume (Fig S1a, Fig. S1b and Fig. S1c - see Supplementary material). The lowest values of root dry weight and shoot height increase were observed in E. dunnii, which was significantly different from the other clones under study (Fig. 1b, Fig. 1e). Higher values for root length, surface area, and volume were found in E. urograndis and E. saligna in comparison to E. dunnii (Fig S1a, Fig. S1b and Fig. S1c - see Supplementary material). Comparing the clones within each P level, we found that E. dunnii had the lowest average root diameter under high P (Fig. S1d).
Physiological parameters
A significant difference (p≤0.05) among the Eucalyptus clones was observed for photosynthetic rate (A), transpiration rate (E), intercellular CO2 concentration (Ci), and water use efficiency (WUE) (Fig. S2 in Supplementary material). The lowest values of A, E, and Ci were found in E. dunnii, which was considerably different from the other clones (Fig. S2a, Fig. S2b, Fig. S2c). However, the highest water use efficiency (WUE) was found in E. dunnii, corresponding to increases of 42% and 61.55% compared to E. urograndis and E. saligna, respectively (Fig. S2d in Supplementary material).
When comparing the clones within each P level, we found that E. dunnii exhibited the highest values of initial fluorescence (Fo) and maximum fluorescence (Fm) under both high and low P, similar to E. urograndis under low P (Fig. 2a, Fig. 2b). When comparing the clones within each P treatment, we observed that E. dunnii showed the lowest values of electron transport rate (ETRm) under low and high P supply, but did not differ from E. saligna under high P and E. urograndis under low P (Fig. 2c). Also, the highest ETRm values were observed in E. saligna under low P and in E. urograndis under high P (Fig. 2c).
Fig. 2 - Mean values of (a) initial fluorescence (Fo), (b) maximum fluorescence (Fm), (c) electron transport rate (ETRm), (d) maximum quantum yield of PSII (Fv/Fm), (e) total chlorophyll, and (f) carotenoids in Eucalyptus clones grown in Hoagland’s nutrient solution with low and high P availability after 30 days of depletion of internal reserves. Means followed by lowercase letters differ (p<0.05) between P levels in the Eucalyptus clone after Student’s t-test. Means followed by capital letters differ (p<0.05) between Eucalyptus clones within the P level after Tukey test. Bars represent mean ± standard deviation.
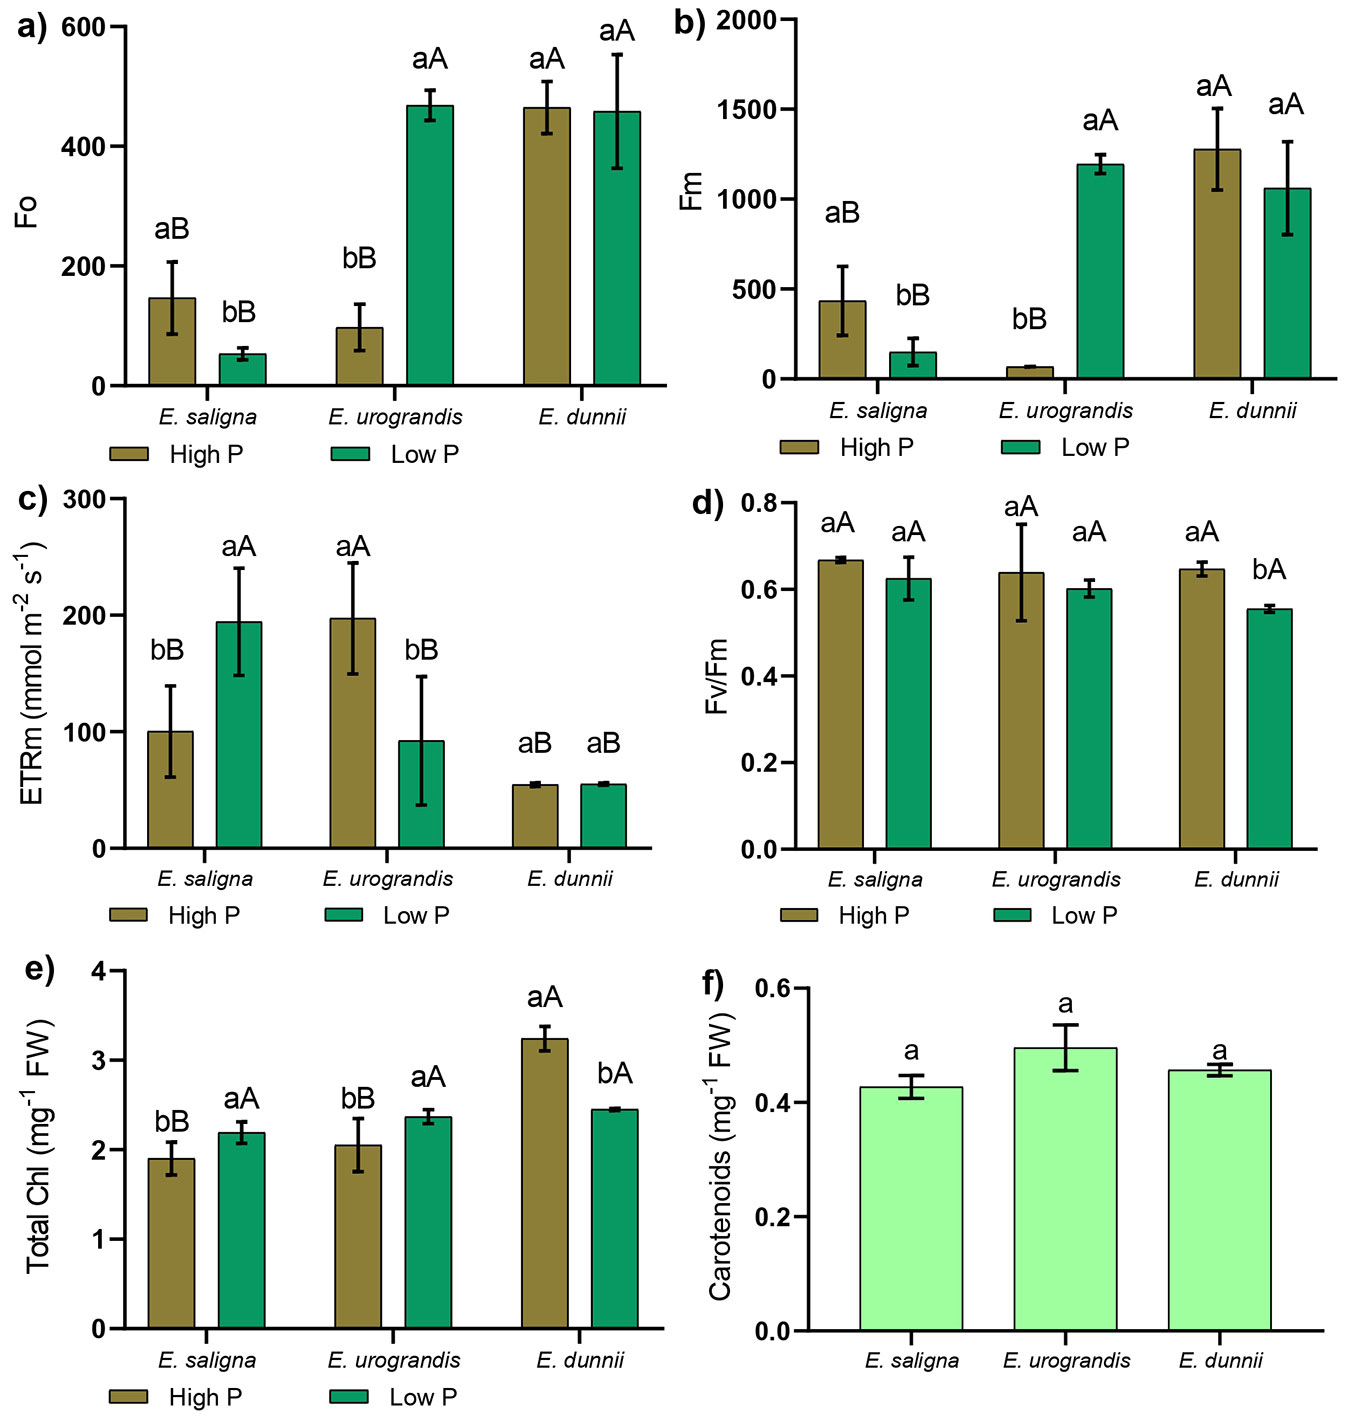
There was no significant interaction between Eucalyptus clones and P levels for maximum quantum yield of photosystem II (Fv/Fm - Fig. 2d). However, a reduction of 14.38% in Fv/Fm was observed in E. dunnii under low P, compared to this clone under high P (Fig. 2d). Low P supply also promoted a 13.25% increase in total chlorophyll for E. saligna and 13.14% for E. urograndis, while causing a 24.39% decrease in total chlorophyll for E. dunnii (Fig. 2e). Lastly, there was no significant difference between Eucalyptus clones and P levels for carotenoid content (Fig. 2f).
Biochemical parameters, tissue P, and kinetic parameters related to P uptake
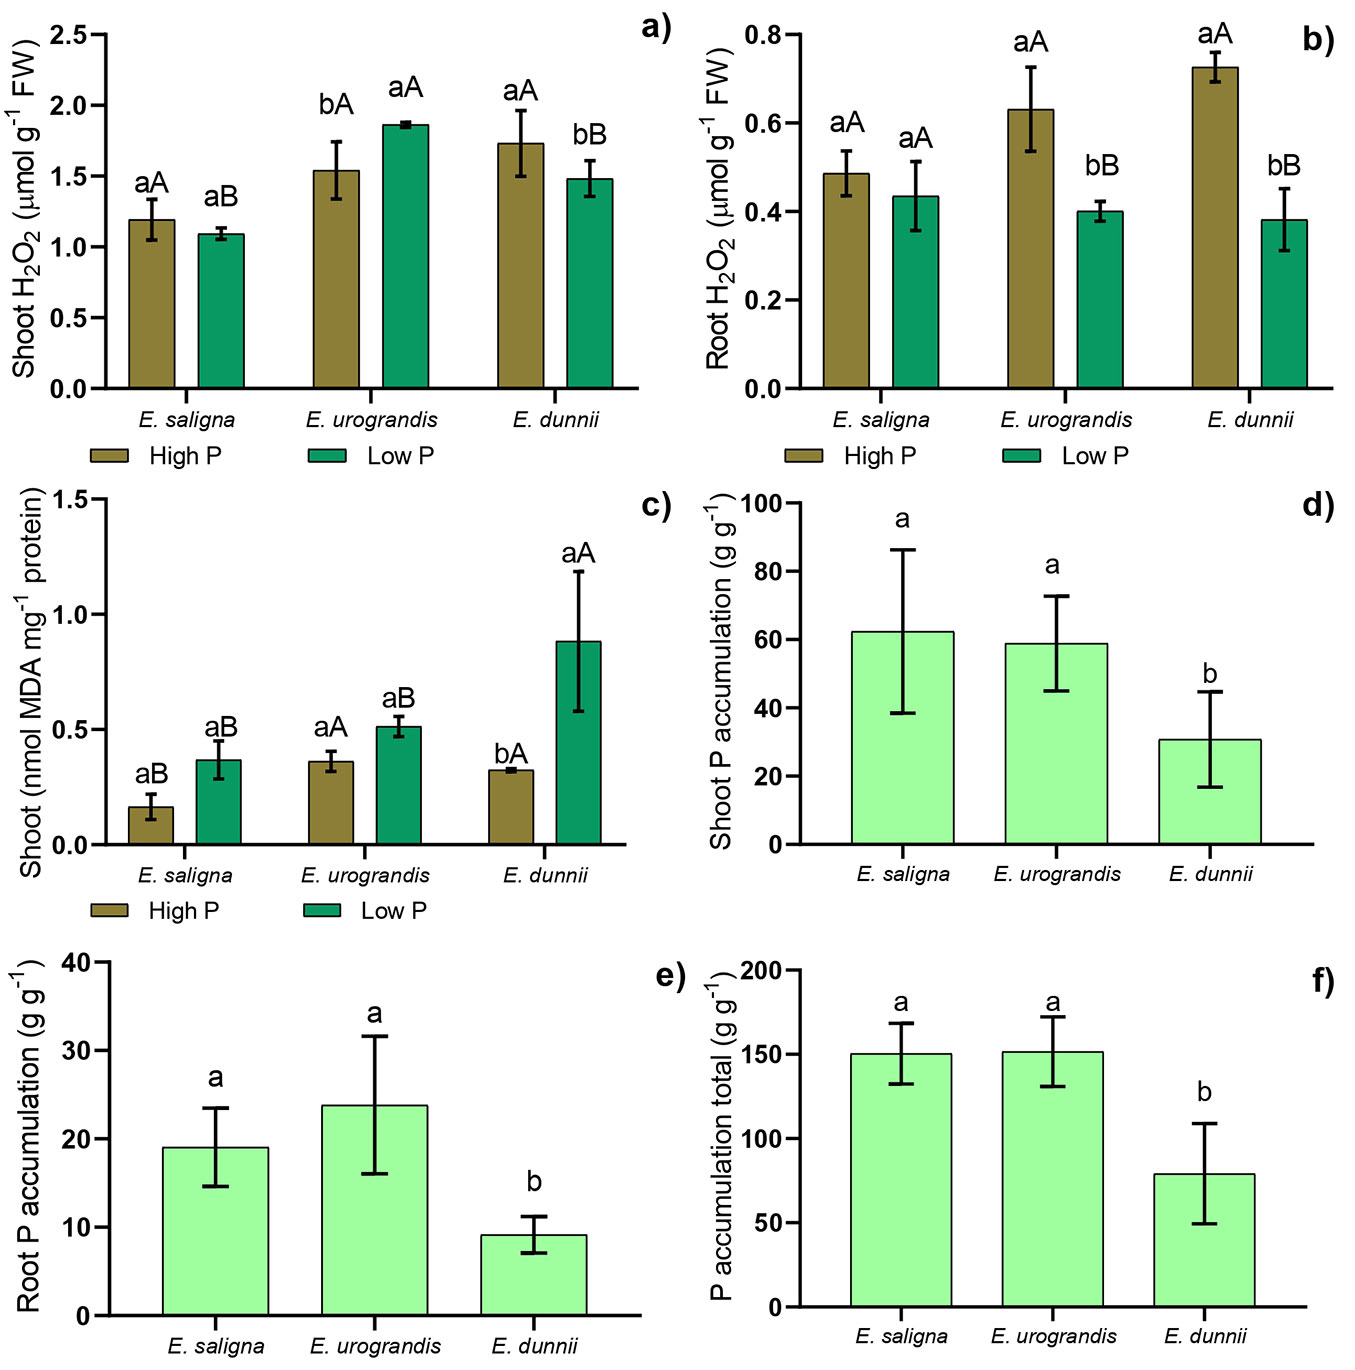
There was a significant effect (p≤0.05) of the interaction between the factors (P levels × Eucalyptus clones) for the biochemical parameters (Fig. 3), except for root membrane lipid peroxidation (data not shown).
Fig. 3 - Mean values recorded for hydrogen peroxide (H2O2) concentration in shoots (a) and roots (b), membrane lipid peroxidation in shoots (c), P accumulation in shoots (d) and in roots (e) and total P accumulation (f) in Eucalyptus clones grown in Hoagland’s nutrient solution with low and high P availability after 30 days of depletion of internal reserves. Means followed by lowercase letters significantly differ (p<0.05) between P levels within the Eucalyptus clone after Student’s t-test. Means followed by capital letters significantly differ (p<0.05) between Eucalyptus clones within the same P level after Tukey test. Bars represent mean ± standard deviation.
When comparing P treatments, E. saligna and E. dunnii showed higher superoxide dismutase (SOD) and peroxidase (POD) activity in shoots under low P (Fig. S3a, Fig. S3c - see Supplementary material). However, there was no significant difference between P levels for SOD and POD activity in shoots of E. urograndis.
On the other hand, there was a reduction in SOD and POD activity in roots of E. urograndis under low P (Fig. S3b, Fig. S3d). Low P supply increased acid phosphatase activity in shoots and roots of E. dunnii and in shoots of E. urograndis (Fig. S3e, Fig. S3f). However, there was a decrease in acid phosphatase activity in shoots of E. saligna under low P (Fig. S3e in Supplementary material).
E. saligna showed the highest APase activity in shoots and roots under high P. The lowest APase activity in roots was found in E. urograndis under low P, while E. dunnii showed the highest APase activity in roots under low P (Fig. S3e, Fig. S3f).
The highest level of hydrogen peroxide (H2O2) was found in shoots of E. urograndis under low P. Low P supply promoted a decrease in H2O2 in shoots and roots of E. dunnii and in roots of E. urograndis (Fig. 3a, Fig. 3b). Furthermore, the highest value of lipid peroxidation was observed in shoots of E. dunnii under low P (Fig. 3c). Hydrogen peroxide levels among clones within each P treatment were higher in shoots of E. urograndis and in roots of E. saligna under low P. Furthermore, the highest values of MDA in shoots were found in E. dunnii under low P (Fig. 3c), while higher values were observed in E. urograndis and E. dunnii under high P (Fig. 3c).
The lowest P accumulation values in shoots, roots, and total accumulation were found in E. dunnii (Fig. 3a, Fig. 3b, Fig. 3c). It also showed the lowest values of P absorption efficiency (PAE), P use efficiency in roots (PUEroot), in shoots (PUEshoot), and total P use efficiency (PUEtotal - Fig. S4 in Supplementary material). Furthermore, there was no significant interaction among the clones within each P level for these parameters.
The comparison of clone performances within each P treatment revealed that E. saligna had the highest value of Vmax under low P and E. dunnii showed the highest value of Vmax under high P and low P (Fig. 4a). Furthermore, the highest values of Km and Cmin were found in E. dunnii under both P levels, while E. urograndis showed the highest Cmin under low P (Fig. 4a).
Fig. 4 - Influx rates and phosphate uptake kinetic parameters in Eucalyptus clones grown in Hoagland’s nutrient solution with low (a) and high (b) P availability after 30 days of depletion of internal reserves. Means followed by lowercase letters are significantly different (p<0.05) between P levels in the Eucalyptus clone after Student’s t-test. Means followed by capital letters significantly differ (p<0.05) between Eucalyptus clones within the P level after Tukey test.
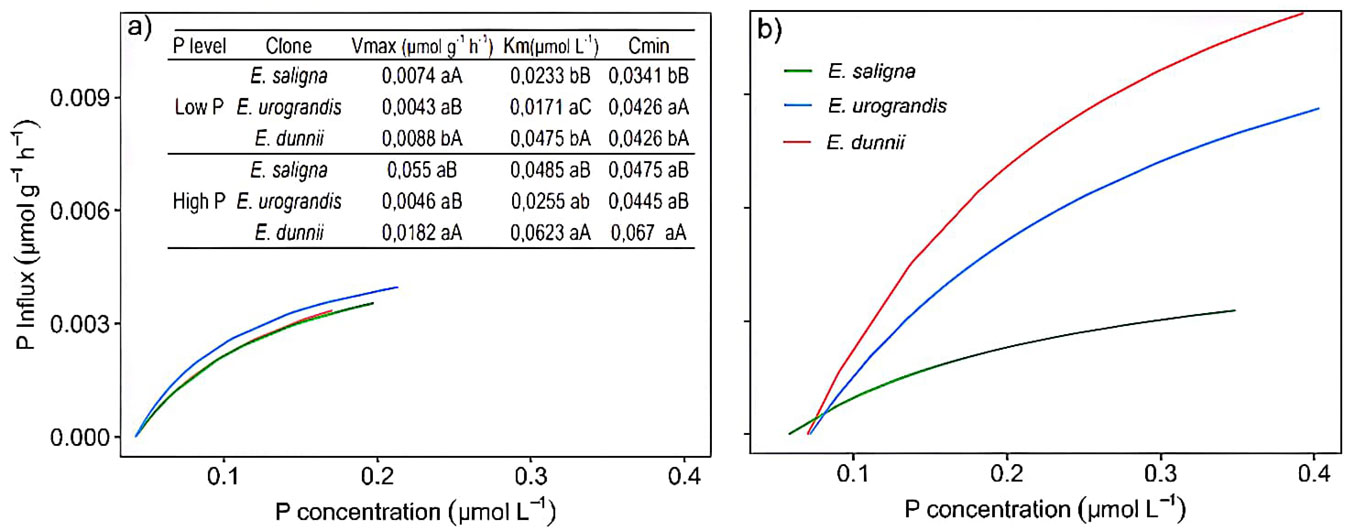
The lowest Vmax was observed in E. dunnii under low P (Fig. 4a). However, the highest Cmin was found in E. dunnii under high P. The highest Cmin in E. urograndis was observed under low P (Fig. 4a). Low P supply caused a decrease in Vmax for E. dunnii (Fig. 4a). However, there was a reduction in Km and Cmin for E. saligna and E. dunnii under low P. Hence, differences in phosphate absorption among the clones were observed through phosphate uptake kinetics, as shown by the influx curve (Fig. 4a, Fig. 4b). Eucalyptus saligna initiated phosphate uptake even under low P concentration, resulting in lower Cmin values compared to E. dunnii and E. urograndis (Fig. 4a, Fig. 4b).
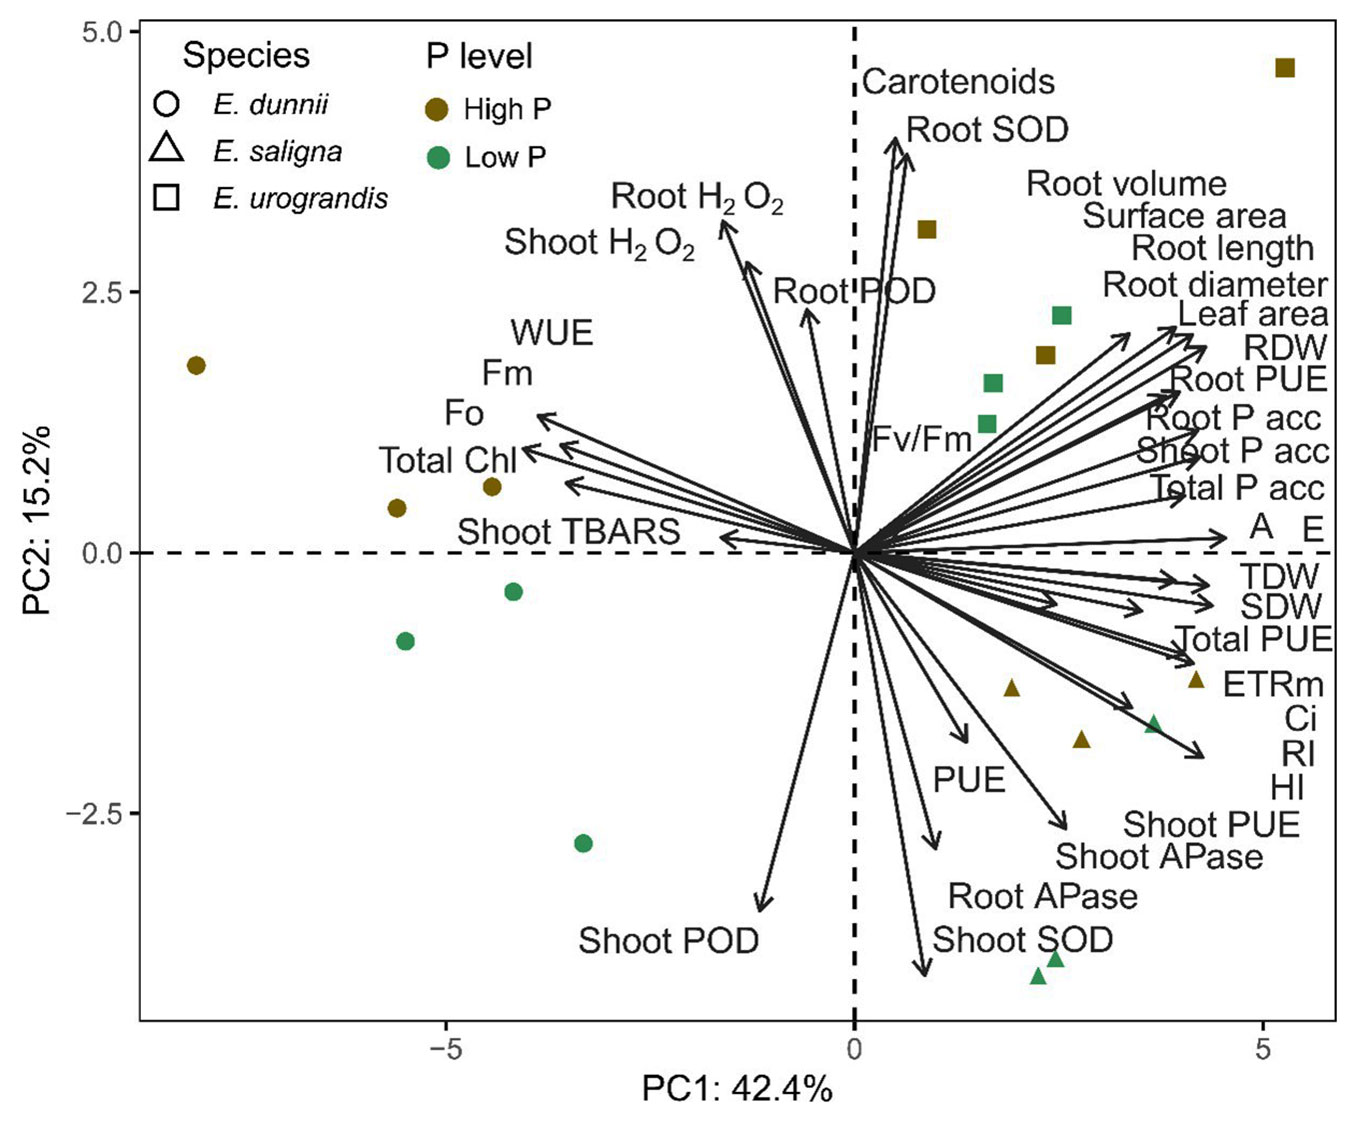
Relationships among parameters
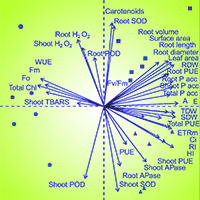
Principal component analysis (PCA) was performed based on the response parameters (Fig. 5). The sum of the first two components explained 57.6% of the data variability, with PC1 and PC2 accounting for 42.4% and 15.2%, respectively. PCA allowed us to analyze the behavior of Eucalyptus species under both P levels, revealing the existence of two groups: (i) E. saligna and E. urograndis; and (ii) E. dunnii. The first group (i) was primarily affected by the following response parameters: increase in shoot height (HI), increase in main root (RI), leaf area, total dry weight (TDW), shoot dry weight (SDW) and root dry weight (RDW), root surface area, root volume, root diameter, root length, P accumulation in shoots (Shoot Pacc), roots (Root Pacc) and total accumulation (Total Pacc), P aborption efficiency (PAE), P use efficiency in shoots (PUEshoot), roots (PUEroot) and total use efficiency (PUEtotal), net photosynthetic rate (A), intercellular CO2 concentration (Ci), transpiration rate (E), electron transport rate (ETRm), maximum quantum yield of PSII (Fv/Fm), carotenoids (Carot), SOD in shoots (Shoot SOD) and in roots (Root SOD), and acid phosphatase in shoots (Shoot APase) and roots (Root APase). The second group (ii) was influenced by response parameters: initial (Fo) and maximum fluorescence (Fm), hydrogen peroxide levels in shoots (Shoot H2O2) and in roots (Root H2O2), MDA concentration in shoots (Shoot TBARS), POD in shoots (Shoot POD) and in roots (Root POD), water use efficiency (WUE) and total chlorophyll (Total Chl).
Fig. 5 - PCA biplot of the first two principal components (PC1, PC2) and the variable loadings on axes (arrows) in Eucalyptus clones grown in Hoagland nutrient solution with low and high P availability after 30 days of reduced internal nutrient reserves. Morphological parameters: height increase (HI), main root increase (RI), leaf area, total dry weight (TDW), shoot dry weight (SDW) and root dry weight (RDW). Root morphological parameters: root surface area, volume, diameter and length). Nutritional parameters: P accumulation in shoots (Shoot P acc), roots (Root P acc) and total P accumulation (Total P acc). Efficiency parameters: P absorption efficiency (PAE), P use efficiency in shoots (Shoot PUE), roots (Root PUE) and total P use efficiency (Total PUE). Physiological parameters: net photosynthetic rate (A), water use efficiency (WUE), intercellular CO2 concentration (Ci), transpiration rate (E), electron transport rate (ETRm), maximum quantum yield of PSII (Fv/Fm), initial fluorescence (Fo) and maximum fluorescence (Fm), concentration of total chlorophyll (Total Chl), carotenoids (Carot), SOD in shoots (Shoot SOD) and roots (Root SOD), POD in shoots (Shoot POD) and roots (Root POD), hydrogen peroxide concentration in shoots (Shoot H2O2) and roots (Root H2O2), MDA concentration in shoots (Shoot TBARS) and acid phosphatase activity in shoots (Shoot APase) and roots (Root APase).
Discussion
Morphological parameters
The studied clones of E. saligna and E. urograndis showed higher values of increase in height, dry matter production, leaf area, and P accumulation in shoots compared to E. dunnii (Fig. 1, Fig. S3d in Supplementary material), demonstrating different growth rates among the clones. This may have occurred due to the intense cell division and elongation that take place during vegetative growth, promoting an increase in dry matter, as well as the absorption and accumulation of nutrients such as P ([21]). It is also noteworthy that the higher shoot dry matter production is an indication that plants had greater leaf area and, therefore, increased interception of sunlight, increasing C fixation, as well as total dry weight and height ([27]). These growth differences among Eucalyptus clones can also be confirmed in the field, since E. saligna and E. urograndis grow faster than E. dunnii in eucalyptus plantations.
The lowest values of shoot and root dry weight and the highest average root diameter in low P supply, along with a reduced P accumulation in shoot and root tissues, were observed in E. dunnii (Fig. 1, Fig. S1, fig. S3). This may be due to its lower efficiency in P uptake and use (Fig. S4), which reduces the translocation of P to growing organs, thereby resulting in reduced height and dry matter production ([28]). On the other hand, higher values of root dry weight, length, surface area, and volume were found in E. saligna and E. urograndis in comparison to E. dunnii, resulting in increased P uptake (Fig. 1, Fig. S1, Fig. S3). This response occurs because larger root systems allow for exploring higher volumes of soil, thus increasing the probability of absorption of relatively immobile nutrients such as P ([41]).
Nonetheless, the low supply of P led to an increase in the average root diameter of E. dunnii (Fig. S1d in Supplementary material). Root diameter expresses the volume of soil penetrated by the roots per unit of invested photosynthate. Thus, the roots of E. dunnii absorbed P less effectively (Fig. S4), as thick roots are shorter and therefore explore a smaller volume of soil per unit area of root surface, resulting in lower P uptake. This is because for every unit of biomass invested in the root, the development of thick roots provides less surface area in contact with the soil, compared to several thinner roots. Subsequently, this causes reduced growth and root dry matter production ([8]).
Kinetic parameters of P uptake
The clone E. saligna showed the highest rates of P influx and lower values of Cmin, while E. urograndis presented the lowest values of Km under low P supply (Fig. 4). The Cmin results suggest that E. saligna has P transport proteins that are activated in lower P concentrations in the solution. In contrast, the low Km values of E. urograndis indicate a high affinity for P at the absorption sites. The greater root length, surface area, and volume found in E. saligna (Fig. S1 in Supplementary material) may have contributed to the larger number of P transport proteins, resulting in increased P uptake efficiency ([28]).
The lower Cmin values suggest that E. saligna has a greater capacity for P uptake even in environments (solution or soil) with small concentrations of the nutrient, and it can access P through a higher number of absorption sites per root unit in different environments ([30]) compared to E. dunnii (Fig. 4). Thus, E. saligna can be grown in solution or in soils with lower P availability. These results also make it possible to reduce the amount and frequency of phosphate fertilizer applications in Eucalyptus plantations cultivated with this clone, leading to decreasing phosphorus usage in the soil. This is also desirable because phosphate fertilizers are mainly produced from phosphate rock, a finite and non-renewable resource ([3]).
Phosphate uptake kinetics highlighted clear differences in P uptake among the clones, as showed by the influx curve (Fig. 4b). The clone of E. saligna initiated P uptake in solution even under low concentrations, consequently resulting in lower Cmin values compared to E. dunnii and E. urograndis (Fig. 4). This suggests that different Eucalyptus clones absorb P through different transport systems ([40]). For instance, E. saligna possibly activates a high-affinity system (HATS), while E. dunnii a low-affinity system (LATS), each mediated by more than one membrane protein with different enzyme kinetics ([49]). On the other hand, the lowest Vmax values observed in E. dunnii (Fig. 4) suggest that it can activate a low-affinity P transport system, resulting in higher Km and Cmin ([41]). Thus, the results showed that Eucalyptus clones differ in P uptake efficiency, based on the genetic characteristics of each clone.
The transport of P from the rhizosphere to the different plant tissues mainly involves multiple phosphate transporters (PHTs) belonging to subfamilies PHT1, PHT2, PHT3, or PHT4 located in the plasma membrane, plastid inner membrane, mitochondrial inner membrane, and Golgi compartment, respectively ([47]). Under stress conditions of P starvation, the PHT1 gene is strongly induced, increasing the root’s ability to acquire P from soils and remobilize it within plants ([30]). Studies conducted with rice (Oryza sativa) and Arabidopsis thaliana suggest that the PHT1 family genes play a role in remobilizing phosphorus (P) from senescent tissues and/or reserves to tissues in active development, and subsequently in plant development ([40]). Phosphate transporters and transporter-like proteins function as phosphate sensors to regulate the expression of phosphate transporters, thereby maintaining phosphate homeostasis and optimizing nutrient and mineral utilization.
Physiological parameters
The higher values of photosynthetic rate found in E. saligna and E. urograndis clones differed significantly from those recorded in E. dunnii (Fig. S2a in Supplementary material). This is likely due to the increased transpiration rate in these clones, resulting in a greater water gradient between the solution and the plant, which stimulated P uptake and use efficiency, along with a higher leaf photosynthetic rate ([48], [27]). However, the lower values of photosynthetic rates in E. dunnii possibly occurred because of lower P accumulation in shoots (Fig. S2a, Fig. 3c). Indeed, with low Pi availability in the stroma, photophosphorylation of ADP is impaired, resulting in a decrease in ATP synthesis and limited regeneration of ribulose 1.5-bisphosphate (RuBP - [19]). The lowest transpiration rate values were also observed in the studied clones of E. dunnii (Fig. S2c). This may have occurred because plants with higher CO2 levels in the leaf intercellular spaces close their stomata more frequently, reducing transpiration and increasing water use efficiency (WUE), as shown in our study (Fig. S2c, Fig. S2d). On the other hand, the lowest values found in E. dunnii contributed to reduced P uptake, resulting in a decrease in plant growth, as confirmed by the reduced height and lower dry matter production. Thus, the lowest values of photosynthetic parameters observed in E. dunnii (Fig. S2) possibly happened because of the low P accumulation in shoot tissues (Fig. 3d), which promotes changes in the composition of thylakoid membranes and photosynthetic pigments, or by the prevention of electron flow in the photochemical phase of photosynthesis ([17]).
The lowest values of initial fluorescence (Fo) and maximum fluorescence (Fm) in E. saligna under low P supply (Fig. 2a, Fig. 2b) demonstrated that plants showed little damage to the reaction center of photosystem II (PSII) and high excitation energy transfer from the light collecting system to the reaction center under this condition ([7]). With lower energy loss, the plants showed higher values of electron transport rate (ETRm) and growth (Fig. 2c, Fig. 1). This process occurs because energy dissipation leads to a decrease in fluorescence values, which in turn results in an increased formation of ATP and NADPH during the light reactions and carbon assimilation. Additionally, the higher Fv/Fm values in E. saligna and E. urograndis (Fig. 2d) also indicate that most light energy is utilized in the photochemical phase of photosynthesis, rather than being lost by chlorophyll a fluorescence ([26]). Thus, the increased growth and dry matter production in clones of E. saligna and E. urograndis corroborate the Fv/Fm results of PSII (Fig. 1, Fig. 2d).
On the other hand, the reduction in Fv/Fm found in the plants of E. dunnii under low P supply was due to the decrease in total chlorophylls in shoots (Fig. 2d, Fig. 2e). Lower pigment contents result in less absorption and light capture in different regions of the spectrum in the initial stages of the photosynthetic process ([22]). As a result, there is a decrease in the transfer of resonance energy from the antenna complexes to the reaction centers, thereby reducing the amount of energy available for the photochemical reactions responsible for biomass production ([7]).
Carotenoid levels were not negatively influenced by P deficiency (Fig. 2f). This is noteworthy, as carotenoids not only function as antenna pigments for light absorption but also act as photoprotective pigments in the photosynthetic system. They protect chlorophyll by preventing the formation of singlet oxygen, a reactive oxygen species (ROS). They are non-enzymatic antioxidants suppressing ROS and free radicals ([34]).
Biochemical parameters and tissue P
Reactive oxygen species (ROS), such as H2O2 and OH•- and O2•- radicals, are naturally formed within cells, particularly in chloroplasts and mitochondria, as a result of electron transport and cellular respiration, respectively ([1]). However, ROS production is significantly increased under conditions of low P supply ([17]). The activation of the enzymatic antioxidant system in response to ROS formation is a common strategy employed by plants exposed to P deficiency ([9]). Superoxide dismutase (SOD) and guaiacol peroxidase (POD) are considered the main enzymes involved in eliminating ROS and maintaining homeostasis in plant cells ([2]).
We found E. saligna and E. dunnii showed higher SOD and POD activity in shoots under low P (Fig. S3a, Fig. S3c). The increase in SOD activity suggests its potential use in mitigating oxidative damage, as SOD converts the superoxide anion (O2•-) into hydrogen peroxide (H2O2), which is often correlated with increased plant tolerance. Hydrogen peroxide is a ROS that, when accumulated at high levels in cells, can cause damage to cellular components or participate in reactions with the formation of ROS that are more harmful to cells (e.g., hydroxyl radical - [35]).
Guaiacol peroxidase participates in the conversion of H2O2 into water and oxygen through H2O2 dissociation, playing a crucial role in making plants tolerant to unfavorable conditions ([2]). The increase in POD activity in shoots of E. saligna and E. dunnii under lower P supply (Fig. S3c in Supplementary material) suggests that the ability to detoxify ROS is being upregulated, resulting in lower H2O2 values (Fig. 3). However, we observed that low P supply promoted a reduction in SOD in roots of E. urograndis (Fig. S3b). Consequently, low P supply did not influence the release of H2O2, and thus POD was also reduced, as the H2O2 levels were not high (Fig. 3, Fig. S3).
Even with the reduction of H2O2 levels in the E. dunnii clone, an increase in malondialdehyde (MDA) levels was observed in shoots (Fig. 3). This increase in membrane lipid peroxidation is related to the increase in other possible ROS produced by P stress, promoting an increase in MDA levels. Malondialdehyde is an oxidized product of membrane lipids and accumulates when plants are exposed to oxidative stress ([1]). Thus, the increase in MDA in E. dunnii under conditions of low P supply indicated oxidative stress in these plants (Fig. 3). As a result, it decreased P uptake and use efficiency, resulting in a lower photosynthetic rate and, consequently, a smaller increase in height and dry matter production.
There was no significant difference in lipid peroxidation levels in roots (data not shown). We found that the parameters related to oxidative stress were generally less affected in the roots than in the shoots. This can be attributed to the intense cell division and expansion of young leaves, which are metabolically more active, consequently demanding a greater amount of P. On the other hand, the roots had sufficient P to be utilized in respiration and the maintenance of the antioxidant system in their tissues ([13]).
In this study, we found that low supply of P promoted an increase in acid phosphatase (APase) in shoots and roots of E. dunnii (Fig. S3e, Fig. S3f in Supplementary material), likely due to lower tissue P accumulation (Fig. 3). Therefore, the increase in APase activity occurs to maintain the internal homeostasis of inorganic phosphate (Pi) to supply it from organic P compounds in the cytoplasm and vacuoles ([17]). This reflects the greater need for P remobilization through APase activity in shoots in response to the relatively low ability of the roots to acquire P and meet the demand of the shoots.
Higher values of tissue P accumulation, root PUE, shoot PUE and total PUE were found in E. saligna and E. urograndis (Fig. 3, Fig. S4). This response most likely occurred because the plant organs of these clones have different competitive abilities to accumulate P, which has a positive relationship with the formation of assimilates, thus promoting the acquisition of resources and the development of sink organs ([48]). This suggests that P accumulation in different organs is strongly linked to the formation of assimilates in these organs ([11]). However, the lower total P accumulation in E. dunnii can be credited to the remobilization of P from other storage tissues or organs to growing tissues (e.g., leaves) or a consequence of lower P uptake efficiency.
Relationship among parameters
The results of principal component analysis (PCA) allowed us to clarify the effect of Eucalyptus species on phosphorus (P) levels in the soil. PCA revealed the existence of two groups based on response parameters : (i) E. saligna and E. urograndis; and (ii) E. dunnii (Fig. 5). There was a positive relationship of E. saligna and E. urograndis with growth parameters of the shoot and root system, P uptake efficiency, and status in the plant and photosynthetic efficiency. These Eucalyptus species have demonstrated higher P uptake efficiency, as well as improved shoot, root, and total P use efficiency, likely due to the better development of the root system (root surface area, volume, diameter and length), which facilitates soil exploration ([48], [27]). This is supported by the positive correlation observed between shoot, root, and total phosphorus accumulation. With the increase of P in plant tissues, there was an improvement in leaf gas exchange conditions (e.g., A, E, Ci, and WUE), as well as an increase in fluorescence efficiency (e.g., ETRm and Fv/Fm - [25]). This led to an increased C fixation and assimilation in leaf tissues, resulting in an increase in shoot, root, and total dry matter production as well as leaf area, which contributed to the increase in height and main root length of E. saligna and E. urograndis ([7], [27]).
The second group exhibited a positive relationship between E. dunnii and energy loss parameters, as indicated by fluorescence, oxidative stress, and antioxidant enzyme activity. This species exhibited sensitivity to stress conditions, particularly under low phosphorus (P) availability in the soil (Low P). Thus, there was an increase in the overproduction of ROS. Eucalyptus dunnii may have undergone an energy expenditure in response to the activation of both enzymatic and non-enzymatic antioxidant systems, which helped adjust ROS levels and prevent potential oxidative damage ([17]). As a consequence, photosynthetic stress was increased and more energy was lost via fluorescence dissipation, resulting in higher Fo and Fm values ([25]).
Conclusions
Differences in P level supply did not affect the initial growth of shoots and roots in clones of E. saligna and E. urograndis, which exhibited higher values of dry matter production, photosynthetic pigments, photosynthetic rate, and P accumulation in tissues, when compared to E. dunnii. Additionally, these clones showed lower stress and a reduced need to activate the antioxidant system. Eucalyptus saligna showed the highest rates of P influx and the lowest values of Cmin, while E. urograndis had the lowest values of Km under low P supply. E. saligna and E. urograndis were more efficient in absorbing phosphorous compared to E. dunnii, showing P uptake even at low concentrations. Biochemical and morphophysiological parameters were positively correlated with uptake kinetic parameters, such as lower Km and Cmin, and could be usefully integrated in Eucalyptus selection and breeding programs.
The Eucalyptus clones used in the study are already established in the commercial plantations of the Company that provided rooted minicuttings. However, due to company restrictions, further details about the Eucalyptus clones cannot be specified.
Funding
The authors are grateful to the Council for Scientific and Technological Development (CNPq) of Brazil for the awarded grant, as well as to Federal University of Santa Maria, RS, Brazil for providing the space and equipment necessary for the conduction of the current study.
Authors’ contributions
MVMA: Conceptualization, carrying out the experiments, biochemical and physiological analysis and data analysis, writing-revision and project administration. ÁLPB: Software, formal analysis, supervision and performance of experiments and biochemical and physiological analysis. CCK and TWP: Research, supervision, programming, carrying out experiments and biochemical and physiological analyses. MSSK: Formal Analysis, Software, Methodology, Supervision and Writing-Revision. DVV: Formal analysis and performance of the experiment and validation and project administration. TDA and VMS: validation, visualization, supervision, and analysis. GB: Fundraising, supervision, project co-supervision, writing and review. LAT: Conceptualization, project orientation, fundraising, biochemical and physiological analysis and writing-revision.
References
CrossRef | Gscholar
CrossRef | Gscholar
CrossRef | Gscholar
Gscholar
Gscholar
Authors’ Info
Authors’ Affiliation
Alvaro Luís Pasquetti Berghetti 0000-0001-8020-3200
Caroline Castro Kuinchtner 0000-0001-8193-7505
Matheus Severo De Souza Kulmann 0000-0001-9892-4057
Forest Sciences Department, Federal University of Santa Maria, Av. Roraima no. 1000 Cidade Universitária Bairro - Camobi, Santa Maria - RS, 97105-900 (Brazil)
Daniel Vinicios Valsoler 0000-0002-5648-3035
Tais Dorneles De Azevedo 0000-0002-0325-9339
Luciane Almeri Tabaldi 0000-0002-3644-2543
Biology Department, Federal University of Santa Maria, Av. Roraima no. 1000 Cidade Universitária Bairro - Camobi, Santa Maria - RS, 97105-900 (Brazil)
Gustavo Brunetto 0000-0002-3174-9992
Soil Science Department, Federal University of Santa Maria, Av. Roraima no. 1000 Cidade Universitária Bairro - Camobi, Santa Maria - RS, 97105-900 (Brazil)
Corresponding author
Paper Info
Citation
Miranda Aguilar MV, Pasquetti Berghetti AL, Kuinchtner CC, Wink Peixoto T, De Souza Kulmann MS, Valsoler DV, Dorneles De Azevedo T, Marques Soares V, Brunetto G, Almeri Tabaldi L (2025). Kinetic, morphophysiological, and biochemical parameters as a strategy to select clones of Eucalyptus spp. more efficient in phosphorus uptake. iForest 18: 212-222. - doi: 10.3832/ifor4643-018
Academic Editor
Pierluigi Paris
Paper history
Received: May 20, 2024
Accepted: Mar 31, 2025
First online: Aug 09, 2025
Publication Date: Aug 31, 2025
Publication Time: 4.37 months
Copyright Information
© SISEF - The Italian Society of Silviculture and Forest Ecology 2025
Open Access
This article is distributed under the terms of the Creative Commons Attribution-Non Commercial 4.0 International (https://creativecommons.org/licenses/by-nc/4.0/), which permits unrestricted use, distribution, and reproduction in any medium, provided you give appropriate credit to the original author(s) and the source, provide a link to the Creative Commons license, and indicate if changes were made.

Web Metrics
Breakdown by View Type
Article Usage
Total Article Views: 5832
(from publication date up to now)
Breakdown by View Type
HTML Page Views: 2283
Abstract Page Views: 1784
PDF Downloads: 1586
Citation/Reference Downloads: 5
XML Downloads: 174
Web Metrics
Days since publication: 337
Overall contacts: 5832
Avg. contacts per week: 121.14
Article Citations
Article citations are based on data periodically collected from the Clarivate Web of Science web site
(last update: Mar 2025)
(No citations were found up to date. Please come back later)
Publication Metrics
by Dimensions ©
Articles citing this article
List of the papers citing this article based on CrossRef Cited-by.
Related Contents
iForest Similar Articles
Research Articles
Energy production of poplar clones and their energy use efficiency
vol. 7, pp. 150-155 (online: 23 January 2014)
Research Articles
Growth performance and nitrogen use efficiency of two Populus hybrid clones (P. nigra × P. maximowiczii and P. trichocarpa × P. maximowiczii) in relation to soil depth in a young plantation
vol. 9, pp. 847-854 (online: 22 September 2016)
Research Articles
A comparison between stomatal ozone uptake and AOT40 of deciduous trees in Japan
vol. 4, pp. 128-135 (online: 01 June 2011)
Research Articles
Inorganic and organic nitrogen uptake by nine dominant subtropical tree species
vol. 9, pp. 253-258 (online: 02 December 2015)
Research Articles
Nutrient uptake, allocation and biochemical changes in two Chinese fir cuttings under heterogeneous phosphorus supply
vol. 11, pp. 411-417 (online: 05 June 2018)
Research Articles
Interaction between planting spacing and wood properties of Eucalyptus clones grown in short rotation
vol. 14, pp. 12-17 (online: 02 January 2021)
Research Articles
Revealing the physiological basis of forester’s choice of poplar clones (Populus spp.)
vol. 17, pp. 156-164 (online: 14 June 2024)
Research Articles
Changes in moisture exclusion efficiency and crystallinity of thermally modified wood with aging
vol. 12, pp. 92-97 (online: 24 January 2019)
Research Articles
Preliminary study on genetic variation of growth traits and wood properties and superior clones selection of Populus ussuriensis Kom.
vol. 12, pp. 459-466 (online: 29 September 2019)
Research Articles
Mapping Cadmium distribution in roots of Salicaceae through scanning electron microscopy with x-ray microanalysis
vol. 4, pp. 113-120 (online: 01 June 2011)
iForest Database Search
Search By Author
- MV Miranda Aguilar
- AL Pasquetti Berghetti
- CC Kuinchtner
- T Wink Peixoto
- MS De Souza Kulmann
- DV Valsoler
- T Dorneles De Azevedo
- V Marques Soares
- G Brunetto
- L Almeri Tabaldi
Search By Keyword
Google Scholar Search
Citing Articles
Search By Author
- MV Miranda Aguilar
- AL Pasquetti Berghetti
- CC Kuinchtner
- T Wink Peixoto
- MS De Souza Kulmann
- DV Valsoler
- T Dorneles De Azevedo
- V Marques Soares
- G Brunetto
- L Almeri Tabaldi
Search By Keywords
PubMed Search
Search By Author
- MV Miranda Aguilar
- AL Pasquetti Berghetti
- CC Kuinchtner
- T Wink Peixoto
- MS De Souza Kulmann
- DV Valsoler
- T Dorneles De Azevedo
- V Marques Soares
- G Brunetto
- L Almeri Tabaldi
Search By Keyword


